

Summary
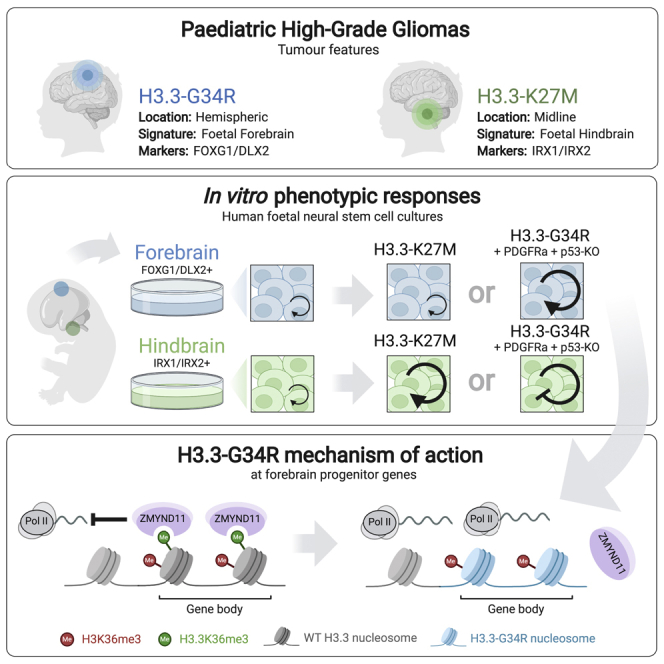
Point mutations within the histone H3.3 are frequent in aggressive childhood brain tumors known as pediatric high-grade gliomas (pHGGs). Intriguingly, distinct mutations arise in discrete anatomical regions: H3.3-G34R within the forebrain and H3.3-K27M preferentially within the hindbrain. The reasons for this contrasting etiology are unknown. By engineering human fetal neural stem cell cultures from distinct brain regions, we demonstrate here that cell-intrinsic regional identity provides differential responsiveness to each mutant that mirrors the origins of pHGGs. Focusing on H3.3-G34R, we find that the oncohistone supports proliferation of forebrain cells while inducing a cytostatic response in the hindbrain. Mechanistically, H3.3-G34R does not impose widespread transcriptional or epigenetic changes but instead impairs recruitment of ZMYND11, a transcriptional repressor of highly expressed genes. We therefore propose that H3.3-G34R promotes tumorigenesis by focally stabilizing the expression of key progenitor genes, thereby locking initiating forebrain cells into their pre-existing immature state.
Keywords: neurodevelopment, cancer, histone H3.3, neural stem cells, pediatric high-grade glioma, glioblastoma, DIPG, ZMYND11, forebrain
Graphical abstract
Highlights
-
•
Engineering of human cellular models of H3.3 mutant pHGGs
-
•
Regional identity provides competence for mutant H3.3 responses that mirrors pHGG
-
•
H3.3-G34R reinforces pre-existing forebrain progenitor transcriptional circuits
-
•
G34R mutation disrupts binding of the transcriptional repressor ZMYND11 to H3.3
Pediatric high-grade gliomas from different anatomical locations harbor distinct H3.3 mutations. Using human fetal neural stem cell models, Bressan et al. found that regional identity underlies cell-intrinsic competence for distinct oncogenic responses to K27M and G34R mutants. They show H3.3-G34R reinforces pre-existing forebrain-affiliated transcriptional circuits by disrupting ZMYND11 binding.
Introduction
Genetic disruptions in chromatin-regulating pathways have been identified across many adult and pediatric tumors, thereby providing direct evidence for the critical role of epigenetic dysregulation in driving cancer (Filbin and Monje, 2019; Mohammad and Helin, 2017; Valencia and Kadoch, 2019; Weinberg et al., 2017). A seminal discovery in the field was the identification of recurrent mutations affecting histone H3 and epigenetic regulatory proteins in pediatric cancers (Schwartzentruber et al., 2012; Wu et al., 2012). Unique to pediatric high-grade gliomas (pHGGs)—universally lethal childhood brain tumors (Jones et al., 2017)—are mutations in H3F3A, which encodes the replication-independent histone H3.3 (Ahmad and Henikoff, 2002). Two single-copy mutations occur within the histone tail and typically give rise to substitution of either lysine 27 to methionine (K27M) or glycine 34 to arginine (G34R) (Schwartzentruber et al., 2012; Wu et al., 2012).
Intriguingly, K27M and G34R mutations are mutually exclusive and have a distinct anatomical distribution within the central nervous system (CNS); K27M is typically found in brainstem tumors (hindbrain derived), whereas G34R occurs exclusively in hemispheric tumors (forebrain derived) (Mackay et al., 2017; Sturm et al., 2012). Biochemically, H3.3-K27M inhibits PRC2 (Polycomb Repressive Complex 2) and causes loss of the repressive mark H3K27me3 (Lewis et al., 2013), while H3.3-G34R is thought to disrupt methylation of H3K36 (Lewis et al., 2013; Voon et al., 2018). However, the exact cellular and epigenetic mechanisms by which these “oncohistones” operate during initiation of pHGGs and the reasons for their restricted anatomical specificity remain unknown (Filbin and Monje, 2019; Mohammad and Helin, 2017; Weinberg et al., 2017).
Here, we explore why these mutations arise with such anatomical precision. Of note, H3F3A is ubiquitously expressed across various tissues and we found no evidence of differential levels in the developing human CNS that could explain the biased distribution of the mutations (Figure S1). On the basis of the observation that H3.3 mutant tumors express region-specific neurodevelopmental signatures that correlate with their location (Mackay et al., 2017; Sturm et al., 2012), we hypothesized that transcriptional programs associated with regionalization of the developing brain provide the critical cell-intrinsic vulnerabilities for each distinct H3.3 mutant. Using primary human fetal neural stem cell (NSC) cultures, we demonstrate here that hindbrain cells are more susceptible to H3.3-K27M oncogenic effects, whereas forebrain NSCs have a unique competence to respond to H3.3-G34R. Focusing on H3.3-G34R, we find that the mutant histone does not induce pervasive transcriptional or epigenetic changes but rather reinforces the pre-existing progenitor state of the putative forebrain cell of origin, likely through impaired recruitment of the transcriptional repressor ZMYND11.
Results
Human fetal NSC cultures retain regional identity and recapitulate transcriptional signatures of pHGGs
We reasoned that human fetal NSC cultures (Conti et al., 2005; Sun et al., 2008) derived from anatomically relevant regions could provide a tractable experimental system to model cell-intrinsic responses to H3.3 mutations. This allows investigation of early responses in an appropriate human cellular context, without the confounding influences of region-specific microenvironmental or broader systemic cues inherent to in vivo systems. We therefore derived primary NSC cultures from various regions of the developing human CNS (Figure 1A; see STAR methods) and used these to assess the initial phenotypic responses to H3.3-K27M or H3.3-G34R oncohistones in vitro.
Figure 1.

Core transcriptional signatures of regional identity are captured in human primary fetal NSC cultures and define pHGG subtypes
(A) Overview of the approach used for derivation of human fetal region-specific NSC cultures. Three fetal specimens aged 13.5, 15.0, and 19.3 weeks of gestational age (WGA) (GCGR-NS13, GCGR-NS15, and GCGR-NS19, respectively) were used. Total RNA collected from the freshly dissected tissue segments was used as a reference control.
(B) Heatmap showing expression of forebrain- and hindbrain-specific genes in the freshly dissected tissue and matched NSC cultures. Forebrain- and hindbrain-specific gene symbols are shown in blue and green lettering, respectively. See STAR methods for details on generation of region-specific signatures.
(C) Principal-component analysis (PCA) of primary fetal tissue samples and NSC lines on the basis of 500 genes with the highest variance across all samples.
(D) Gene Ontology analysis of PCA loadings for principal component 1 (PC1) and principal component 2 (PC2). PC1, which segregates NSC lines from primary tissue samples, is enriched in neuronal differentiation terms. PC2 separates samples according to anatomical region of origin and is enriched in regionalization and anteroposterior specification terms.
(E) PCA plots of patient pHGG tumor samples. Left panel: PCA based on tumor-derived G34- and K27-mutant signatures. Right panel: PCA based on forebrain- and hindbrain-specific gene sets as in (A).
(F) Consensus clustering of patient pHGG tumor samples using G34/K27 (left) and forebrain/hindbrain (right) gene sets. Heatmaps are clustered using hierarchical clustering with Euclidean distance and average linkage criteria into three predominant groups corresponding to tumor H3.3 status.
(G) Boxplots of ssGSEA enrichment scores for K27 and G34 signatures among the established region-specific fetal NSC lines. Cell line numbering corresponds to the anatomical regions in (A). Boxes show median and first and third quartiles, and whiskers extend to 1.5 × the interquartile range (IQR).
(H) Boxplots of ssGSEA enrichment scores comparing forebrain and hindbrain signatures extracted from the primary fetal tissue datasets among pHGG H3.3 subtypes.
(I) Boxplots of ssGSEA enrichment scores comparing the gene sets extracted from the established NSC lines from each position among pHGG H3.3 subtypes.
Established cultures uniformly expressed NESTIN, SOX2, and other pan-NSC markers (Figures S2A and S2B) and could be expanded using culture conditions that support self-renewal (Conti et al., 2005). Importantly, mRNA profiling (RNA sequencing [RNA-seq]) revealed that key forebrain and hindbrain transcriptional signatures that define the primary tissue samples were retained in the matched NSC cultures: forebrain-specific markers (e.g., FOXG1, DLX2/6, EMX2) were highly expressed in neocortex and striatum NSCs, while posterior markers (e.g., IRX1/2 and HOX genes) were expressed in brainstem and spinal cord cultures (Figures 1B–1D and S2C).
To determine whether the region-specific fetal transcriptional signatures were relevant to pHGGs, we next compared our dataset with published primary tumor transcriptomes from three independent cohorts (Paugh et al., 2010; Schwartzentruber et al., 2012; Sturm et al., 2012). Indeed, through clustering approaches, the forebrain and hindbrain signatures successfully segregated the tumor samples on the basis of H3.3 mutation status (Figures 1E and 1F; Table S1). Conversely, K27M and G34R tumor signatures distinguished the fetal tissue and matched NSC cultures on the basis of their region of origin (Figures S2D and S2E; Table S1).
We next used single-sample gene set enrichment analysis (ssGSEA) to assess whether the pHGG subtype-specific signatures were specifically captured in the established NSC lines. Indeed, we observed enrichment of the G34R-associated signature in cultured neocortex and striatum NSCs, while the defining K27M signature was preferentially enriched in brainstem and spinal cord cultures (Figures 1G and 1H). Consistent with this, neocortex and striatum cell line-specific gene sets were specifically enriched in G34R mutant tumors, and brainstem and spinal cord NSC signatures in K27M tumors (Figure 1I). Thus, despite being expanded in identical culture conditions, NSC cultures largely retain their forebrain-hindbrain regional identities and recapitulate key transcriptional signatures that define pHGG subgroups.
Phenotypic responses to distinct H3.3 oncohistones mirror their anatomical selectivity in pHGGs
As the aforementioned results attested the relevance of our in vitro models for exploring pHGG etiology, we next set out to evaluate the impact of cell-intrinsic regional identity on the cellular responses to H3.3 mutants. We first focused on H3.3-K27M, as a previous study using mouse models suggested preferential oncogenic activity of K27M in the hindbrain compartment (Larson et al., 2019). We induced stable expression of either wild-type (WT) or K27M mutant H3.3 using the PiggyBac transposon system in forebrain (neocortex or striatum) and hindbrain (brainstem) NSC cultures derived from two independent human fetal specimens (GCGR-NS19 and GCGR-NS13; see STAR methods). A V5 epitope tag was fused to the C terminus of the construct to allow tracking of the ectopically expressed H3.3 protein (Figure 2A). Consistent with the reported biochemical activity of H3.3-K27M, we found substantial loss of total H3K27me3 levels in all lines, regardless of regional identity (Figure 2A). Phenotypically, however, overt oncogenic activity (i.e., increased proliferation and clonogenicity as well as reduced senescence-associated β-galactosidase [SA-βgal]) was observed only in brainstem but not forebrain NSCs (Figures 2B–2D). This indicates that global reduction of H3K27me3 alone is not sufficient to induce cellular responses and that H3.3-K27M tumor initiation may require a specific developmental cellular context. In a parallel study, we have characterized transcriptional and chromatin landscape changes in response to H3.3-K27M in the fetal brainstem NSCs (Brien, G. and Bressan, R. et al., submitted).
Figure 2.

H3.3-K27M preferentially increases growth of brainstem NSCs
(A) Immunocytochemistry analysis confirming comparable levels of V5-tagged WT and K27M H3.3 expression in the three regional NSC lines. Global loss of H3K27me3 is observed in H3.3-K27M-expressing cells. Representative images of the lines derived from specimen GCGR-NS13 are shown. Scale bar: 20 μm.
(B–D) Quantification of EdU incorporation, colony formation activity, and SA-βgal reactivity in the regional NSC lines carrying H3.3-WT and H3.3-K27M constructs. Plots depict mean ± SD in the indicated cell lines. Student’s t test p values are shown. n.s, non-significant. n = 3 or 4 independent experiments performed with three technical replicas each.
Given that region-specific cellular responses recapitulated the etiology of H3.3-K27M pHGGs, we next focused on understanding the less well studied H3.3-G34R mutant, for which mechanistic insights remain elusive and no models of tumor initiation are currently available to understand regional selectivity. Using the same experimental approach, however, we found that the G34R mutant does not induce any overt proliferative effects in forebrain cultures (Figures 3A–3E and S3A–S3C). In contrast, in brainstem cultures, H3.3-G34R surprisingly triggered a cytostatic response with reductions in EdU incorporation and colony formation, as well as an increase in SA-βgal activity (Figures 3B–3E). Together, our data indicate that while forebrain cells can tolerate H3.3-G34R, hindbrain NSCs are intrinsically protected against its oncogenic effect, potentially explaining the absence of G34R mutant tumors in posterior locations.
Figure 3.

H3.3-G34R triggers differential phenotypic responses in forebrain and brainstem NSCs
(A) Immunoblot confirming comparable expression of V5-tagged H3.3 in the NSC lines carrying WT and G34R H3.3 constructs. Representative images from GCGR-NS13 lines are shown. Forebrain marker FOXG1 is used as a control.
(B) Quantification of EdU incorporation in the regional NSC lines expressing H3.3-WT and H3.3-G34R. Plots depict mean ± SD in the indicated cell lines. Student’s t test p values are shown. n = 3 or 4 independent experiments performed with three technical replicas each.
(C) Quantification of colony formation activity of regional NSC lines expressing H3.3-WT and H3.3-G34R. Individual dots represent the absolute colony counting per well. Horizontal lines represent mean ± SD. Student’s t test p values are shown.
(D and E) Quantification of apoptotic (active caspase-3-positive) and senescent (SA-βgal-positive) cells in the regional NSC lines carrying H3.3-WT and H3.3-G34R constructs. Plots depict mean ± SD percentage of positive cells. p value by Student’s t test. n = 3 independent experiments performed with three or four technical replicas each.
(F) Immunoblot confirming loss of P53 protein and ectopic expression of V5-tagged H3.3 and PDGFRa in the engineered GCGR-NS13 neocortex and brainstem PP5W and PP5G cells. Non-edited cells were used as controls.
(G) Phenotypic in vitro characterization of GCGR-NS13 neocortex and brainstem PP5W and PP5G cells. Plots show quantification of EdU incorporation (n = 3), colony formation (n = 12), and SA-βgal assays (n = 3).
(H) Kaplan-Meier curve showing survival data of immunocompromised mice transplanted with GCGR-NS13 neocortical PP5W and PP5G cells.
(I) Analysis of brain tissue from mice transplanted with GFP-labeled neocortical PP5W and PP5G cells. Left panel shows microscopic views of freshly dissected tissue. Right panel shows immunohistochemistry images (coronal sections) of the corresponding specimens. Transplanted human cells are labeled by GFP. Scale bar: 1.5 mm.
See also Figure S3.
Because of the lack of overt phenotypic responses to H3.3-G34R in forebrain-derived NSCs, we reasoned that even in an appropriate developmental context, cooperating mutations are required for manifestation of its oncogenic effects. We therefore introduced two additional oncogenic alterations commonly found in pHGGs: PDGFRA amplification and TP53 loss of function (Mackay et al., 2017; Figure 3F; hereafter referred to as PP5W or PP5G, for PDGFRA overexpression, P53 knockout [KO], and WT or G34R-mutant H3.3, respectively). Indeed, compared with the WT H3.3 control (PP5W), neocortical PP5G cells displayed increased proliferation and clonogenicity, as well as a reduction in SA-βgal activity (Figure 3G). Upon transplantation into the cerebral hemisphere of immunocompromised mice, neocortical PP5G cells formed highly infiltrative neoplastic lesions, confirming the anticipated role for H3.3-G34R in tumor initiation (Figures 3H and 3I). In stark contrast, engineering of PP5G mutations in brainstem NSCs triggered a strong cytostatic response compared with the PP5W control (Figure 3G) and did not render the cells tumor initiating (data not shown). Similarly, combined engineering of TP53 KO and H3.3-G34R, without PDGFRA overexpression, also increased the proliferation of neocortical cultures, while inducing a cytostatic response in the brainstem counterpart (Figures S3D–S3F).
In summary, these findings demonstrate that despite the identical culture conditions and similarities in broad NSC definition, regionally distinct fetal NSCs display profound differences in their cell-intrinsic responses to oncohistones. Together, these highlight the importance of the regional identity in providing competence to distinct H3.3 mutations, which may explain the unique anatomical distribution of pHGGs in patients.
H3.3-G34R reinforces the transcriptional circuits that define forebrain identity
The preceding data suggested a role for H3.3-G34R in cooperation with other drivers within the forebrain. We next sought to investigate the effect of H3.3-G34R in fully transformed patient-derived tumor cells by eliminating the oncogenic allele and subsequent dissection of key downstream consequences in isogenic matched pairs. To that end, we used the CRISPR-Cas9 system to genetically inactivate the H3F3A G34R mutant allele in a previously described mutant cell line (pGBM002) derived from a hemispheric (forebrain) patient tumor (Hennika et al., 2017; Figures 4A, S4A, and S4B). Similarly to the primary forebrain NSC cultures, the patient cells uniformly expressed the NSC markers SOX2 and NESTIN and transcriptionally resembled the fetal forebrain. In addition, immunoblotting indicated absence of ATRX protein, a H3.3 chaperone often mutated in G34R mutant pHGGs (Mackay et al., 2017; Figure S4A).
Figure 4.

Genetic ablation of mutant H3F3A allele in patient-derived NSC line reveals forebrain neuroprogenitor genes as downstream targets of H3.3-G34R
(A) Schematics of the strategy used to inactivate the H3F3A G34R allele through CRISPR-Cas9 gene editing. The G-to-A nucleotide substitution causing the G34R mutation occurs 5′ adjacent to a GGG stretch (red) that serves as a protospacer adjacent motif (PAM) for Cas9 recognition. As mismatches within the PAM-proximal region preclude Cas9 cleavage, this allows the design of a sgRNA (blue sequence) that specifically cuts the G34R allele. Dashed rectangles show codons for residues Gly34 (WT) or Arg34 (G34R).
(B) Genotyping result of the parental and a representative G34R-KO clone. WT allele remains intact, while G34R allele harbors a frameshifting 1 bp deletion at the predicted cut site (yellow arrow).
(C) Immunocytochemistry confirms loss of H3.3-G34R protein expression in the G34R-KO cells. Parental line and representative G34R-KO clone are shown. Scale bar: 50 μm.
(D) Confluence analysis indicates impaired in vitro growth of G34R-KO clones. ∗∗∗∗Adjusted p < 0.0001 by one-way ANOVA followed by Dunnett’s test (each G34R-KO clone versus parental cells at 240 h elapsed). Plot shows results of one representative experiment performed with four technical replicas.
(E–G) Quantification of EdU incorporation, colony formation, and SA-βgal reactivity in parental and clonal G34R-KO pGBM002 cells. Plot depicts mean ± SD. ∗p < 0.05, ∗∗∗p < 0.001, and ∗∗∗∗p < 0.0001 by one-way ANOVA followed by Dunnett’s multiple-comparisons test (mean of each clone versus parental). n = 4 independent experiments performed with three or four technical replicas each.
(H) Results of xenotransplantation experiments with patient-derived pGBM002 cells. Left panel shows representative images of in vivo bioluminescence imaging of intracranial tumors formed by parental and a G34R-KO clonal line. Kaplan-Meier curve (right) shows survival data of mice transplanted with the parental cells (blue line) and G34R-KO clones (gray lines).
(I) PCA plot confirming consistent transcriptional changes between parental pGBM002 (three independent passages) and three G34R-KO clonal lines (one passage each). The 500 genes with highest variance across samples were used for the PCA.
(J) Volcano plot showing differentially expressed genes between parental and G34R-KO clonal lines. Upregulated and downregulated genes in the G34R-KO clones are shown in red and blue, respectively. Vertical dotted lines mark absolute log2 fold change > 1. Horizontal lines, false discovery rate (FDR) < 0.05.
(K) Gene Ontology (GO) analysis of downregulated and upregulated genes (FDR < 0.05) in G34R-KO clones.
(L) Heatmap showing expression of genes within the “Forebrain Development” GO term found to be downregulated in G34R-KO clones.
(M) Boxplot showing expression levels of the indicated forebrain progenitor-related genes in hemispheric pHGG patient tumor samples. Data were retrieved from the pediatric cBioPortal (see STAR methods). Only specimens whose hemispheric location could be ascertained were included. ∗p < 0.05, ∗∗p < 0.01, ∗∗∗p < 0.001, and ∗∗∗∗p < 0.0001 by Student’s t test (WT versus G34R/V groups).
See also Figure S4.
Following delivery of a mutant allele-specific single guide RNA (sgRNA), five independent H3.3-G34R-KO (G34R-KO) clonal lines were isolated and functionally characterized (Figures 4B–4G). Compared with the parental cells, each displayed a similar phenotype, with slightly slower proliferation, reduced clonogenicity, and accumulation of SA-βgal-positive cells (Figures 4C–4G). Importantly, in vitro overexpression of V5-tagged G34R-H3.3, but not WT H3.3, was able to rescue the proliferative effect, thus validating the specificity of the KO experiment (Figure S4C).
To dissect the mechanisms underlying the oncogenic effect of H3.3-G34R, we next defined the key transcriptional changes through mRNA-seq in the parental pGBM002 cells and G34R-KO clones (Figures 4I–4L). Consistent with the cellular responses, principal-component analysis confirmed separation of the G34R-KO clones as a distinct cluster from the parental cells (Figure 4I). Interestingly, we observed significant downregulation of many genes associated with forebrain development and neuroprogenitor proliferation in the G34R-KO cells, including CDK6 (Mi et al., 2013), SOX1/2 (Pevny and Placzek, 2005), POU3F2/3 (Castro et al., 2006), ARX (Kitamura et al., 2002), and DMRTA2 (Konno et al., 2012; Young et al., 2017; Figures 4J–4L). We identified only a marginal reduction in the expression of MYCN, a previously suggested target of H3.3-G34R on the basis of differential expression analysis of non-isogenic tumor cell lines (Bjerke et al., 2013).
Analysis of transcriptomic data from patient tumor samples demonstrated that many of these forebrain-related genes were also more highly expressed in H3.3-G34R-mutant than H3.3-WT tumors of hemispheric location (Figures 4M and S4D). Altogether, these findings suggest that H3.3-G34R acts cell-autonomously to reinforce or stabilize a specific forebrain regulatory circuit present in the cell of origin. In agreement, we found that key transcription factor genes involved in neuroprogenitor self-renewal and proliferation were also upregulated in the engineered fetal neocortex model (PP5G versus PP5W cells; Figures S3G and S3H). These included the neuroprogenitor markers OLIG2 and SOX3, as well as the forebrain-specific factors EMX2, NR2F1, HOPX, DMRTA2, and HIVEP2 (Bertacchi et al., 2020; Zweifel et al., 2018; Steinfeld et al., 2016; Ono et al., 2008; Yoshida et al., 1997). Of those, we note that DMRTA2, EMX2, NR2F1, and HIVEP2 were shared between engineered neocortex and patient-derived models and may be part of a core regulatory network affected by H3.3-G34R.
In contrast, no alterations in the expression of forebrain neural progenitor-related genes were observed in the engineered PP5W/G brainstem NSCs. Instead, transcriptional profiling indicated only modest global transcriptional changes (Figure S3H); however, most notably, we observed a robust upregulation of the senescence effector and tumor-suppressor gene CDKN1A (encoding p21) (Abbas and Dutta, 2009). Intriguingly, no significant transcriptional changes were observed in the single-mutant neocortex cells (G34R versus WT H3.3; Figure S3H), suggesting that manifestation of the H3.3-G34R effects at the transcriptional level might also require additional oncogenic signaling. Thus, we surmise that H3.3-G34R, in contrast to H3.3-K27M, requires additional oncogenic signaling for phenotypic activity and does not induce widespread transcriptomic changes. It instead appears to reinforce the pre-existing progenitor state of the forebrain cell of origin through increased expression of key transcriptional regulatory genes.
H3.3-G34R incorporates at pre-existing active genes and does not induce global changes in chromatin marks
We next capitalized on our patient-derived isogenic models to dissect the molecular mechanism underlying H3.3-G34R activity. In agreement with previously reported biochemical analyses (Lewis et al., 2013), we did not detect dramatic changes in total histone H3 post-translational modifications, supporting the idea that unlike H3.3-K27M, H3.3-G34R does not act in a dominant manner to disrupt histone modification levels globally (Figure S5A).
To investigate whether G34R-H3.3 causes differential distribution of chromatin modification marks, we next mapped the genome-wide distribution of the mutant histone as well as active (H3K4me3/H3K36me3) and repressive (H3K27me3) histone marks through chromatin immunoprecipitation sequencing (ChIP-seq) using parental and G34R-KO pGBM002 cells (Figure 5A). Similar to the reported distribution pattern of WT H3.3 at euchromatin (Goldberg et al., 2010), we observed higher H3.3-G34R enrichment at active promoters and gene bodies, which are marked respectively by high levels of H3K4me3 and H3K36me3 (Figures 5B, 5C, S5B, and S5C). Consistently, H3.3-G34R ChIP reads directly correlated with mRNA expression levels, indicating greater levels of H3.3-G34R incorporation at highly transcribed genes (Figures 5D, 5E, and S5D). Importantly, using the V5-H3.3-rescued G34R-KO cells, we found a strong correlation between WT and G34R V5-H3.3 ChIP signal (Figures 5F and 5G), indicating that the mutation does not grossly affect the H3.3 distribution patterns.
Figure 5.

Genome-wide profiling of H3.3 and associated histone H3 marks in isogenic patient-derived H3.3-G34R pHGG cells
(A) Heatmaps and metagene plots showing H3.3-G34R, H3K4me3, H3K36me3, and H3K27me3 ChIP-seq signal at all annotated human genes (hg38 knownGene) in parental and G34R-KO pGBM002 cells. Genes within each heatmap are ranked by abundance of the H3.3-G34R or indicated histone mark in the parental cells.
(B) Boxplots depicting abundance of the indicated histone H3 modifications (log2 reads per kilobase of transcript per million mapped reads [RPKM]) at genes grouped into quantiles of G34R abundance. Quantiles 1 and 4 include, respectively, genes with the lowest and highest H3.3-G34R coverage levels. Boxes show median and first and third quartiles, and whiskers extend to 1.5 × the IQR (n = 2 replicates for each histone mark).
(C) Boxplots depicting abundance of H3.3-G34R (log2 RPKM) at genes grouped into coverage quantiles of the indicated histone mark. Quantiles 1 and 4 include genes with the lowest and highest levels of each mark, respectively (n = 2).
(D) Boxplots depicting total mRNA expression levels (log2 RPKM) per H3.3-G34R quantile in parental and G34R-KO cells (n = 3).
(E) Boxplot depicting H3.3-G34R coverage (log2 RPKM) in parental cells per mRNA expression quantiles defined in parental (left) and G34R-KO (right) cells. Quantiles 1 and 4 include, respectively, genes with the lowest and highest absolute mRNA expression levels (n = 2).
(F) Scatterplot showing V5-H3.3 coverage per 50 kb genomic bins in G34R-KO cells rescued with V5-tagged H3.3-WT and H3.3-G34R construct. Density reported as log2 density. SCC = 0.91, p < 0.001.
(G) Tracks of V5-WT and V5-G34R H3.3 normalized coverage (RPM) over chromosome 8 (upper) and selected region (lower, Chr8 p22-21.2).
(H) Log2 fold change (parental versus G34R-KO cells) in H3K4me3, H3K36me3, and H3K27me3 coverage (RPKM) within each H3.3-G34R quartile.
(I) Venn diagrams and metagene plots of common and exclusive peaks in pGBM002 parental and G34R-KO lines. Peaks were selected as promoter specific (±2 kb from transcription start site [TSS]) for H3K4me3 and H3K27me3 histone marks, and gene body associated (between TSS and transcription end site [TES]) for H3K36me3.
(J) RNA-seq mRNA log2 fold change (parental vs. G34R-KO) of genes associated with peaks defined in (I).
See also Figures S5 and S6.
As altered patterns of genome-wide H3.3 distribution appear unlikely to explain the G34R transcriptional effects, we next sought to address whether incorporation of the mutant histone influenced the deposition patterns of the histone marks. Surprisingly, we did not find any significant correlation between G34R-H3.3 enrichment and changes in H3K4me3, H3K36me3, or H3K27me3 levels (Figures 5H and S5C), indicating that the G34R mutant does not directly alter deposition of major histone marks as described for the other H3.3 oncohistones (Chan et al., 2013; Lewis et al., 2013; Fang et al., 2016; Lu et al., 2016; Khazaei et al., 2020). To further validate these observations, we next used ChIP peak calling to analyze the distribution of each histone mark at their cognate genomic regions (i.e., H3K4me3 and H3K27me3 at gene promoters and H3K36me3 at gene bodies) (Figure 5I). In agreement, we found a large degree overlap of promoter-associated H3K4me3 and gene body-associated H3K36me peaks between parental and G34R-KO cells. Importantly, closer examination of the identified exclusive peaks (either parental or G34R-KO specific) indicated that those were low abundance peaks with only marginally lower levels in the reciprocal line (Figure 5I). Importantly, those differentially bound peaks were not associated with consistent transcriptional expression changes of the underlying genes (Figure 5J). To a lesser extent, a high degree of overlap in repressive promoter-associated H3K27me3 peaks was also observed. Importantly, despite the detection of parental or G34R-KO-specific peaks, these were not associated with major transcriptional changes (Figures 5I and 5J). A similar pattern of genome-wide distribution of the investigated histone marks was also observed in the V5-H3.3-rescued G34R-KO cells (Figure S6).
These data indicate that unlike H3.3-K27MM and other H3.3 oncogenic forms, H3.3-G34R does not induce widespread epigenetic or transcriptional changes and might instead operate through fine-tuning of pre-existing expressed genes where it accumulates at the highest levels.
G34R mutation disrupts binding of H3.3 to the transcriptional repressor ZMYND11
As H3.3 contributes to a small fraction of the total histone H3 pool within cells, and initial biochemical studies indicated that the G34R mutation prevents SETD2-mediated tri-methylation of the K36 residue on the mutant histone only (i.e., cis loss of K36me3; Lewis et al., 2013; Zhang et al., 2017), we speculated that the mutation could impose transcriptional alterations through loss of H3.3K36me3 at specific loci. Using immunoprecipitation of the ectopically expressed V5-tagged H3.3 in G34R-KO rescued cells, we confirmed in a disease-relevant cellular context that the G34R mutation indeed causes loss of K36me3 on mutant histone but not on the total H3 pool (Figure 6A). In agreement, we found that the genes most downregulated in G34R-KO cells (i.e., candidate G34R-upregulated targets) had higher than average H3.3-G34R coverage along their promoter and gene body regions (Figure 6B). Importantly, H3.3-G34R coverage appears particularly higher at the set of forebrain-related genes that are downregulated upon ablation of the G34R allele (Figures 6B and 6C), altogether indicating that H3.3-G34R acts mainly through transcriptional upregulation.
Figure 6.

G34R mutation precludes binding to the transcriptional repressor ZMYND11
(A) Immunoblotting of immunoprecipitated H3.3-WT and H3.3-G34R ectopically expressed in G34R-KO pGBM002 cells. Endogenous (lower band) and V5-tagged ectopic H3.3 (upper band) are indicated. Loss of K36me3 is specific to ectopic H3.3-G34R. Non-transfected G34R-KO cells were used as controls (first and fourth lanes).
(B) Metagene plot (left) and boxplot (right) showing H3.3-G34R coverage for expressed, upregulated, downregulated – all, and downregulated – forebrain associated genes. Expressed genes were defined as those with mean RPKM > 1 within pGBM002 parental samples (see STAR methods). All other gene sets were defined on the basis of differential expression between G34R-KO and parental cells (Figures 4I–4L). ∗∗∗p < 0.005 and ∗∗∗∗p < 0.0001 for pairwise comparisons against the “all expressed” group. See STAR methods for details on the statistical test.
(C) Genomic track showing H3.3-G34R enrichment and mRNA expression at DMRTA2 (left) and DLX1 (right) loci. DMRTA2 and DLX2 are shown, respectively, as representative downregulated and unchanged forebrain-related genes.
(D) Volcano plot showing differentially bound partners of ectopically expressed WT and G34R H3.3 identified through IP-MS. x axis shows the fold-change value (G34R/WT) and y axis shows p value (−log10 scale) for statistical significance. Absolute 3-fold change and a p value of 0.1 (vertical and horizontal dashed lines, respectively) were used as the threshold cutoffs. Blue and green dots depict partners with increased and decreased binding to H3.3-G34R, respectively.
(E) Immunoblotting analysis for ZMYND11 and HIRA co-immunoprecipitated with ectopic V5-H3.3 (WT and G34R) in G34R-KO pGBM002 cells and engineered neocortex NSC models (H3.3 overexpression alone or in the PP5W/PP5G lines).
(F) Boxplots showing quantification of sequence features for full transcript and exonic and intronic ranges in the defined gene sets. ∗∗p < 0.05, ∗∗∗p < 0.005, and ∗∗∗∗p < 0.0001 for pairwise comparisons against the “all expressed” group. See STAR methods for details on the statistical test.
See also Table S2.
To address in an unbiased manner whether differential recruitment of biochemical partners may underlie the transcriptional changes imposed by H3.3-G34R, we next performed V5 epitope-based pull-down followed by mass spectrometry in order to identify protein interaction partners of WT and G34R-mutant H3.3 in the rescued G34R-KO cells (Figure 6D; Table S2). Strikingly, we found that H3.3-G34R has reduced binding to ZMYND11, a specific reader of H3.3K36me3 that functions as an unconventional transcription co-repressor by modulating elongation and splicing of highly expressed genes (Wen et al., 2014; Guo et al., 2014). Reduced binding to ZMYND11 was also confirmed by co-immunoprecipitation (co-IP) experiments in both patient-derived and engineered forebrain NSC isogenic cell line pairs (Figure 6E).
Further supporting the involvement of ZMYND11, we found using computational analyses that genes preferentially affected by H3.3-G34R (including the set of key forebrain-associated genes) collectively display sequence features, such as higher CpG content and presence of intragenic CpG islands (Figure 6F), that are associated with the control of transcriptional elongation and splicing (Veloso et al., 2014, Monteuuis et al., 2019). Altogether, these data support a model in which G34R-induced loss of H3.3K36me3 at highly expressed loci (including forebrain master regulator genes such as DMRTA2 and ARX) precludes recruitment of the transcriptional repressor ZMYND11. We surmise that this ultimately results in elevated transcriptional output of such genes and helps sustain the core regulatory network of forebrain identity. Because of the presence of high H3.3 incorporation and unique gene sequence features (e.g., high intragenic CpG content), we speculate that the altered genes may have specific requirements for elongation and/or splicing control mechanisms that explain their increased sensitivity to disruption of ZMYND11 recruitment.
FOXG1 is a competence factor that enables H3.3-G34R-driven transformation
Surprisingly, despite the transcriptional changes and in vitro phenotype conferred by H3.3-G34R, we found that G34R-KO patient cells were still able to form tumors upon xenotransplantation (Figure 4H), suggesting that the mutation might be dispensable later in tumorigenesis, once widespread genomic disruptions have accumulated. Given the cytostatic effect triggered by H3.3-G34R in non-forebrain cells, we reasoned that targeting components of the forebrain transcriptional network could provide an alternative strategy to limit tumorigenicity of fully transformed cells. Interestingly, we observed that the cytostatic effect induced by H3.3-G34R in brainstem NSCs is accompanied by activation of the senescence effector CDKN1A/p21 (Figures S7A and S7B), suggesting that cellular senescence is a key protective mechanism that can be overcome in forebrain cells.
We therefore focused on the transcription factor FOXG1, a master regulator of forebrain identity and known suppressor of the CDKN1A/p21 locus during brain development (Xuan et al., 1995; Seoane et al., 2004; Siegenthaler et al., 2008; Yip et al., 2012; Lujan et al., 2012). Two other aspects of FOXG1 biology were relevant. First, FOXG1 is the most upregulated transcription factor gene in forebrain versus hindbrain NSC cultures (Figure 1B). Second, FOXG1 is expressed at high levels in hemispheric pHGGs independently of the H3.3-G34R mutation (Figures 7A, S7C, and S7D) and in many adult HGGs (Verginelli et al., 2013; Bulstrode et al., 2017).
Figure 7.

Genetic disruption of FOXG1 impairs tumorigenesis of patient-derived G34R mutant cells
(A) Expression levels of FOXG1 mRNA in patient pHGG primary tumors. Data were retrieved from the integrated pHGG transcriptomic dataset available on the pediatric cBioPortal (see STAR methods). ∗∗∗∗p < 0.0001 by one-way ANOVA followed Tukey’s multiple-comparisons test.
(B) Immunoblot analysis confirming loss of FOXG1 protein in the pGBM002-knockout clonal line.
(C) Quantification of EdU incorporation (24 h pulse) and colony formation activity in parental and FOXG1-knockout pGBM002 cells. Plot depicts mean ± SD. ∗∗∗∗p < 0.0001 by Student’s t test. n = 4 independent experiments performed with three or four technical replicas each.
(D) Immunoblot analysis showing increased p21 expression in the FOXG1-knockout clonal line. TGFβ treatment was used to stabilize p21 protein expression as previously described (Seoane et al., 2004).
(E) In vivo bioluminescence imaging of mice transplanted with parental and FOXG1-knockout pGBM002 cells. Plot depicts absolute luminescence values (photons per second) per mouse at the indicated time points. Representative images were collected at 150 days following transplantation.
(F and G) Representative immunohistochemistry images of the brain tissue and Kaplan-Meier survival curve of immunocompromised mice transplanted with parental and FOXG1-knockout pGBM002 cells. Mice in the FOXG1-KO group were sacrificed after 400 days, and no signs of tumor formation were observed. Scale bar: 1.5 mm.
(H) qRT-PCR quantification of FOXG1 expression in H3.3-G34R-mutant pGBM002 and H3.3-WT adult HGG (aGBM7 and aGBM313) lines. Primary fetal neocortex and brainstem NSC lines (specimen GCGR-NS19) were used for comparison. n = 2 or 3 independent passages of each cell line.
(I) Western blotting showing protein expression of FOXG1 and p21 in parental and respective FOXG-KO lines. H3.3 status of each line is shown in the round rectangles below the panel.
(J) qRT-PCR quantification CDKN1A expression in FOXG1-KO cells. Parental cells were used as normalizer for each pairwise comparison. ∗∗p < 0.01 by Student’s t test. n = 3 independent passages of each cell line.
(K and L) Quantification of EdU incorporation (2 h pulse) and SA-βgal reactivity in FOXG1-KO and respective parental lines. Plots depict mean ± SD. ∗p < 0.05 and ∗∗∗p < 0.001 by Student’s t test. n = 3 or 4 technical replicates.
See also Figure S7.
Strikingly, ablation of FOXG1 through CRISPR-Cas9 gene editing led to reduced proliferation with concomitant p21 upregulation in vitro (Figures 7B–7D) and loss of tumor formation capacity of H3.3-G34R patient-derived cells in vivo (Figures 7E–7G). In contrast, ablation of FOXG1 in two independent H3.3-WT adult hemispheric HGG patient lines with comparable expression levels did not induce p21 upregulation or impaired proliferation, suggesting a stronger dependency of H3.3-G34R-mutant cells on FOXG1 expression (Figures 7H–7L). We therefore propose that FOXG1 acts as a regionally restricted competence factor for H3.3-G34R via establishment of the permissive forebrain transcriptional state and/or direct protection against H3.3-G34R-induced p21 activation.
Discussion
Here we demonstrated that human forebrain and hindbrain self-renewing NSC cultures provide a disease-relevant model to explore cellular responses to H3.3 oncohistones and dissect the molecular events underlying initiation of pHGGs. These engineered models should complement insights from patient-derived material, which are often too corrupted and heterogeneous to retrospectively delineate programs of early oncogenesis. At a practical level, the isogenic NSC models can be expanded continuously to large numbers, are amenable to genetic manipulation (Bressan et al., 2017), and, similar to adult glioma stem cell lines (Pollard et al., 2009), represent a tractable experimental system for chemical and genetic screens in search of new therapeutic targets in pHGGs.
Importantly, working with tissue-derived lines overcomes many of the shortcomings associated with models based on embryonic stem cells (ESCs) or induced pluripotent stem cells (iPSCs), which are often highly capricious, require lengthy differentiation protocols, and result in heterogeneous mixtures of cell types. Noteworthy, in addition to dissecting the role of H3.3 oncohistones, the defined origin and identity of our primary fetal NSC lines may also facilitate modeling of other pediatric tumors that arise in specific CNS compartments, such as medulloblastoma or ependymoma (Gibson et al., 2010: Johnson et al., 2010). In light of this, we and others are developing a large collection of human fetal NSC lines across different temporal and spatial identities that should enable functional dissection of diverse brain tumor drivers and are being made available to the research community (www.gcgr.org.uk).
Further leveraging on our isogenic models, we were able to garner molecular insights into the H3.3-G34R mode of action in the relevant cellular context. Through a combination of mRNA profiling and mapping of histone post-translational modifications, we observed that H3.3-G34R does not induce pervasive transcriptional or epigenetic changes but rather operates at already highly expressed genes, including key forebrain NSC transcription factors. These findings clearly contrast to the reported effects of H3.3-K27M in midline pHGGs and other H3.3 driver mutations present in pediatric sarcomas, in which the oncohistones appear to cause widespread resetting of epigenetic landscapes (Chan et al., 2013; Fang et al., 2016; Lu et al., 2016; Khazaei et al., 2020).
In addition, by exploiting the epitope-tagged version of H3.3, we were able to map key protein interaction partners of H3.3-G34R in patient-derived cells. Consistent with the idea of alterations at specific loci, we identified disrupted binding to ZMYND11, a putative tumor suppressor that is associated with highly expressed genes and operates as a transcriptional co-repressor through modulation of elongation and splicing. Interestingly, a previous study also identified a clonal ZMYND11 loss-of-function mutation in hemispheric pHGGs lacking H3.3-G34R, suggesting that they may operate through a shared pathway (Salloum et al., 2017).
We therefore propose a working model in which H3.3-G34R does not induce de novo changes in transcriptional state but instead acts to fine-tune expression of key transcriptional regulatory genes via the release of ZMYND11-based transcriptional repression. Ultimately, this reinforces the pre-existing progenitor state of the forebrain cell of origin and likely locks cells into a proliferative state. Although mechanistically different, these findings add to emerging evidence that mutations in histone and chromatin regulatory genes captures susceptible stem cell and progenitor states to drive initiation of pediatric tumors (Funato et al., 2014; Jessa et al., 2019; Khazaei et al., 2020; Lu et al., 2016; Pathania et al., 2017; Vladoiu et al., 2019). Further studies will now be needed to deeply assess the impact of H3.3-G34R on transcriptional elongation and/or alternative splicing and whether its effect can be fully recapitulated by ZMYND11 loss of function. Similarly, in-depth biochemistry and structural analyses will be required to dissect whether ZMYND11 binding is directly impaired by the G34R substitution or rather an indirect consequence of K36me3 loss on the mutant histone.
Finally, our data suggest that targeting core lineage-affiliated transcription factors, such as FOXG1, might be an attractive approach for therapeutic development. Although the design of conventional small-molecule inhibitors that target transcription factors presents considerable challenges, there has been significant progress in targeting these with innovative strategies, including modulation of auto-inhibition, proteolysis-targeting chimeras (PROTACs), and cysteine reactive inhibitors (Bushweller, 2019). Increased understanding of transcription factor biochemical functions may further reveal critical post-translational modifications and/or co-factors that could be disrupted for therapeutic purposes. We also note the shared dependencies on FOXG1 for both pediatric H3.3-G34R mutant and adult HGGs (Bulstrode et al., 2017; Verginelli et al., 2013). It appears that despite being driven by divergent genetic disruptions (Jones et al., 2017), both adult and pediatric diseases may converge and harness elevated expression of a forebrain neural stem/progenitor cell transcriptional network. It will be interesting in future studies to explore the role of other key components of the forebrain regulatory circuit and to dissect in detail how these are established and affected by H3.3-G34R.
In conclusion, our findings indicate that cell-intrinsic programs associated with regional identity of human neural progenitor cells provide unique vulnerabilities to distinct H3.3 oncohistones, which may explain the unique anatomical distribution of high-grade gliomas in children. Further work will now be needed to fully dissect why regional progenitor states are differentially sensitized to each H3.3 mutation and whether mechanisms sustaining forebrain and hindbrain identities could be targeted for therapeutic purposes. Our hope is that this identification of the crucial target cell populations, and underlying mechanisms of susceptibility, may ultimately lead to more effective therapies for this devastating disease.
Limitations of study
A current major limitation in studies of pHGG is the difficulty in obtaining tumor specimens and patient cell lines because of the challenging anatomical location and rarity of the disease. Although our findings with the patient-derived pGBM002 cell line are supported by the engineered fetal NSC models and rescue experiments, it will be important to further validate key target genes and the requirement of the mutant histone in late tumorigenesis as novel models emerge and other patient lines became available to the community. Similarly, while we demonstrate the importance of the forebrain developmental context, it will be important to determine in future studies whether dorsal-ventral regional programs or progenitor subtype identities provide further layers of competence to H3.3-G34R. Mechanistically, deeper analyses of the total RNA expression will be required to explore the impact of H3.3-G34R on elongation and splicing control and whether ZMYND11 inhibition recapitulates the effect of H3.3-G34R. Finally, in exploring the role of FOXG1, we have been unable to isolate expandable cells following conventional KO and overexpression approaches in forebrain and hindbrain NSC cultures, respectively. Modulation of FOXG1 expression using CRISPRa/CRISPRi might provide an alternative experimental strategy to further delineate its role as a competence factor.
STAR★Methods
Key resources table
| REAGENT or RESOURCE | SOURCE | IDENTIFIER |
|---|---|---|
| Antibodies | ||
| Mouse Anti-V5 tag | eBioscience | Cat. 14-6796-82; RRID: AB_10718239 |
| Mouse Anti-Foxg1 | In house | N/A |
| Mouse Anti-Total H3 | Abcam | Cat. ab24834; RRID: AB_470335 |
| Rabbit Anti-cleaved Caspase-3 | Cell Signaling Technology | Cat. 9661; RRID: AB_2341188 |
| Mouse Anti-p53 | Cell Signaling Technology | Cat. 2524; RRID: AB_331743 |
| Rabbit Anti-PDGFRa | Cell Signaling Technology | Cat. 3174; RRID: AB_2162345 |
| Mouse Anti-GAPDH | GenTex | Cat. GTX627408; RRID: AB_11174761 |
| Chicken Anti-GFP | Abcam | Cat. ab13970; RRID: AB_300798 |
| Rabbit Anti-H3.3-G34R | RevMab | Cat. 31-1120; RRID: AB_2716433 |
| Mouse Anti-Vimentin | DSHB | Cat. 40E-C; RRID: AB_528504 |
| Rabbit Anti-Zmynd11 | Abcam | Cat. ab227086 |
| Mouse Anti-HIRA | Millipore | Cat. 04-1488; RRID: AB_1977097 |
| Rabbit Anti-p21 | Cell Signaling Technology | Cat. 2947; RRID: AB_823586 |
| Mouse Anti-Nestin | R&D Systems | Cat. MAB1259; RRID: AB_2251304 |
| Mouse Anti-Sox2 | R&D Systems | Cat. MAB2018; RRID: AB_358009 |
| Mouse Anti-ATRX | Santa Cruz | Cat. sc-55584; RRID: AB_831012 |
| Rabbit Anti-H3.3 | Millipore | Cat. 09838; RRID: AB_10845793 |
| Rabbit Anti-H3K27me3 | Cell Signaling Technology | Cat. 9733; RRID: AB_2616029 |
| Rabbit Anti-H3K4me2 | Cell Signaling Technology | Cat. 9725; RRID: AB_10205451 |
| Rabbit Anti-H3K4me3 | Millipore | Cat. 07-473; RRID: AB_1977252 |
| Rabbit Anti-H3K9me3 | Cell Signaling Technology | Cat. 13969; RRID: AB_2798355 |
| Rabbit Anti-H3K27me2 | Cell Signaling Technology | Cat. 9728; AB_1281338 |
| Rabbit Anti-H3K36me2 | Abcam | Cat. ab176921 |
| Rabbit Anti-H3K36me3 | Abcam | Cat. 9050; RRID: AB_306966 |
| Rabbit Anti-H3K27ac | Cell Signaling Technology | Cat. 8173; RRID: AB_10949503 |
| Rabbit Anti-H3K9-K14-K18-K27ac | Abcam | Cat. ab47915; RRID: AB_873860 |
| Alexa Fluor 488 Goat anti-Mouse IgG | ThermoFisher | Cat. A32723; RRID: AB_2633275 |
| Alexa Fluor 647 Goat anti-Rabbit IgG | ThermoFisher | Cat. A-21245; RRID: AB_2535813 |
| Alexa Fluor 594 Goat anti-Rabbit IgG | ThermoFisher | Cat. A-11012; RRID: AB_141359 |
| Alexa Fluor 594 Goat anti-Mouse IgG2a | ThermoFisher | Cat. A-21135; RRID: AB_2535774 |
| Alexa Fluor 647 Goat anti-Mouse IgG1 | ThermoFisher | Cat. A-21240; RRID: AB_141658 |
| Alexa Fluor 488 Goat anti-Mouse IgM | ThermoFisher | Cat. A32723; RRID: AB_2633275 |
| Alexa Fluor 488 Goat anti-Chicken IgY | ThermoFisher | Cat. A-11039; RRID: AB_142924 |
| HRP Goat anti-Rabbit IgG | ThermoFisher | Cat. A16110; RRID: AB_2534782 |
| HRP Goat anti-Mouse IgG | ThermoFisher | Cat. A16072; RRID: AB_2534745 |
| Bacterial and virus strains | ||
| DH5α competent E. coli | ThermoFisher | Cat. 18265017 |
| Biological samples | ||
| GCGR-NS13 human fetal specimen | This paper | N/A |
| GCGR-NS15 human fetal specimen | This paper | N/A |
| GCGR-NS19 human fetal specimen | This paper | N/A |
| Chemicals, peptides, and recombinant proteins | ||
| Murine EGF | Peprotech | Cat. 315-09 |
| Human basic FGF | Peprotech | Cat. 100-18B |
| Human TGF-B | R&D systems | Cat. 240-B-002 |
| B27 supplement | ThermoFisher | Cat. 17504044 |
| N2 supplement | ThermoFisher | Cat. 17502048 |
| Laminin-1 | R&D systems | Cat. 3446-005-01 |
| D-luciferin | Cayman Chemical | Cat. 14681-1 |
| Benzonase nuclease | Sigma Aldrich | E1014 |
| Recombinant Cas9 nuclease | In house | N/A |
| SuperScript III Reverse Transcriptase | ThermoFisher | Cat. 18080093 |
| Accutase solution | Sigma-Aldrich | Cat. A6964-500ML |
| cOmplete protease inhibitor cocktail | Roche | Cat. 11836153001 |
| Critical commercial assays | ||
| Senescence Cells Histochemical Staining Kit | Sigma Aldrich | Cat. CS0030 |
| Click-iT EdU Cell Proliferation Kit for Imaging | ThermoFisher | Cat. C10340 |
| Pierce BCA Protein Assay Kit | ThermoFisher | Cat. 23227 |
| RNeasy Plus Mini Kit | QIAGEN | Cat. 74134 |
| MinElute PCR Purification Kit | QIAGEN | Cat. 28006 |
| KAPA mRNA HyperPrep Kit | Roche | Cat. 08098123702 |
| SeqCap Adaptor Kit A | Roche | Cat. 7141530001 |
| NEBNext Ultra II DNA Library Kit | NEB | Cat. E7645S |
| NEBNext Dual Index Primers Set 1 | NEB | Cat. E7600S |
| Human GAPDH Taqman gene expression assay | ThermoFisher | Cat. Hs02758991_g1 |
| Human FOXG1 Taqman gene expression assay | ThermoFisher | Cat. Hs01850784_s1 |
| Human CDKN1A Taqman gene expression assay | ThermoFisher | Cat. Hs00355782_m1 |
| Deposited data | ||
| V5-H3.3 IP-MS - Identifier PXD021270 | This paper | https://www.ebi.ac.uk/pride |
| RNA-seq | This paper | GSE163044 |
| ChIP-seq | This paper | GSE163185 |
| Patient tumor microarray expression data | Paugh et al., 2010; Schwartzentruber et al., 2012; Sturm et al., 2012 | GSE34824, GSE36245, GSE1957 |
| Experimental models: cell lines | ||
| GCGR-NS13-Neocortex NSC | This paper | N/A |
| GCGR-NS13-Striatum NSC | This paper | N/A |
| GCGR-NS13-Posterior Brainstem NSC | This paper | N/A |
| GCGR-NS15-Neocortex NSC | This paper | N/A |
| GCGR-NS15-Striatum NSC | This paper | N/A |
| GCGR-NS15-Diencephalon NSC | This paper | N/A |
| GCGR-NS15-Cerebellum NSC | This paper | N/A |
| GCGR-NS15-Anterior Brainstem NSC | This paper | N/A |
| GCGR-NS15-Posterior Brainstem NSC | This paper | N/A |
| GCGR-NS15-Spinal cord NSC | This paper | N/A |
| GCGR-NS19-Neocortex NSC | This paper | N/A |
| GCGR-NS19-Striatum NSC | This paper | N/A |
| GCGR-NS19-Diencephalon NSC | This paper | N/A |
| GCGR-NS19-Anterior Brainstem NSC | This paper | N/A |
| GCGR-NS19-Posterior Brainstem NSC | This paper | N/A |
| GCGR-NS19-Spinal cord NSC | This paper | N/A |
| pGBM002 (HSJD-GBM-002) | Hennika et al., 2017 | N/A |
| aGBM7 (G7) | Pollard et al., 2009 | N/A |
| aGBM313 (G313) | This paper | N/A |
| Experimental models: organisms/strains | ||
| Mouse: NOD SCID: NOD.Cg-PrkdcscidIl2rgtm1Wjl/SzJ | The Jackson Laboratory | RRID:IMSR_JAX:005557 |
| Oligonucleotides | ||
| H3F3A G34R crRNA GAGTGCGCCCTCTACTGGAA | This paper | N/A |
| Alt-R® CRISPR-Cas9 tracrRNA | Integrated DNA Technologies | Cat. 1072532 |
| Recombinant DNA | ||
| CAG-WTH3.3-V5-PGK-HygroR_PBdonor | This paper | N/A |
| CAG-K27MH3.3-V5-PGK-HygroR_PBdonor | This paper | N/A |
| CAG-G34RH3.3-V5-PGK-HygroR_PBdonor | This paper | N/A |
| CAG-Luciferase-2A-GFP-BSD_PBdonor | This paper | N/A |
| CAG-PDGFRA-BSD_PBdonor | This paper | N/A |
| TP53 sgRNA-1 | Bressan et al., 2017 | N/A |
| TP53 sgRNA-2 | Bressan et al., 2017 | N/A |
| TP53 EF1a-PuroR targeting vector | Bressan et al., 2017 | N/A |
| FOXG1 sgRNA-1 | Bulstrode et al., 2017 | N/A |
| FOXG1 sgRNA-2 | Bulstrode et al., 2017 | N/A |
| FOXG1 EF1a-PuroR targeting vector | Bulstrode et al., 2017 | N/A |
| Cas9D10A-2A-GFP | Addgene | Cat. 44720 |
| PiggyBAC transposase | Austin Smith, University of Cambridge | N/A |
| Software and algorithms | ||
| Incucyte® Base Software | Essen Bioscience | https://www.essenbioscience.com/en/products/incucyte/ |
| MaxQuant v1.6.3.3 | Cox and Mann, 2008 | https://www.maxquant.org |
| ImageJ | Schneider et al., 2012 | https://imagej.nih.gov/ij/ |
| GraphPad Prism | GraphPad | https://www.graphpad.com |
| Cutadapt (version 1.14) | Martin, 2011 | https://github.com/marcelm/cutadapt |
| kallisto (version 0.43.1) | Bray et al., 2016 | https://pachterlab.github.io/kallisto/ |
| bedtools (version 2.29.0) | Quinlan, 2014 | https://github.com/arq5x/bedtools2 |
| Bowtie2 (version 2.3.5) | Langmead and Salzberg, 2012 | http://bowtie-bio.sourceforge.net/bowtie2/index.shtml |
| Samtools (version 1.9) | Li et al., 2009 | http://www.htslib.org/ |
| Picard (version 2.18.26) | Broad Institute | https://broadinstitute.github.io/picard/ |
| MACS2 (version 2.1.2) | Zhang et al., 2008 | https://github.com/macs3-project/MACS |
| bedGraphToBigWig (version 4) | Kent et al., 2010 | https://www.encodeproject.org/software/bedgraphtobigwig/ |
| Deeptools (version 3.3.1) | Ramírez et al., 2014 | https://github.com/deeptools/deeptools |
| R Package: tximport (version 1.8.0) | Soneson et al., 2015 | https://bioconductor.org/packages/release/bioc/html/tximport.html |
| R Package: DESeq2 (version 1.27.32) | Love et al., 2014 | http://bioconductor.org/packages/release/bioc/html/DESeq2.html |
| R Package: clusterProfiler (version 3.15.4) | Yu et al., 2012 | https://bioconductor.org/packages/release/bioc/html/clusterProfiler.html |
| R Package: oligo (version 1.51.2) | Carvalho and Irizarry, 2010 | https://bioconductor.org/packages/release/bioc/html/oligo.html |
| R Package: limma (version 3.43.11) | Ritchie et al., 2015 | https://www.bioconductor.org/packages/release/bioc/html/limma.html |
| R Package: GSVA (version 1.35.7) | Hänzelmann et al., 2013 | http://bioconductor.org/packages/release/bioc/html/GSVA.html |
| R Package: ConsensusClusterPlus (version 1.52.0) | Wilkerson and Hayes, 2010 | https://bioconductor.org/packages/release/bioc/html/ConsensusClusterPlus.html |
| R Package: TxDb.Hsapiens.UCSC.hg38.knownGene (version 3.4.0) | Bioconductor package | https://bioconductor.org/packages/release/data/annotation/html/TxDb.Hsapiens.UCSC.hg38.knownGene.html |
| R Package: ChIPpeakAnno (version 3.22.0) | Zhu et al., 2010 | https://www.bioconductor.org/packages/release/bioc/html/ChIPpeakAnno.html |
| IGV (version 2.8.2) | Thorvaldsdóttir et al., 2013 | http://software.broadinstitute.org/software/igv/ |
| R v4.0.0 | The R Project for Statistical Computing | https://www.r-project.org/ |
| Other | ||
| Anti-V5 tag magnetic beads | MBL | Cat. M167-11 |
| FluorSave Reagent | Calbiochem | Cat. 345789 |
| TaqMan Universal PCR Master Mix | ThermoFisher | Cat. 4305719 |
| Dynabeads Protein G | ThermoFisher | Cat. 10004D |
Resource availability
Lead contact
Further information and requests for resources and reagents should be directed to and will be fulfilled by the Lead Contact, Steven Pollard (steven.pollard@ed.ac.uk).
Materials availability
Stable reagents generated in this study are available from the Lead Contact. Unedited human fetal human NSC lines must be requested from the Glioma Cellular Genetics Resource (gcgr.org.uk) and a Materials Transfer Agreement completed.
Data and code availability
The accession numbers for the RNA-seq and ChIP-seq datasets reported in this paper are Gene Expression Omnibus (GEO): GSE163044 and GSE163185. Proteomics data is available at ProteomeXchange with identifier PXD021270.
Method details
Plasmids
H3.3 expression vectors were generated through engineering a Gateway destination vector containing a CAG promoter-driven transcriptional unit and a PGK-Hygromycin selection cassette flanked by PiggyBac transposon-specific inverted repeats. The sequences encoding C-terminal V5-tagged WT, K27M- and G34R-mutant H3.3 were generated by commercial DNA synthesis (Life Technologies). These were flanked by AttL recombination sites and directly inserted into the destination vector via Gateway LR cloning. PDGFRA coding sequence was PCR-amplified from human cDNA and cloned into a similar Gateway-compatible vector containing a CAG-Blasticidin resistance cassette and PiggyBac transposon flanking sequences. The PiggyBac Luciferase-2A-GFP expression vector was generated through LR Gateway cloning of an existing entry clone (Bressan et al., 2017). Human TP53 and FOXG1 CRISPR sgRNAs and targeting vectors were previously described (Bressan et al., 2017; Bulstrode et al., 2017). Cas9-encoding plasmid was obtained from Addgene. PBase transposase plasmid was a gift from Austin Smith (University of Cambridge).
Human tissue collection and derivation of NSC cultures
Fresh human fetal CNS tissue was obtained following elective termination of pregnancy at 13.5, 15.0 and 19.3 weeks of gestational age (WGA) (specimens GCGR-NS13, GCGR-NS15 and GCGR-NS19, respectively) with no evidence of developmental abnormalities. Informed consent was obtained in writing, and all procedures received ethical approval (South East Scotland Research Ethics Committee, REC reference 08/S1101/1). The regions of interest (Figure 1A) were dissected under a stereoscope with a pair of fine forceps in ice-cold PBS. In the case of the brainstem, an incision was made at the midbrain-hindbrain boundary and medullary hindbrain-spinal cord boundary. Following dissection of the cerebellum, an incision was made at the level of the rhombic lip, thereby dividing the segment into anterior and posterior brainstem. In the case of the spinal cord, the proximal segment (approx. 3-5 mm adjacent to the medulla) was collected. Following dissection, each tissue segment was split in two, with the first half (tissue reference) being directly lysed in QIAGEN RLT plus buffer for subsequent RNA collection. The second half was mechanically dissociated with a pair of forceps followed by gentle pipetting. The resultant cell suspensions were centrifuged (400 g for 3min), resuspended in NSC culture medium (see below) and plated onto T25 tissue culture flasks. Within 24h, morphologically diverse cells attached to the culture plastic. To reduce the amount of debris and cell death, culture media was refreshed at 24h and then every seven days. Within 1-2 weeks, clusters of adherent cells morphologically resembling radial glia-like NSCs emerged. After passaging, these rapidly adopted a more uniform morphology and stable proliferation rates. Cell death was minimal and most cultures could be maintained for > 10 passages without signs of proliferative arrest or spontaneous differentiation. Expandable neocortex, striatum and brainstem-derived cultures were consistently established from all three specimens, while cultures from other regions did not expand long-term in some cases. RNA was collected from two independent passages of each established line for mRNA profiling (Figure 1). The H3.3-G34R mutant pGBM002 cell line was derived from a biopsy of a hemispheric tumor in a 15-year-old patient and kindly provided by Angel M. Carcaboso (Institut de Recerca Sant Joan de Deu, Spain)
Cell line engineering
Human fetal NSCs were engineered at 5-7 passages after establishment. Transfections were performed using the Amaxa 4D nucleofector system as previously described (Bressan et al., 2017). For H3.3 expression, 200ng of PiggyBac donor plasmid (WT, K27M- or G34R-H3.3) was co-transfected with 400ng of PBase transposase plasmid. For combined PDGFRA expression and TP53 knockout, the PiggyBAC PDGFRA donor vector (200ng), TP53 sgRNAs (200ng each), TP53 targeting vector (200ng) and Cas9 encoding plasmid (400ng) were added to the reaction. Following recovery, cells were selected for stable integration of PiggyBac donor vectors and TP53 targeting vector using sequential treatment with 50 μg/ml hygromycin (H3.3), 5 μg/ml blasticidin (PDGFRA) and 100 ng/ml puromycin (TP53 knockout). The resulting resistant cell population was expanded for 3-4 passages before functional and transcriptional profiling. For knockout of the H3.3-G34R allele, a customised allele-specific crRNA was hybridized with a universal tracrRNA (both from Integrated DNA Technologies) and complexed with recombinant Cas9 protein as previously described (Dewari et al., 2018). The ribonucleoprotein complex was delivered into pGBM002 cells using the Amaxa-4D nucleofector system (Lonza, SG solution, program EN137). Following recovery, cells were plated at low density (approx. 10 cells/cm2) and individual colonies manually picked after three weeks. Clones were expanded and the H3F3A locus amplified by PCR and sequenced by Sanger sequencing. FOXG1 knockout was performed through CRISPR/Cas9-mediated gene targeting using previously validated sgRNA and targeting vectors (Bulstrode et al., 2017). Drug resistant colonies were manually picked and screened by PCR-based genotyping and Sanger sequencing as previously described (Bressan et al., 2017). For xenotransplantation experiments, engineered lines were co-transfected with the Luciferase-2A-GFP donor (200ng) and PBase transposase (400ng), and GFP-positive cells enriched by FACS.
Cell line maintenance
Established lines and engineered derivatives were propagated under identical culture conditions in serum-free basal medium supplemented with N2 and B27, Laminin-1 (1 μg/ml) and growth factors EGF and basic FGF (10 ng/ml each) as previously described (Bressan et al., 2017). Medium was exchanged twice per week. Upon confluence, cells were dissociated with Accutase solution and split typically 1:3 to 1:5.
Immunocytochemistry
Cells were fixed in 4% paraformaldehyde (PFA), permeabilized in 0.1% Triton X-100 and blocked in 0.1% bovine serum albumin plus 3% goat serum PBS solution. Samples were incubated overnight at 4°C with primary antibodies, washed in 0.3% Triton X-100 and reincubated with appropriate fluorophore-conjugated secondary antibodies (1:1000) and 4′,6-diamidino-2-phenylindole (DAPI) at room temperature for one hour. Immunopositive cells were quantified from a total ∼5000 cells in a minimum of ten random fields. Total cell number was determined by DAPI nuclear staining. The following primary antibodies were used: active Caspase3 (1:500), Foxg1 (1:10), H3K27me3 (1:1000), H3.3 (1:200), H3.3-G34R (1:1000), Nestin (1:500), Sox2 (1:50), V5-tag (1:1000) and Vimentin (1:50).
Western immunoblotting
Whole cell protein lysates were prepared in RIPA buffer (25 mM Tris-HCl. pH7.6, 150 mM NaCl, 1% NP-40, 1% Sodium Deoxycholate, 0.1% SDS) containing 1x protease inhibitor cocktail. Briefly, the cell pellets were resuspended in 100ul of RIPA buffer, incubated 5 minutes on ice and centrifuged at 4°C (10 minutes 15,000 g) to remove cell debris. Histone extracts were prepared as previously described (Shechter et al., 2007). Following protein quantification with the BCA method, extracts were separated on 4%–12% Bis-Tris gels and transferred to nitrocellulose membranes using the Mini Trans-Blot Cell system (Biorad). Membranes were incubated overnight with primary antibodies diluted in 5% milk TBS-Tween solution followed by incubation with horseradish peroxidase-conjugated secondary antibodies (1:5000). The following primary antibodies were used: Foxg1 (1:50), GAPDH (1:1000), p53 (1:500), V5 tag (1:1000), total H3 (1:2000), H3.3 (1:1000), PDGFRA (1:1000), p21 (1:1000), ATRX (1:100), Zmynd11 (1:500), HIRA (1:1000), H3K9-K14-K18-K27ac (1:1000), H3K27ac (1:1000), H3K4me2 (1:1000), H3K4me3 (1:1000), H3K9me3 (1:1000), H3K27me2 (1:1000), H3K27me3 (1:1000), H3K36me2 (1:5000) and H3K36me3 (1:1000).
EdU-incorporation assay
Cells were plated at 5,000 cells/cm2 in 48-well plates for 72h, followed by incubation with 10 μM EdU for, unless otherwise stated, 24h. EdU staining was carried out using the Click-iT EdU assay kit according to manufacturer’s instructions. EdU-positive cells were quantified from a total ∼5000 cells in a minimum of ten random fields. Total cell number was determined by DAPI nuclear staining.
Colony formation and confluence analyses
For colony formation assays, cells were plated at 15 cells/cm2 in 6-well plates, and colony counting performed manually 21 days after plating. For confluence analysis, cells were plated at 5,000 cells/cm2 in 24-well plates and imaged on the Incucyte Zoom live cell imaging system (Essen Bioscience) until confluence was reached. Growth curves were generated with the built-in Incucyte Zoom software.
SA-βGal staining
Cells were plated at 5,000 cells/cm2 in 48-well plates for 96h, followed by fixation with solution containing 2% formaldehyde and 0.2% glutaraldehyde for 5 min. Staining was performed overnight with the Senescence Cells Histochemical Staining kit according to manufacturer’s instructions. Plates were imaged using phase contrast microscopy and positive cells manually quantified from a total ∼2000 cells in a minimum of ten random fields.
Xenotransplantation
Xenotransplantation experiments were performed as previously described (Pollard et al., 2009). Briefly, cells were detached with Accutase, spun down and diluted at 100,000 cells per microliter in sterile PBS. Two microliters of the cell solution were injected stereotactically into the striatum of 6- to 8-week-old NSG mice under general anesthesia. For luciferase imaging experiments, D-luciferin (50mg/kg dose) was injected intraperitoneally and animals imaged 20 minutes after with the PerkinElmer IVIS Lumina LT Series III (PerkinElmer) instrument. Animals were observed regularly until they became moribund or showed severe neurological symptoms, at which point they were sacrificed and the presence of intracranial tumors confirmed under a fluorescent stereoscope. All procedures were carried out in a designated facility under licenses issued and approved by the UK Government Home Office
Histological analysis
Brain tissue was collected and fixed in 4% PFA solution overnight. Coronal sections (50 μm) were processed with the Vibratome instrument (VT1000S, Leica) and blocked in PBS containing 0.2% Triton X-100 and 10% goat serum for 1h at room temperature. Sections were incubated overnight at 4°C with an anti-GFP antibody (1:500) followed by incubation with fluorophore-conjugated secondary antibody (1:1,000; Invitrogen) and DAPI for 1h at room temperature. Slides were mounted using FluorSave reagent and examined with a confocal microscope (TCS SP8, Leica).
RT-qPCR
Total RNA was extracted using the RNeasy Plus Mini Kit following manufacturer’s instructions and cDNA generated with random hexamers and SuperScript III Reverse Transcriptase. Quantitative PCR was performed using universal TaqMan PCR master mix and commercial Taqman gene expression assays.
RNA-sequencing
Total RNA was extracted using the RNeasy Plus Mini Kit following manufacturer’s instructions. RNA quality was confirmed using the Bioanalyzer RNA 600 Nano kit (Agilent). Libraries were generated with 200ng of RNA input using the KAPA mRNA HyperPrep kit and KAPA SeqCap adapters. Fragmentation was carried out at 94°C for 6 minutes and libraries amplified for 12 cycles. Pooling ratios for multiplex library sequencing was calculated according to individual library concentrations and size distributions assessed with the Qubit dsDNA high-sensitivity and Agilent Bioanalyzer DNA 1000 assays, respectively. Pooled libraries were diluted and processed for sequencing using the Illumina HiSeq 2500 platform.
Chromatin immunoprecipitation followed by next-generation sequencing (ChIP-seq)
Cells were fixed in culture media containing 1% formaldehyde at room temperature for 10 minutes. The crosslinking reaction was quenched by addition of glycine to a final concentration of 0.125M to the fixation solution for 5 minutes at room temperature. Fixed cells were detached through mechanical scrapping, pelleted by centrifugation and washed twice with ice-cold PBS. The cell pellet was resuspended in LB1 buffer (50 mm HEPES, 140mm NaCl, 1 mm EDTA, 10% glycerol, 0.5% NP40 and 0.25% Triton X-100) followed by incubation at 4C for 10 minutes. A nuclear fraction was subsequently obtained through centrifugation and resuspended in LB2 buffer (10 mM Tris ph8.0, 200 mM NaCl, 1 mM EDTA, 0.5 mM EGTA). Following centrifugation, the pelleted nuclei were lysed in ChIP sonication buffer (50mM HEPES, 140mM NaCl, 1mM EDTA, 1mM EGTA, 1% Triton X-100, 0.1% Sodium Deoxycholate, 0.3% SDS) and sonicated in a Covaris M220 equipment to yield 200–500 bp DNA fragments. Protease inhibitor cocktail was added to all LB buffers. ChIP-grade antibodies (10ug per reaction) were coupled to Dynabeads Protein G (50ul per reaction) for 6h at 4°C, and added to sonicated chromatin for 16h under gentle rotation at 4°C. Beads were precipitated using a magnetic rack and washed five times with wash buffer (50mM HEPES, 500mM NaCl, 1mM EDTA, 1% NP40 and 0.7% sodium deoxycholate). Immunoprecipitated DNA was eluted in 50mM Tris-HCl pH8.0, 10mM EDTA, 1% SDS for 60 minutes at 65°C. Following an overnight incubation at 65°C for crosslinking reversal, samples were treated with RnaseA (0.2 mg/ml) and proteinase K (0.2 mg/ml), and DNA fragments subsequently purified with MinElute PCR purification kit. Purified DNA was quantified using a Qubit fluorimeter, and 20 ng was used to generate ChIP-seq libraries using NEBNext Ultra II DNA Library Kit and NEBNextdual index primer sets for Illumina. Library DNA was quantified using the Qubit, and size distributions were ascertained on a Tapestation (Agilent) using the D1000 ScreenTape assay. Libraries were pooled at equimolar ratio multiplex library sequencing using the concentration and size distribution values of the individual libraries. The library pool was diluted and processed for sequencing on the Illumina NovaSeq S2 50PE platform in accordance with the manufacturer’s instructions.
V5-H3.3 immunoprecipitation
Cells were detached with accutase solution, washed in PBS and frozen at −80C. Typically two confluent 15cm dishes were used per line or replica. Cell pellets were thawed and resuspended in 1ml of lysis buffer containing 50 mM Tris-HCl pH 8.0, 150 mM NaCl, 0.5% NP-40, 5% glycerol, 1 mM DTT, 2 mM MgCl2 1mM NaF, 2 mM ortovanadate and protease inhibitor cocktail. Following resuspension, benzonase nuclease (150 units/ml) was added and samples incubated for 30 min at 4C in a rotating shaker. Lysates were centrifuged at 20,000 g for 10 min at 4C and supernatants collected for protein quantification using the BCA method. Anti-V5 tag magnetic beads were added to the lysates (50ul of beads to 1mg of protein), and samples incubated in a rotator for 4 hours at 4C. Beads were subsequently precipitated using a magnetic rack, and washed three times with the lysis buffer without NP-40. For western blotting-based experiments, beads were subsequently resuspended in 50ul of LDS buffer, incubated at 95C for 10min, and separated on 4%–12% Bis-Tris gels as described above. Input controls consisted of 5ul of the lysates prior addition of anti-V5-tag beads. Alternatively, washed beads were flash frozen in liquid nitrogen and stored at −80C until further processing for mass-spectrometry as below.
Mass-spectrometry
After washing, beads were incubated for 30 minutes at 27C in 2M urea, 75 mM Tris pH8.5, 1mM DTT, and 0.3 ug trypsin in a total volume of 100uL. The supernatant was incubated 37C overnight and alkylated by addition of 8uL 0.5M iodoacetimate with 20 minutes incubation in the dark. Samples were acidified by addition of 8uL 10% TFA and spun at 20000 g. Peptides were loaded onto activated (15 uL methanol) equilibrated (50 uL 0.1% TFA) stage tips, and washed with 50 uL 0.1% TFA. Elution in 80% acetonitrile 0.1% TFA was followed by solvent removal in a vacuum concentrator, and volume then adjusted to 15 uL with 0.1% TFA. Peptides were loaded onto a C18 packed emitter and separated on a 40 minute gradient from 3.6% to 79% acetonitrile with 0.5% acetic acid throughout. Data dependent acquisition was performed on a Q Exactive Plus with precursor scan 300-1650 70k resolution and fragmentation NCE 28. Data was processed with MaxQuant v1.6.3.3 and Uniprot human proteome release 2018_09. Further technical details and raw data are available at ProteomeXchange with identifier PXD021270.
Bioinformatics methods
RNA-seq pre-processing and analysis
RNA sequencing reads were trimmed with Cutadapt (version 1.14) with default parameters and aligned to hg38 genome using the pseudo aligner Kallisto (version 0.43.1) (Martin, 2011; Bray et al., 2016). Read counts were summarized via the package Tximport (version 1.8.0) (Soneson et al., 2015) and subsequent normalization was completed via DESeq2 (version 1.27.32) (Love et al., 2014). Reported normalized read counts, unless otherwise stated, are as regularised-logarithm transformation (rlog) and are used for all downstream principle component analysis (PCA), clustering and visualization (Love et al., 2014). Differential expression was completed with DESeq2 with log2 fold change (LFC) shrinkage (Love et al., 2014). GO enrichment analysis was completed with the R package clusterprofiler (version 3.15.4), using the Gene ontology (GO) database for Biological process (BP), where genes with non-zero read count were used as background (Harris et al., 2004; Yu et al., 2012).
Derivation of forebrain hindbrain specific signatures
Genes specific to forebrain or hindbrain tissue samples were identified via the Distal binarization approach as previously described (Corces et al., 2018). In brief, intra-group mean and standard deviations (SD) were calculated for each gene. Each gene group was then ranked by mean expression across replicates. For any gene where the mean expression of a group is higher than 3 standard deviations than the group preceding it in rank, this gene is labeled specific to this sample group. All samples ranked higher than this group based on gene expression were also labeled as gene specific. Genes specific to forebrain or hindbrain samples were defined as genes specific to only these samples and no other groups. Three SD was chosen as a stringent threshold to accommodate low sample sizes. Pre-filtering of genes was completed using DESeq2 Likelihood Ratio test to filter out genes that were not significantly different across groups (FDR < 0.05). Genes were further filtered such that only specific genes that were also differentially expressed (FDR < 0.05, LFC > 2), between forebrain and hindbrain, were retained. This process was repeated in cell line samples and a concise forebrain and hindbrain set was derived from the intersection of these two procedures.
Derivation of regional signatures in cell line samples
Regional signatures within forebrain (neocortex, striatum, diencephalon) and hindbrain (anterior/posterior brainstem, and spinal cord) NSC cultures were derived by completing differential expression between each individual group against all others using DESeq2 (FDR < 0.05). Genes with low read count (< 1 read) across all samples were pre-filtered. Each set was permitted to overlap, and only the top 50 genes in each comparison, ranked by LFC, were chosen. Distal binarization was not utilized as samples were not distinct enough between each subgroup. Cerebellum and Midbrain signatures were not derived due to low or absent sample numbers (n = 1, n = 0 respectively). Anterior brainstem and posterior brainstem samples were merged due to high similarity.
Affymetrix microarray pre-processing and analysis
Affymetrix Human Genome U133 Plus 2.0 Array CEL files were downloaded for 3 separate studies from the Gene Expression Omnibus (https://www.ncbi.nlm.nih.gov/geo/) (GEO accessions: GSE34824, GSE36245, GSE19578) and re-processed using the oligo package (version 1.51.2), and rma normalization in R (Carvalho and Irizarry, 2010). Pre-filtering of probes was completed by keeping probes with the highest variance across samples per gene annotation. Differential expression was completed using limma (version 3.43.11). Using knowledge of H3.3 mutations, batch correction was completed using the removeBatchEffect function in limma prior to data visualization, clustering and PCA (Ritchie et al., 2015).
Derivation of pHGG G34 and K27 mutant signatures
G34 and K27 signatures were derived by completing differential expression between each H3.3 mutant group against all others (FDR < 0.1, top 50 genes). A higher FDR threshold was chosen to ensure a comparable gene set size to prior gene sets. As above differential expression was completed on rma normalized intensities using the package limma (Ritchie et al., 2015).
Characterizing samples with derived signatures
Principal component analysis (PCA) was completed on pHGG samples using batch corrected rma normalized intensities, and NSC lines using normalized reads (rlog). Reciprocal gene sets were used in each PCA analysis whereby specific forebrain/hindbrain gene sets were used for pHGG samples, and G34/K27 gene sets were used in NSC samples. Reciprocal ssGSEA was completed on each sample set using forebrain/hindbrain, G34/K27, and additional regional signatures (neocortex, striatum, diencephalon, anterior/posterior brainstem and spinal cord) (Barbie et al., 2009). For microarray and RNA-seq data ssGSEA was completed using the R package gsva (version 1.35.7), with the ssgsea method (Hänzelmann et al., 2013), on batch corrected rma intensities, and rlog normalized reads respectively. K-means consensus clustering was completed using the same samples and signatures described above with the R package ConsensusClusterPlus (version 1.52.0) (Monti et al., 2003; Wilkerson and Hayes, 2010). Consensus clustering was run with 10000 re-samples, a proportion of item and feature sampling of 0.7, with maximum k clusters of 10 and 6 for NSC and pHGG samples respectively. Optimal k-clusters were chosen using the CDF (cumulative density function) of the consensus index across varying k clusters, and by inspecting the consensus matrix for each value of k. Consensus heatmaps were clustered by hierarchical clustering using Euclidean distance with average linkage criteria.
Pediatric cBioPortal gene expression data
Normalized expression (z-score) values of selected genes of interest were retrieved from the pediatric cBioPortal (https://pedcbioportal.kidsfirstdrc.org:443/saml/discovery?entityID=d3b-center.auth0.com&returnIDParam=idp) using the Paediatric High Grade Glioma “ICR London, Cancer Cell, 2017” study. Annotation of tumor location and H3.3 mutation status was retrieved together with gene expression values. Statistical analyses were performed using GraphPad Prism software.
ChIP-seq pre-processing and analysis
ChIP-seq reads were quality and adaptor trimmed with Cutadapt, before being aligned to the human hg38 genome with bowtie2 (version 2.3.5) using default parameters (Martin, 2011; Langmead and Salzberg, 2012). Resulting BAM files were sorted and indexed with samtools and reads were filtered from ENCODE blacklist regions with samtools view (version 1.9) and bedtools intersect (version 2.29.0) (Li et al., 2009; Quinlan, 2014). PCR duplicates were filtered with picard tools MarkDuplicates (version 2.18.26) (Broad Institute, 2020). Peaks were called on filtered input and control BAM files with MAC2 set to broadPeak (H3.3, H3K36me3, H3K27me3), and narrowPeak (H3K4me3) (Zhang et al., 2008). Narrow peaks were called using MACS2 (version 2.1.2) with the following command line parameters: macs2 callpeak -t Input.bam -c Control.bam -f BAMPE -g 2701495761 -s 50–keep-dup all -B–SPMR–nomodel–shift 0–extsize 146 -q 0.05. Broad peaks were called with the additional parameters–broad–broad-cutoff 0.1 instead of -q 0.05. RPM normalized bedgraph files were generated via MACS2 following peak calling. Subtracted coverage files were generated using MACS2 bdgcmp between input and control BAMs. BigWig coverage files were generated using bedGraphToBigWig (version 4) from MACS2 resulting bedgraphs (Kent et al., 2010). Where merged samples are reported, samtools merge was used on filtered BAMs across sample replicates before undergoing the same peak calling, bedgraph, and bigWig generation process.
Heatmap and metagene plots were generated with deeptools (version 3.3.1) plotHeatmap and plotProfile respectively using subtracted bigWig files where negative values were set to 0 (Ramírez et al., 2014). Where deeptools metagene plots were completed across gene features these were based on the UCSC hg38 knownGene transcript model as defined by the TxDb.Hsapiens.UCSC.hg38.knownGene R package (version 3.4.0) (See Sequence feature analysis) (Team BC, 2016). Downregulated and Upregulated gene sets were defined as those significantly differentially expressed (FDR < 0.01) between pGBM002 parental and G34R-KO pGBM002 samples changing in the positive or negative direction. Expressed genes were defined as those with a mean RPKM < 1 across pGBM002 samples.
Coverage of each histone mark over gene regions or genomic bins, for boxplots and scatterplots, were summarized using bedtools multicov on filtered and processed BAM files, and normalized to RPKM using gene or bin length. Histone mark log2 fold enrichment was calculated by taking the log2 fold change of RPKM for a given region between pGBM002 parental and G34R-KO pGBM002 samples. Quantiles of histone coverage and mRNA expression for each gene were calculated using RPKM normalized values.
Peak overlaps between samples, and annotation, were completed using the R package ChIPpeakAnno (version 3.22.0) (Zhu et al., 2010). Promoter specific peaks were defined as those overlapping the transcription start site of a given gene ± 2kb. Gene body peaks were defined as those peaks overlapping any portion of a gene region. Non overlapping shuffled G34R pGBM002 parental peaks were generated using bedtools shuffle (Quinlan, 2014).
Tracks of histone signal were created using IGV (version 2.8.2) with merged and subtracted bigWig files (Thorvaldsdóttir et al., 2013).
Sequence feature analyses
Characterization of sequence features across the genome were conducted using the UCSC hg38 knownGene transcript model as defined by the TxDb.Hsapiens.UCSC.hg38.knownGene R package. Each gene region was defined by merging all overlapping transcripts for a given gene. For each gene, a single set of exons and introns were likewise defined by merging overlapping exons and introns separately. Transcripts with multiple discreet sites were filtered.
Using this curated annotation GC% for each gene, exon, and intronic region was calculated using bedtools nuc (Quinlan, 2014). CpG island overlap was calculated as the percentage overlap of the CpG islands track from the UCSC genome browser with a given region. Observed-to-expected (o/e) CpG ratio was calculated for each gene, exon, or intronic region as previously defined (Gardiner-Garden and Frommer, 1987). Exon density was calculated by counting exons per transcript, where overlapping exons were merged, and normalizing for length. Gene wise exon and intron length were calculated as the sum of the merged exons or introns per gene region.
Downregulated gene sets were defined as those significantly downregulated (FDR < 0.01) between pGBM002 parental and G34R-KO pGBM002 samples and those downregulated genes that overlapped with the “Forebrain Development” GO term. An empirical p value for each sequence feature comparison between gene subsets and all genes was calculated using a resampling based approach. Where a null distribution was generated by randomly sub-sampling the genome (10,000 iterations), without replacement, for a set of genes the same size as the gene set of interest.
Acknowledgments
We thank Adrian P. Bracken, Katrin Ottersbach, Kim B. Jensen, and members of the Pollard lab for helpful discussions and critical reading of the manuscript. Abdenour Soufi provided technical advice on ChIP-seq protocols, and Angel Montero Carcaboso generously provided the patient-derived cell line pGBM002 (HSJD-GBM-002). We are grateful to the University College London Cancer Institute Genomics core facility for performing the next-generation mRNA sequencing and to the Wellcome Trust for providing the mass spectrometry large equipment (Multiuser Equipment Grant 208402/Z/17/Z). Primary fetal NSCs were provided by the Glioma Cellular Genetics Resource (www.gcgr.org.uk). The project was supported by a grant from the Children with Cancer UK Charity (15/189). R.B.B. was supported by a PhD fellowship from the Science Without Borders Program (CAPES, Governo Dilma Rousseff, Brazil) and a postdoctoral fellowship from the European Molecular Biology Organization (EMBO). G.M.M. was supported by the Cancer Research UK Centre Accelerator Award (A21922). S.M.P is a Cancer Research UK Senior Research Fellow (A17368).
Author contributions
R.B.B. and S.M.P. conceived the project and designed the experiments. R.B.B. performed the majority of the bench-based experimentation and data analyses. B.S., J.A., and S.T. performed the bioinformatic analyses. N.A., L.B., and M.A.M.-T. performed xenotransplantations and histological analyses. C.B. performed immunoprecipitations and western blotting procedures. J.C.W. and A.K. performed MS analysis. K.M.F and F.R. performed FOXG1 loss-of-function experiments. V.G., C.A.C.W., K.M.F., and G.M.M. provided technical assistance with derivation and characterization of cell lines, and R.A.A. provided human fetal tissues. R.B.B. and S.M.P. co-wrote the manuscript.
Declaration of interests
S.M.P. is a founder and shareholder of Cellinta Ltd., a biotechnology startup that is developing cancer therapeutics, including glioblastoma. S.M.P. is also an inventor on a University of Edinburgh patent related to NSC culture methods (WO2005121318A3). The other authors declare no competing interests.
Published: February 24, 2021
Footnotes
Supplemental information can be found online at https://doi.org/10.1016/j.stem.2021.01.016.
Supplemental information
References
- Abbas T., Dutta A. p21 in cancer: intricate networks and multiple activities. Nat. Rev. Cancer. 2009;9:400–414. doi: 10.1038/nrc2657. [DOI] [PMC free article] [PubMed] [Google Scholar]
- Ahmad K., Henikoff S. The histone variant H3.3 marks active chromatin by replication-independent nucleosome assembly. Mol. Cell. 2002;9:1191–1200. doi: 10.1016/s1097-2765(02)00542-7. [DOI] [PubMed] [Google Scholar]
- Barbie D.A., Tamayo P., Boehm J.S., Kim S.Y., Moody S.E., Dunn I.F., Schinzel A.C., Sandy P., Meylan E., Scholl C. Systematic RNA interference reveals that oncogenic KRAS-driven cancers require TBK1. Nature. 2009;462:108–112. doi: 10.1038/nature08460. [DOI] [PMC free article] [PubMed] [Google Scholar]
- Bertacchi M., Romano A.L., Loubat A., Tran Mau-Them F., Willems M., Faivre L., Khau van Kien P., Perrin L., Devillard F., Sorlin A. NR2F1 regulates regional progenitor dynamics in the mouse neocortex and cortical gyrification in BBSOAS patients. EMBO J. 2020;39:e104163. doi: 10.15252/embj.2019104163. [DOI] [PMC free article] [PubMed] [Google Scholar]
- Bjerke L., Mackay A., Nandhabalan M., Burford A., Jury A., Popov S., Bax D.A., Carvalho D., Taylor K.R., Vinci M. Histone H3.3. mutations drive pediatric glioblastoma through upregulation of MYCN. Cancer Discov. 2013;3:512–519. doi: 10.1158/2159-8290.CD-12-0426. [DOI] [PMC free article] [PubMed] [Google Scholar]
- Bray N.L., Pimentel H., Melsted P., Pachter L. Near-optimal probabilistic RNA-seq quantification. Nat. Biotechnol. 2016;34:525–527. doi: 10.1038/nbt.3519. [DOI] [PubMed] [Google Scholar]
- Bressan R.B., Dewari P.S., Kalantzaki M., Gangoso E., Matjusaitis M., Garcia-Diaz C., Blin C., Grant V., Bulstrode H., Gogolok S. Efficient CRISPR/Cas9-assisted gene targeting enables rapid and precise genetic manipulation of mammalian neural stem cells. Development. 2017;144:635–648. doi: 10.1242/dev.140855. [DOI] [PMC free article] [PubMed] [Google Scholar]
- Bulstrode H., Johnstone E., Marqués-Torrejón M.Á., Ferguson K.M., Bressan R.B., Blin C., Grant V., Gogolok S., Gangoso E., Gagrica S. Elevated FOXG1 and SOX2 in glioblastoma enforces neural stem cell identity through transcriptional control of cell cycle and epigenetic regulators. Genes Dev. 2017;31:757–773. doi: 10.1101/gad.293027.116. [DOI] [PMC free article] [PubMed] [Google Scholar]
- Bushweller J.H. Targeting transcription factors in cancer—from undruggable to reality. Nat. Rev. Cancer. 2019;19:611–624. doi: 10.1038/s41568-019-0196-7. [DOI] [PMC free article] [PubMed] [Google Scholar]
- Carvalho B.S., Irizarry R.A. A framework for oligonucleotide microarray preprocessing. Bioinformatics. 2010;26:2363–2367. doi: 10.1093/bioinformatics/btq431. [DOI] [PMC free article] [PubMed] [Google Scholar]
- Castro D.S., Skowronska-Krawczyk D., Armant O., Donaldson I.J., Parras C., Hunt C., Critchley J.A., Nguyen L., Gossler A., Göttgens B. Proneural bHLH and Brn proteins coregulate a neurogenic program through cooperative binding to a conserved DNA motif. Dev. Cell. 2006;11:831–844. doi: 10.1016/j.devcel.2006.10.006. [DOI] [PubMed] [Google Scholar]
- Chan K.M., Fang D., Gan H., Hashizume R., Yu C., Schroeder M., Gupta N., Mueller S., James C.D., Jenkins R. The histone H3.3K27M mutation in pediatric glioma reprograms H3K27 methylation and gene expression. Genes Dev. 2013;27:985–990. doi: 10.1101/gad.217778.113. [DOI] [PMC free article] [PubMed] [Google Scholar]
- Conti L., Pollard S.M., Gorba T., Reitano E., Toselli M., Biella G., Sun Y., Sanzone S., Ying Q.L., Cattaneo E., Smith A. Niche-independent symmetrical self-renewal of a mammalian tissue stem cell. PLoS Biol. 2005;3:e283. doi: 10.1371/journal.pbio.0030283. [DOI] [PMC free article] [PubMed] [Google Scholar]
- Corces M.R., Granja J.M., Shams S., Louie B.H., Seoane J.A., Zhou W., Silva T.C., Groeneveld C., Wong C.K., Cho S.W. The chromatin accessibility landscape of primary human cancers. Science. 2018;362:eaav1898. doi: 10.1126/science.aav1898. [DOI] [PMC free article] [PubMed] [Google Scholar]
- Cox J., Mann M. MaxQuant enables high peptide identification rates, individualized p.p.b.-range mass accuracies and proteome-wide protein quantification. Nat Biotechnol. 2008;26:1367–1372. doi: 10.1038/nbt.1511. [DOI] [PubMed] [Google Scholar]
- Dewari P.S., Southgate B., Mccarten K., Monogarov G., O’Duibhir E., Quinn N., Tyrer A., Leitner M.C., Plumb C., Kalantzaki M. An efficient and scalable pipeline for epitope tagging in mammalian stem cells using Cas9 ribonucleoprotein. eLife. 2018;7:35069. doi: 10.7554/eLife.35069. [DOI] [PMC free article] [PubMed] [Google Scholar]
- Fang D., Gan H., Lee J.H., Han J., Wang Z., Riester S.M., Jin L., Chen J., Zhou H., Wang J. The histone H3.3K36M mutation reprograms the epigenome of chondroblastomas. Science. 2016;352:1344–1348. doi: 10.1126/science.aae0065. [DOI] [PMC free article] [PubMed] [Google Scholar]
- Filbin M., Monje M. Developmental origins and emerging therapeutic opportunities for childhood cancer. Nat. Med. 2019;25:367–376. doi: 10.1038/s41591-019-0383-9. [DOI] [PMC free article] [PubMed] [Google Scholar]
- Funato K., Major T., Lewis P.W., Allis C.D., Tabar V. Use of human embryonic stem cells to model pediatric gliomas with H3.3K27M histone mutation. Science. 2014;346:1529–1533. doi: 10.1126/science.1253799. [DOI] [PMC free article] [PubMed] [Google Scholar]
- Gardiner-Garden M., Frommer M. CpG islands in vertebrate genomes. J. Mol. Biol. 1987;196:261–282. doi: 10.1016/0022-2836(87)90689-9. [DOI] [PubMed] [Google Scholar]
- Gibson P., Tong Y., Robinson G., Thompson M.C., Currle D.S., Eden C., Kranenburg T.A., Hogg T., Poppleton H., Martin J. Subtypes of medulloblastoma have distinct developmental origins. Nature. 2010;468:1095–1099. doi: 10.1038/nature09587. [DOI] [PMC free article] [PubMed] [Google Scholar]
- Goldberg A., Banaszynski L., Noh K., Lewis P., Elsaesser S., Stadler S., Dewell S., Law M., Guo X., Li X. Distinct factors control histone variant H3.3 localization at specific genomic regions. Cell. 2010;140:678–691. doi: 10.1016/j.cell.2010.01.003. [DOI] [PMC free article] [PubMed] [Google Scholar]
- Guo R., Zheng L., Park J.W., Lv R., Chen H., Jiao F., Xu W., Mu S., Wen H., Qiu J. BS69/ZMYND11 reads and connects histone H3.3 lysine 36 trimethylation-decorated chromatin to regulated pre-mRNA processing. Mol. Cell. 2014;56:298–310. doi: 10.1016/j.molcel.2014.08.022. [DOI] [PMC free article] [PubMed] [Google Scholar]
- Hänzelmann S., Castelo R., Guinney J. GSVA: gene set variation analysis for microarray and RNA-seq data. BMC Bioinformatics. 2013;14:7. doi: 10.1186/1471-2105-14-7. [DOI] [PMC free article] [PubMed] [Google Scholar]
- Harris M.A., Clark J., Ireland A., Lomax J., Ashburner M., Foulger R., Eilbeck K., Lewis S., Marshall B., Mungall C., Gene Ontology Consortium The Gene Ontology (GO) database and informatics resource. Nucleic Acids Res. 2004;32:D258–D261. doi: 10.1093/nar/gkh036. [DOI] [PMC free article] [PubMed] [Google Scholar]
- Hennika T., Hu G., Olaciregui N.G., Barton K.L., Ehteda A., Chitranjan A., Chang C., Gifford A.J., Tsoli M., Ziegler D.S. Pre-clinical study of panobinostat in xenograft and genetically engineered murine diffuse intrinsic pontine glioma models. PLoS ONE. 2017;12:e0169485. doi: 10.1371/journal.pone.0169485. [DOI] [PMC free article] [PubMed] [Google Scholar]
- Jessa S., Blanchet-Cohen A., Krug B., Vladoiu M., Coutelier M., Faury D., Poreau B., De Jay N., Hébert S., Monlong J. Stalled developmental programs at the root of pediatric brain tumors. Nat. Genet. 2019;51:1702–1713. doi: 10.1038/s41588-019-0531-7. [DOI] [PMC free article] [PubMed] [Google Scholar]
- Johnson R.A., Wright K.D., Poppleton H., Mohankumar K.M., Finkelstein D., Pounds S.B., Rand V., Leary S.E.S., White E., Eden C. Cross-species genomics matches driver mutations and cell compartments to model ependymoma. Nature. 2010;466:632–636. doi: 10.1038/nature09173. [DOI] [PMC free article] [PubMed] [Google Scholar]
- Jones C., Karajannis M.A., Jones D.T.W., Kieran M.W., Monje M., Baker S.J., Becher O.J., Cho Y.-J., Gupta N., Hawkins C. Pediatric high-grade glioma: biologically and clinically in need of new thinking. Neuro-oncol. 2017;19:153–161. doi: 10.1093/neuonc/now101. [DOI] [PMC free article] [PubMed] [Google Scholar]
- Kent W.J., Zweig A.S., Barber G., Hinrichs A.S., Karolchik D. BigWig and BigBed: enabling browsing of large distributed datasets. Bioinformatics. 2010;26:2204–2207. doi: 10.1093/bioinformatics/btq351. [DOI] [PMC free article] [PubMed] [Google Scholar]
- Khazaei S., De Jay N., Deshmukh S., Hendrikse L.D., Jawhar W., Chen C.C.L., Mikael L.G., Faury D., Marchione D.M., Lanoix J. H3.3G34W promotes growth and impedes differentiation of osteoblast-like mesenchymal progenitors in giant cell tumour of bone. Cancer Discov. 2020;10:1968–1987. doi: 10.1158/2159-8290.CD-20-0461. [DOI] [PMC free article] [PubMed] [Google Scholar]
- Kitamura K., Yanazawa M., Sugiyama N., Miura H., Iizuka-Kogo A., Kusaka M., Omichi K., Suzuki R., Kato-Fukui Y., Kamiirisa K. Mutation of ARX causes abnormal development of forebrain and testes in mice and X-linked lissencephaly with abnormal genitalia in humans. Nat. Genet. 2002;32:359–369. doi: 10.1038/ng1009. [DOI] [PubMed] [Google Scholar]
- Konno D., Iwashita M., Satoh Y., Momiyama A., Abe T., Kiyonari H., Matsuzaki F. The mammalian DM domain transcription factor Dmrta2 is required for early embryonic development of the cerebral cortex. PLoS ONE. 2012;7:e46577. doi: 10.1371/journal.pone.0046577. [DOI] [PMC free article] [PubMed] [Google Scholar]
- Langmead B., Salzberg S.L. Fast gapped-read alignment with Bowtie 2. Nat. Methods. 2012;9:357–359. doi: 10.1038/nmeth.1923. [DOI] [PMC free article] [PubMed] [Google Scholar]
- Larson J.D., Kasper L.H., Paugh B.S., Jin H., Wu G., Kwon C.H., Fan Y., Shaw T.I., Silveira A.B., Qu C. Histone H3.3 K27M accelerates spontaneous brainstem glioma and drives restricted changes in bivalent gene expression. Cancer Cell. 2019;35:140–155.e7. doi: 10.1016/j.ccell.2018.11.015. [DOI] [PMC free article] [PubMed] [Google Scholar]
- Lewis P.W., Müller M.M., Koletsky M.S., Cordero F., Lin S., Banaszynski L.A., Garcia B.A., Muir T.W., Becher O.J., Allis C.D. Inhibition of PRC2 activity by a gain-of-function H3 mutation found in pediatric glioblastoma. Science. 2013;340:857–861. doi: 10.1126/science.1232245. [DOI] [PMC free article] [PubMed] [Google Scholar]
- Li H., Handsaker B., Wysoker A., Fennell T., Ruan J., Homer N., Marth G., Abecasis G., Durbin R., 1000 Genome Project Data Processing Subgroup The Sequence Alignment/Map format and SAMtools. Bioinformatics. 2009;25:2078–2079. doi: 10.1093/bioinformatics/btp352. [DOI] [PMC free article] [PubMed] [Google Scholar]
- Love M.I., Huber W., Anders S. Moderated estimation of fold change and dispersion for RNA-seq data with DESeq2. Genome Biol. 2014;15:550. doi: 10.1186/s13059-014-0550-8. [DOI] [PMC free article] [PubMed] [Google Scholar]
- Lu C., Jain S.U., Hoelper D., Bechet D., Molden R.C., Ran L., Murphy D., Venneti S., Hameed M., Pawel B.R. Histone H3K36 mutations promote sarcomagenesis through altered histone methylation landscape. Science. 2016;352:844–849. doi: 10.1126/science.aac7272. [DOI] [PMC free article] [PubMed] [Google Scholar]
- Lujan E., Chanda S., Ahlenius H., Südhof T.C., Wernig M. Direct conversion of mouse fibroblasts to self-renewing, tripotent neural precursor cells. Proc. Natl. Acad. Sci. U S A. 2012;109:2527–2532. doi: 10.1073/pnas.1121003109. [DOI] [PMC free article] [PubMed] [Google Scholar]
- Mackay A., Burford A., Carvalho D., Izquierdo E., Fazal-Salom J., Taylor K.R., Bjerke L., Clarke M., Vinci M., Nandhabalan M. Integrated molecular meta-analysis of 1,000 pediatric high-grade and diffuse intrinsic pontine glioma. Cancer Cell. 2017;32:520–537.e5. doi: 10.1016/j.ccell.2017.08.017. [DOI] [PMC free article] [PubMed] [Google Scholar]
- Martin M. Cutadapt removes adapter sequences from high-throughput sequencing reads. EMBnet. J. 2011;17:10. [Google Scholar]
- Mi D., Carr C.B., Georgala P.A., Huang Y.-T., Manuel M.N., Jeanes E., Niisato E., Sansom S.N., Livesey F.J., Theil T. Pax6 exerts regional control of cortical progenitor proliferation via direct repression of Cdk6 and hypophosphorylation of pRb. Neuron. 2013;78:269–284. doi: 10.1016/j.neuron.2013.02.012. [DOI] [PMC free article] [PubMed] [Google Scholar]
- Mohammad F., Helin K. Oncohistones: drivers of pediatric cancers. Genes Dev. 2017;31:2313–2324. doi: 10.1101/gad.309013.117. [DOI] [PMC free article] [PubMed] [Google Scholar]
- Monteuuis G., Wong J.J.L., Bailey C.G., Schmitz U., Rasko J.E.J. The changing paradigm of intron retention: regulation, ramifications and recipes. Nucleic Acids Res. 2019;47:11497–11513. doi: 10.1093/nar/gkz1068. [DOI] [PMC free article] [PubMed] [Google Scholar]
- Monti S., Tamayo P., Mesirov J., Golub T. Consensus clustering: a resampling-based method for class discovery and visualization of gene expression microarray data. Mach. Learn. 2003;52:91–118. [Google Scholar]
- Ono K., Takebayashi H., Ikeda K., Furusho M., Nishizawa T., Watanabe K., Ikenake K. Regional- and temporal-dependent changes in the differentiation of Olig2 progenitors in the forebrain, and the impact on astrocyte development in the dorsal pallium. Dev. Biol. 2008;320:456–468. doi: 10.1016/j.ydbio.2008.06.001. [DOI] [PubMed] [Google Scholar]
- Pathania M., De Jay N., Maestro N., Harutyunyan A.S., Nitarska J., Pahlavan P., Henderson S., Mikael L.G., Richard-Londt A., Zhang Y. H3.3K27M cooperates with Trp53 loss and PDGFRA gain in mouse embryonic neural progenitor cells to induce invasive high-grade gliomas. Cancer Cell. 2017;32:684–700.e9. doi: 10.1016/j.ccell.2017.09.014. [DOI] [PMC free article] [PubMed] [Google Scholar]
- Paugh B.S., Qu C., Jones C., Liu Z., Adamowicz-Brice M., Zhang J., Bax D.A., Coyle B., Barrow J., Hargrave D. Integrated molecular genetic profiling of pediatric high-grade gliomas reveals key differences with the adult disease. J. Clin. Oncol. 2010;28:3061–3068. doi: 10.1200/JCO.2009.26.7252. [DOI] [PMC free article] [PubMed] [Google Scholar]
- Pevny L., Placzek M. SOX genes and neural progenitor identity. Curr. Opin. Neurobiol. 2005;15:7–13. doi: 10.1016/j.conb.2005.01.016. [DOI] [PubMed] [Google Scholar]
- Pollard S.M., Yoshikawa K., Clarke I.D., Danovi D., Stricker S., Russell R., Bayani J., Head R., Lee M., Bernstein M. Glioma stem cell lines expanded in adherent culture have tumor-specific phenotypes and are suitable for chemical and genetic screens. Cell Stem Cell. 2009;4:568–580. doi: 10.1016/j.stem.2009.03.014. [DOI] [PubMed] [Google Scholar]
- Quinlan A.R. BEDTools: the Swiss-Army tool for genome feature analysis. Curr. Protoc. Bioinformatics. 2014;47 doi: 10.1002/0471250953.bi1112s47. 11.12.1–11.12.34. [DOI] [PMC free article] [PubMed] [Google Scholar]
- Ramírez F., Dündar F., Diehl S., Grüning B.A., Manke T. deepTools: a flexible platform for exploring deep-sequencing data. Nucleic Acids Res. 2014;42(W1):W187–W191. doi: 10.1093/nar/gku365. [DOI] [PMC free article] [PubMed] [Google Scholar]
- Ritchie M.E., Phipson B., Wu D., Hu Y., Law C.W., Shi W., Smyth G.K. limma powers differential expression analyses for RNA-sequencing and microarray studies. Nucleic Acids Res. 2015;43:e47. doi: 10.1093/nar/gkv007. [DOI] [PMC free article] [PubMed] [Google Scholar]
- Salloum R., McConechy M.K., Mikael L.G., Fuller C., Drissi R., DeWire M., Nikbakht H., De Jay N., Yang X., Boue D. Characterizing temporal genomic heterogeneity in pediatric high-grade gliomas. Acta Neuropathol. Commun. 2017;5:78. doi: 10.1186/s40478-017-0479-8. [DOI] [PMC free article] [PubMed] [Google Scholar]
- Schneider C.A., Rasband W.S., Eliceiri K.W. NIH Image to ImageJ: 25 years of image analysis. Nat Methods. 2012;9:671–675. doi: 10.1038/nmeth.2089. [DOI] [PMC free article] [PubMed] [Google Scholar]
- Schwartzentruber J., Korshunov A., Liu X.Y., Jones D.T., Pfaff E., Jacob K., Sturm D., Fontebasso A.M., Quang D.A., Tönjes M. Driver mutations in histone H3.3 and chromatin remodelling genes in paediatric glioblastoma. Nature. 2012;482:226–231. doi: 10.1038/nature10833. [DOI] [PubMed] [Google Scholar]
- Seoane J., Le H.-V., Shen L., Anderson S.A., Massagué J. Integration of Smad and forkhead pathways in the control of neuroepithelial and glioblastoma cell proliferation. Cell. 2004;117:211–223. doi: 10.1016/s0092-8674(04)00298-3. [DOI] [PubMed] [Google Scholar]
- Shechter D., Dormann H.L., Allis C.D., Hake S.B. Extraction, purification and analysis of histones. Nat. Protoc. 2007;2:1445–1457. doi: 10.1038/nprot.2007.202. [DOI] [PubMed] [Google Scholar]
- Siegenthaler J.A., Tremper-Wells B.A., Miller M.W. Foxg1 haploinsufficiency reduces the population of cortical intermediate progenitor cells: effect of increased p21 expression. Cereb. Cortex. 2008;18:1865–1875. doi: 10.1093/cercor/bhm209. [DOI] [PMC free article] [PubMed] [Google Scholar]
- Soneson C., Love M.I., Robinson M.D. Differential analyses for RNA-seq: transcript-level estimates improve gene-level inferences. F1000Res. 2015;4:1521. doi: 10.12688/f1000research.7563.1. [DOI] [PMC free article] [PubMed] [Google Scholar]
- Steinfeld H., Cho M.T., Retterer K., Person R., Schaefer G.B., Danylchuk N., Malik S., Wechsler S.B., Wheeler P.G., van Gassen K.L.I. Mutations in HIVEP2 are associated with developmental delay, intellectual disability, and dysmorphic features. Neurogenetics. 2016;17:159–164. doi: 10.1007/s10048-016-0479-z. [DOI] [PMC free article] [PubMed] [Google Scholar]
- Sturm D., Witt H., Hovestadt V., Khuong-Quang D.-A., Jones D.T.W., Konermann C., Pfaff E., Tönjes M., Sill M., Bender S. Hotspot mutations in H3F3A and IDH1 define distinct epigenetic and biological subgroups of glioblastoma. Cancer Cell. 2012;22:425–437. doi: 10.1016/j.ccr.2012.08.024. [DOI] [PubMed] [Google Scholar]
- Sun Y., Pollard S., Conti L., Toselli M., Biella G., Parkin G., Willatt L., Falk A., Cattaneo E., Smith A. Long-term tripotent differentiation capacity of human neural stem (NS) cells in adherent culture. Mol. Cell. Neurosci. 2008;38:245–258. doi: 10.1016/j.mcn.2008.02.014. [DOI] [PubMed] [Google Scholar]
- Thorvaldsdóttir H., Robinson J.T., Mesirov J.P. Integrative Genomics Viewer (IGV): high-performance genomics data visualization and exploration. Brief. Bioinform. 2013;14:178–192. doi: 10.1093/bib/bbs017. [DOI] [PMC free article] [PubMed] [Google Scholar]
- Valencia A.M., Kadoch C. Chromatin regulatory mechanisms and therapeutic opportunities in cancer. Nat. Cell Biol. 2019;21:152–161. doi: 10.1038/s41556-018-0258-1. [DOI] [PMC free article] [PubMed] [Google Scholar]
- Veloso A., Kirkconnell K.S., Magnuson B., Biewen B., Paulsen M.T., Wilson T.E., Ljungman M. Rate of elongation by RNA polymerase II is associated with specific gene features and epigenetic modifications. Genome Res. 2014;24:896–905. doi: 10.1101/gr.171405.113. [DOI] [PMC free article] [PubMed] [Google Scholar]
- Verginelli F., Perin A., Dali R., Fung K.H., Lo R., Longatti P., Guiot M.-C., Del Maestro R.F., Rossi S., di Porzio U. Transcription factors FOXG1 and Groucho/TLE promote glioblastoma growth. Nat. Commun. 2013;4:2956. doi: 10.1038/ncomms3956. [DOI] [PMC free article] [PubMed] [Google Scholar]
- Vladoiu M.C., El-Hamamy I., Donovan L.K., Farooq H., Holgado B.L., Sundaravadanam Y., Ramaswamy V., Hendrikse L.D., Kumar S., Mack S.C. Childhood cerebellar tumours mirror conserved fetal transcriptional programs. Nature. 2019;572:67–73. doi: 10.1038/s41586-019-1158-7. [DOI] [PMC free article] [PubMed] [Google Scholar]
- Voon H.P.J., Udugama M., Lin W., Hii L., Law R.H.P., Steer D.L., Das P.P., Mann J.R., Wong L.H. Inhibition of a K9/K36 demethylase by an H3.3 point mutation found in paediatric glioblastoma. Nat. Commun. 2018;9:3142. doi: 10.1038/s41467-018-05607-5. [DOI] [PMC free article] [PubMed] [Google Scholar]
- Weinberg D.N., Allis C.D., Lu C. Oncogenic mechanisms of histone H3 mutations. Cold Spring Harb. Perspect. Med. 2017;7:a026443. doi: 10.1101/cshperspect.a026443. [DOI] [PMC free article] [PubMed] [Google Scholar]
- Wen H., Li Y., Xi Y., Jiang S., Stratton S., Peng D., Tanaka K., Ren Y., Xia Z., Wu J. ZMYND11 links histone H3.3K36me3 to transcription elongation and tumour suppression. Nature. 2014;508:263–268. doi: 10.1038/nature13045. [DOI] [PMC free article] [PubMed] [Google Scholar]
- Wilkerson M.D., Hayes D.N. ConsensusClusterPlus: a class discovery tool with confidence assessments and item tracking. Bioinformatics. 2010;26:1572–1573. doi: 10.1093/bioinformatics/btq170. [DOI] [PMC free article] [PubMed] [Google Scholar]
- Wu G., Broniscer A., McEachron T.A., Lu C., Paugh B.S., Becksfort J., Qu C., Ding L., Huether R., Parker M., St. Jude Children’s Research Hospital–Washington University Pediatric Cancer Genome Project Somatic histone H3 alterations in pediatric diffuse intrinsic pontine gliomas and non-brainstem glioblastomas. Nat. Genet. 2012;44:251–253. doi: 10.1038/ng.1102. [DOI] [PMC free article] [PubMed] [Google Scholar]
- Xuan S., Baptista C.A., Balas G., Tao W., Soares V.C., Lai E. Winged helix transcription factor BF-1 is essential for the development of the cerebral hemispheres. Neuron. 1995;14:1141–1152. doi: 10.1016/0896-6273(95)90262-7. [DOI] [PubMed] [Google Scholar]
- Yip D.J., Corcoran C.P., Alvarez-Saavedra M., DeMaria A., Rennick S., Mears A.J., Rudnicki M.A., Messier C., Picketts D.J. Snf2l regulates Foxg1-dependent progenitor cell expansion in the developing brain. Dev. Cell. 2012;22:871–878. doi: 10.1016/j.devcel.2012.01.020. [DOI] [PMC free article] [PubMed] [Google Scholar]
- Yoshida M., Suda Y., Matsuo I., Miyamoto N., Takeda N., Kuratani S., Aizawa S. Emx1 and Emx2 functions in development of dorsal telencephalon. Development. 1997;124:101–111. doi: 10.1242/dev.124.1.101. [DOI] [PubMed] [Google Scholar]
- Young F.I., Keruzore M., Nan X., Gennet N., Bellefroid E.J., Li M. The doublesex-related Dmrta2 safeguards neural progenitor maintenance involving transcriptional regulation of Hes1. Proc. Natl. Acad. Sci. U S A. 2017;114:E5599–E5607. doi: 10.1073/pnas.1705186114. [DOI] [PMC free article] [PubMed] [Google Scholar]
- Yu G., Wang L.G., Han Y., He Q.Y. clusterProfiler: an R package for comparing biological themes among gene clusters. OMICS. 2012;16:284–287. doi: 10.1089/omi.2011.0118. [DOI] [PMC free article] [PubMed] [Google Scholar]
- Zhang Y., Liu T., Meyer C.A., Eeckhoute J., Johnson D.S., Bernstein B.E., Nusbaum C., Myers R.M., Brown M., Li W., Liu X.S. Model-based analysis of ChIP-seq (MACS) Genome Biol. 2008;9:R137. doi: 10.1186/gb-2008-9-9-r137. [DOI] [PMC free article] [PubMed] [Google Scholar]
- Zhang Y., Shan C.M., Wang J., Bao K., Tong L., Jia S. Molecular basis for the role of oncogenic histone mutations in modulating H3K36 methylation. Sci. Rep. 2017;7:43906. doi: 10.1038/srep43906. [DOI] [PMC free article] [PubMed] [Google Scholar]
- Zhu L.J., Gazin C., Lawson N.D., Pagès H., Lin S.M., Lapointe D.S., Green M.R. ChIPpeakAnno: a Bioconductor package to annotate ChIP-seq and ChIP-chip data. BMC Bioinformatics. 2010;11:237. doi: 10.1186/1471-2105-11-237. [DOI] [PMC free article] [PubMed] [Google Scholar]
- Zweifel S., Marcy G., Lo Guidice Q., Li D., Heinrich C., Azim K., Raineteau O. HOPX defines heterogeneity of postnatal subventricular zone neural stem cells. Stem Cell Reports. 2018;11:770–783. doi: 10.1016/j.stemcr.2018.08.006. [DOI] [PMC free article] [PubMed] [Google Scholar]
Associated Data
This section collects any data citations, data availability statements, or supplementary materials included in this article.
Supplementary Materials
Data Availability Statement
The accession numbers for the RNA-seq and ChIP-seq datasets reported in this paper are Gene Expression Omnibus (GEO): GSE163044 and GSE163185. Proteomics data is available at ProteomeXchange with identifier PXD021270.