Abstract
Background
To explore the epidemiological characteristics of allergic rhinitis (AR) and allergic conjunctivitis (AC) based on the Internet big data.
Methods
The Baidu index (BDI) of keywords “allergic rhinitis” and “allergic conjunctivitis” in Mandarin, the daily pollen concentration (PC) released by the Beijing Meteorological Bureau and the volumes of outpatient visits (OV) of the Beijing Tongren Hospital (Beijing) and the Third Affiliated Hospital of Sun Yat-sen University (Guangzhou) from 2017 to 2020 were obtained. The temporal and spatial changes of AR and AC were discussed. The correlations between BDI and PC/OV were analyzed by Spearman correlation analysis.
Results
The trends of BDI of “AR”/“AC” in Beijing showed obvious seasonal variations, but not in Guangzhou. The BDI of “AR” and “AC” was consistent with the OV in both cities (r1AR-BJ=0.580, P<0.001; r1AR-GZ=0.360, P=0.031; r1AC-BJ=0.885, P<0.001; r1AC-GZ=0.694, P<0.001). The BDI of “AR” and “AC” was highly consistent with the change of the PC in Beijing (r AR-Pollen=0.826, P<0.001; r AC-Pollen=0.564, P<0.001). The OV of AR in Beijing and Guangzhou decreased significantly in the first half of 2020, but there was no significant change in AC. In the first half of 2020, the OV of AC in Beijing was significantly higher than that of AR, while that of AC in Guangzhou was slightly higher than that of AR.
Conclusion
The BDI could reflect the real-world situation to some extent and has the potential to predict the epidemiological characteristics of AR and AC. The BDI and OV of AR decreased significantly, but those of AC were still at a high level, during the COVID-19 pandemic, in the environment where most people in Beijing and Guangzhou wore masks without eye protection.
Keywords: allergic rhinitis, allergic conjunctivitis, Internet, Baidu, big data, COVID-19
Introduction
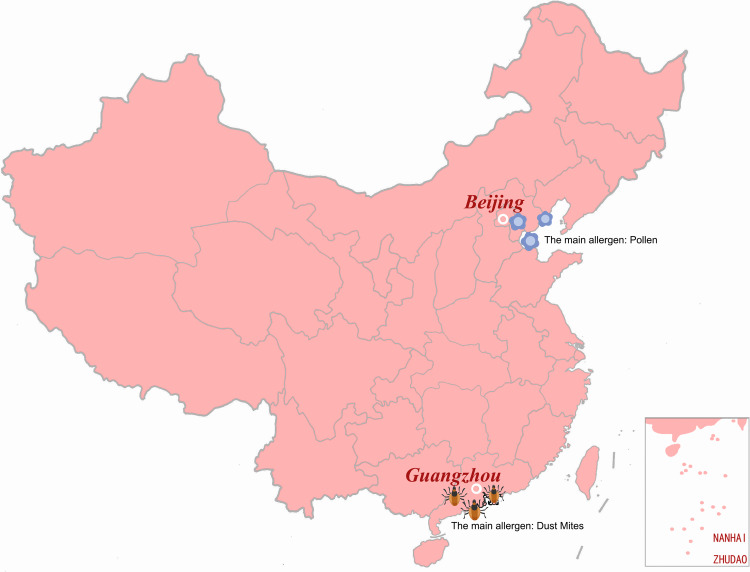
The increase in the incidence of allergic diseases is a serious global public health problem.1 Allergic rhinitis (AR) and allergic conjunctivitis (AC) are common allergic diseases in China. Pollen are the main allergens in Beijing (Figure 1), 2,3 a modern city in northern China, and dust mites in Guangzhou (Figure 1), 4 a modern city in southern China. The clinical symptoms of AR include itchy nose, stuffy nose, sneezing, and runny nose.1 The main clinical manifestations of AC are itching, tears, and conjunctival congestion.5 The above symptoms can seriously affect patients’ quality of life.6–8 In addition to medication, avoiding outdoor activities during peak pollen periods and wearing masks to reduce direct contact with airborne allergens are also effective ways to relieve symptoms. At present, the global spread of Corona Virus Disease 2019 (COVID-19) has infected more than seventy-four million people around the world.9 It is essential to prevent infection, and wearing a mask is an effective way to achieve this goal.10–14 During the pandemic, China was highly mobilized and residents acted very cautiously. Almost everyone avoided crowded places and wore masks when they left home.15
Figure 1.
The main allergens map of Beijing and Guangzhou.
According to the statistics of the China Internet Network Information Center, the number of Internet users in China reached 986 million by 2020,16 and the user penetration rate of the Baidu search engine was 90.9%, which is the world’s largest mandarin search engine and mostly used Chinese website.17 Many studies suggested that the query frequency of diseases and related symptom keywords were highly related to the symptoms of patients, which can reflect the real demand trend of searchers.18–20 The Baidu index platform publishes the search volumes of specific search terms, called Baidu index, in various cities every day, which reflects the real needs of searchers to a certain extent. Accordingly, we tried to analyze the big data of the Baidu index, the pollen concentration data released by the Beijing Meteorological Bureau, as well as the outpatient visits data of the Beijing Tongren Hospital (Beijing) and the Third Affiliated Hospital of Sun Yat-Sen University (Guangzhou) to explore the epidemiological characteristics of AR and AC during the COVID-19 pandemic in Beijing and Guangzhou, two modern cities in northern and southern China, respectively.
Methods
The Source and Retrieval Strategy of the Big Data
Step 1: Search the Baidu index platform (http://index.baidu.com) for the daily Baidu index and the “user profile”, which provides the user’s age information, of “allergic rhinitis” and “allergic conjunctivitis” in Mandarin, geographically in Beijing and Guangzhou, from January 1, 2014 to June 30, 2020 (including mobile and personal computer data).
Step 2: Extract daily pollen concentration data from April 1, 2017 to June 30, 2020 on the official Weibo of the Beijing Meteorological Bureau (http://weibo.com/qixiangbj)).
Step 3: Count the daily volumes and age information of outpatient diagnosed with “allergic rhinitis” or “allergic conjunctivitis” from January 1, 2017 to June 30, 2020 in the Beijing Tongren Hospital (Beijing) and the Third Affiliated Hospital of Sun Yat-Sen University (Guangzhou).
Statistical Analysis
(1) Compared the temporal and spatial changes of the Baidu index of “allergic rhinitis” and “allergic conjunctivitis” from January 1, 2014 to June 30, 2020.
(2) Analyzed the correlation between the Baidu index of “allergic rhinitis” and “allergic conjunctivitis” and the daily volumes of outpatient diagnosed with “allergic rhinitis” and “allergic conjunctivitis” in the Beijing Tongren Hospital (Beijing) and the Third Affiliated Hospital, Sun Yat-Sen University (Guangzhou) from January 1, 2017 to December 31, 2019.
(3) According to the results of the Baidu index “user profile”, the daily volumes of outpatient aged 20 to 49 diagnosed as “allergic rhinitis” and “allergic conjunctivitis” were selected in two hospitals from January 1, 2017 to December 31, 2019. Correlation analysis was made with the Baidu index of “allergic rhinitis” and “allergic conjunctivitis”.
(4) Analyzed the correlation between the average daily pollen concentration during the pollen peak period from April 1, 2017 to September 30, 2019 and the daily Baidu index of “allergic rhinitis” and “allergic conjunctivitis” in Beijing.
(5) Compared the Baidu index of “allergic rhinitis” and “allergic conjunctivitis” from January 1 to June 30 in each individual year from 2017 to 2020.
(6) The daily pollen concentration in Beijing from April 1 to June 30 in each individual year from 2017 to 2020 was compared.
(7) The monthly volumes of outpatient visits of “allergic conjunctivitis” and “allergic rhinitis” in the Beijing Tongren Hospital (Beijing) and the Third Affiliated Hospital of Sun Yat-Sen University (Guangzhou) from January 1, 2017 to June 30, 2020 were compared.
(8) Spearman correlation analysis was used to analyze the correlation between the Baidu index and the pollen concentration or the volumes of outpatient visits. All data analysis were performed using IBM SPSS software (SPSS, Inc, Chicago, IL, USA). Two‐tailed P value < 0.05 indicated as statistical significance. Figures were designed using Microsoft Excel (Microsoft Corporation, Redmond, WA, USA).
Results
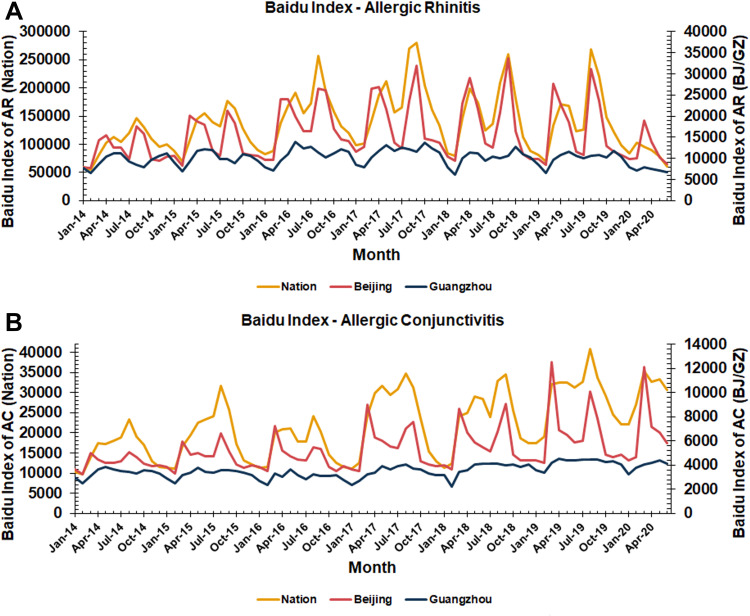
Took “allergic rhinitis” and “allergic conjunctivitis” as the keywords, the search was conducted from January 1, 2014 to June 30, 2020 in the Baidu index platform. The results showed that the trend of the Baidu index of “allergic rhinitis” in the whole country had noticeable seasonal changes. The first peak was from April to May, and the second peak was from August to September each year (Figure 2A). The trend of the Baidu index of “allergic rhinitis” in Beijing also had noticeable seasonal variations, and the trend was consistent with that of the whole country (Figure 2A). On the other hand, there was no evident seasonal difference in the trend of the Baidu index of “allergic rhinitis” in Guangzhou but a relative trough, which appeared in January to February each year (Figure 2A). The retrieval of “allergic rhinitis” in the whole country, Beijing and Guangzhou in the first half of 2020 decreased significantly compared with the same period in previous years (Figure 2A). The Baidu index trends of “allergic conjunctivitis” in the whole country, Beijing and Guangzhou were consistent with that of “allergic rhinitis”. However, the Baidu index of “allergic conjunctivitis” in the whole country, Beijing and Guangzhou in the first half of 2020 were not significantly different with the same period in previous years (Figure 2B).
Figure 2.
The monthly Baidu index of AR and AC in the whole country, Beijing and Guangzhou from 2014 to 2020. (A) The Baidu index of “allergic rhinitis”; (B) The Baidu index of “allergic conjunctivitis”.
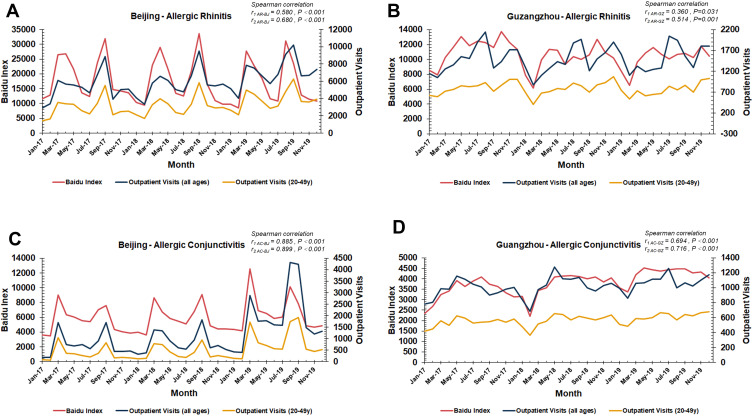
The results of the Spearman correlation analysis showed that the volumes of outpatient diagnosed as “allergic rhinitis” and “allergic conjunctivitis” in the Beijing Tongren Hospital (Beijing) and the Third Affiliated Hospital of Sun Yat-sen University (Guangzhou) from January 1, 2017 to December 31, 2019 were consistent with the Baidu index of “allergic rhinitis” and “allergic conjunctivitis” in Beijing and Guangzhou, respectively (r1AR-BJ=0.580, P<0.001; r1AR-GZ=0.360, P=0.031; r1AC-BJ=0.885, P<0.001; r1AC-GZ=0.694, P<0.001; Figure 3). According to the statistical results of the Baidu index “user profile”, the users who searched “allergic rhinitis” and “allergic conjunctivitis” were mainly 20–49 years old in Baidu search engine (Figure S1). So we selected people aged 20–49 from the outpatients of the two hospitals, and analyzed the correlation between the volumes of outpatient visits and the Baidu index of “allergic rhinitis” and “allergic conjunctivitis”. The results showed that the correlation coefficient between the Baidu index and the volumes of outpatient visits increased significantly, suggesting that the Baidu index could better reflect the medical needs of people aged 20–49 years old (r2AR-BJ=0.680, P<0.001; r2AR-GZ=0.514, P =0.001; r2AC-BJ=0.899, P<0.001; r2AC-GZ=0.716, P<0.001; Figure 3).
Figure 3.
The monthly Baidu index and the volumes of outpatient visits of AR and AC in Beijing and Guangzhou from Jan-17 to Dec-19. (A) Beijing-allergic rhinitis; (B) Guangzhou-allergic rhinitis; (C) Beijing-allergic conjunctivitis; (D) Guangzhou- allergic conjunctivitis (r1AR-BJ=0.580, P<0.001; r1AR-GZ=0.360, P=0.031; r1AC-BJ=0.885, P<0.001; r1AC-GZ=0.694, P<0.001; r2AR-BJ=0.680, P<0.001; r2AR-GZ=0.514, P=0.001; r2AC-BJ=0.899, P<0.001; r2AC-GZ=0.716, P<0.001).
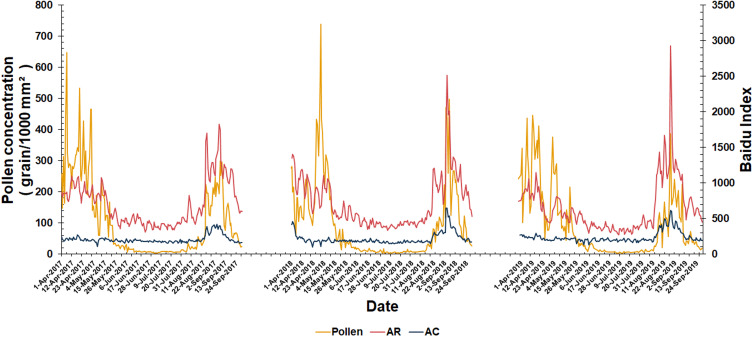
The daily pollen concentration released by the Beijing Meteorological Bureau was from April 1 to September 30 each year. The results of the Spearman correlation analysis showed that the daily pollen concentration from 2017 to 2019 was highly consistent with the daily Baidu index of “allergic rhinitis” and “allergic conjunctivitis” in Beijing, and increased synchronously during the pollen peak (r AR-Pollen=0.826, P<0.001; r AC-Pollen=0.564, P<0.001; Figure 4).
Figure 4.
The daily pollen concentration and the Baidu index of AR and AC in Beijing during pollen seasons (r AR-Pollen=0.826, P<0.001; r AC-Pollen=0.564, P<0.001).
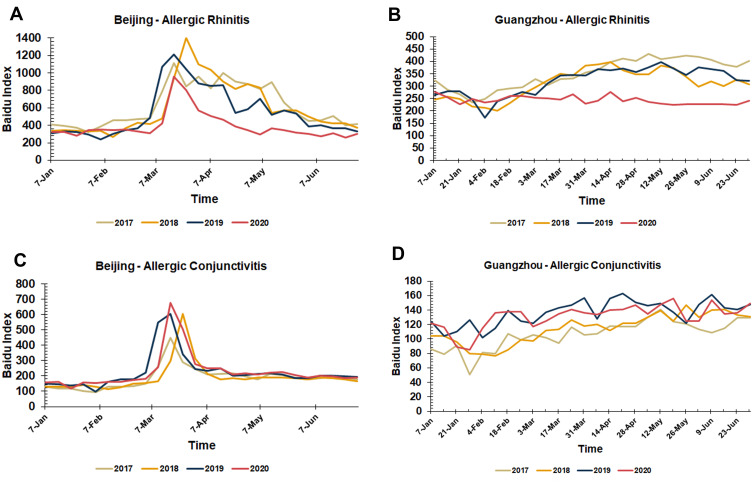
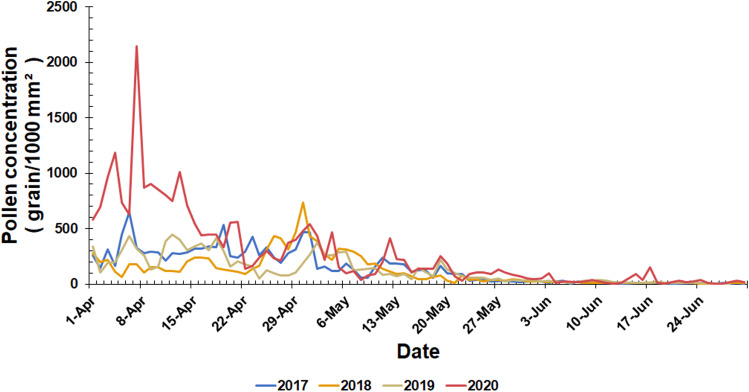
Compared with the same period from 2017 to 2019, the Baidu index of “allergic rhinitis” in Beijing and Guangzhou decreased significantly in the first half of 2020 (Figure 5A and B), while that of “allergic conjunctivitis” did not change significantly (Figure 5C and D). Interestingly, contrary to the Baidu index, the pollen concentration in Beijing in the first half of 2020 was significantly higher than that in the same period from 2017 to 2019 (Figure 6).
Figure 5.
The weekly Baidu index of AR and AC in Beijing/Guangzhou in the first half of each year from 2017 to 2020. (A) Beijing-allergic rhinitis; (B) Guangzhou-allergic rhinitis; (C) Beijing-allergic conjunctivitis; (D) Guangzhou- allergic conjunctivitis.
Figure 6.
The daily pollen concentration from April 1 to June 30 each year from 2017 to 2020 in Beijing.
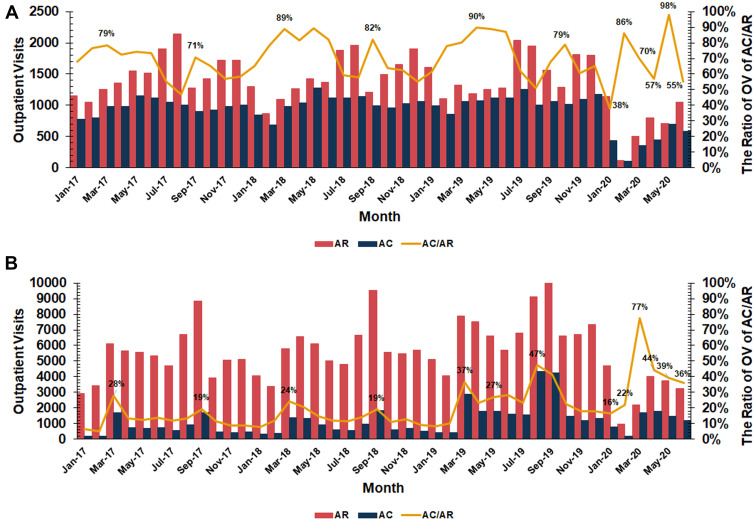
Affected by the COVID-19 pandemic, the volumes of outpatient visits in both hospitals decreased significantly in the first half of 2020 (Figure 7). Therefore, we could not compare the absolute value of the volumes of outpatient visits. However, comparing the ratio of “allergic conjunctivitis” to “allergic rhinitis”, it was found that the volumes of outpatients visits of allergic conjunctivitis in the Beijing Tongren Hospital (Beijing) was significantly higher than that of allergic rhinitis in the first half of 2020 (Figure 7A). The volumes of outpatient visits of allergic conjunctivitis in the Third Affiliated Hospital of Sun Yat-sen University (Guangzhou) increased only slightly relative to allergic rhinitis (Figure 7B).
Figure 7.
The ratio of AC/AR of the monthly volumes of outpatient visits from January-2017 to June-2020. (A) Beijing Tongren Hospital (Beijing); (B) The Third Affiliated Hospital of Sun Yat-sen University (Guangzhou).
Discussion
The Internet has penetrated people’s daily life, and the use of network search engines for retrieval is an essential way for people to obtain medical information.17 “Searching before seeing a doctor” has become a networking habit of patients and their family members in China. Searching disease-related keywords can directly reflect the real intention and demand of the searcher to some extent.18–20 The network search data has the characteristics of a large sample size, rapid response, easy access, low cost, and so on. The Internet big data can play a supplementary role for us to further understand allergic diseases such as allergic rhinitis and allergic conjunctivitis.
There are noticeable regional differences in the incidence of allergic diseases in China, and there are also noticeable regional differences in the types of allergens. The main allergens in Beijing are pollen (Figure 1), 2,3 and the main allergens in Guangzhou are dust mites (Figure 1).4 This study analyzed the two keywords “allergic rhinitis” and “allergic conjunctivitis” from January 1, 2014 to June 30, 2020, and found that the search trend of the keyword “allergic rhinitis” in the whole country was consistent with that in Beijing but significantly different from that in Guangzhou (Figure 2). The search trends in the entire country and Beijing suggest that there were significant seasonal differences in the incidence of allergic rhinitis and allergic conjunctivitis, in which April-May and August-September were the peaks of search (Figure 2), which was consistent with the peak period of pollen (Figure 4). There was no significant seasonal difference in the search trend in Guangzhou, suggesting that the disease was perennial, and the average monthly Baidu index for the whole year was maintained at a similar level, with an obvious trough from January to February (Figure 2). Dust mites are the main allergens in patients with allergic rhinitis and allergic conjunctivitis in Guangzhou. The search trough may be related to the lower average temperature from January to February in Guangzhou, and the significantly reduced dust mite activity and reproductive ability, leading to the apparent relief of symptoms of patients.
In this study, the daily Baidu index of “allergic rhinitis” and “allergic conjunctivitis” from 2017 to 2019 was analyzed with the daily pollen concentration monitored and released by the Beijing Meteorological Bureau or the daily volumes of outpatient visits of the Beijing Tongren Hospital (Beijing) and the Third Affiliated Hospital of Sun Yat-sen University (Guangzhou). The results showed that the Baidu index was significantly correlated with real-world data (Figures 3 and 4). It is also suggested that the big data of the Baidu Search Engine could better reflect the medical needs of people aged 20–49 years old (Figure 3). The above results showed that the big data of the relevant medical information in the online search engine could reflect the epidemiological characteristics of allergic rhinitis and allergic conjunctivitis to some extent.
Recently, Nanshan Zhong, the leader of the National Health Commission Senior Expert Group in China, delivered a keynote speech at the 2020 Beijing Health Conference and Doctors’ Cloud Forum. The data released by Prof. Zhong showed that the incidence of all 40 legal infectious diseases in China decreased in the first half of 2020, indicating that the right personal hygiene habits developed and maintained, such as maintaining social distance, wearing masks and washing hands carefully, in the pandemic of COVID-19 play an important role. Similarly, the volumes of outpatient visits in the Beijing Tongren Hospital (Beijing) and the Third Affiliated Hospital of Sun Yat-sen University (Guangzhou) decreased significantly in the first half of 2020 (Figure 7). By comparing the ratio of “allergic conjunctivitis” to “allergic rhinitis”, it was found that the volumes of patients with allergic conjunctivitis in the Beijing Tongren Hospital (Beijing) were significantly higher than that of allergic rhinitis in the first half of 2020 (Figure 7A). However, the volumes of outpatient visits for allergic conjunctivitis in the Third Affiliated Hospital of Sun Yat-sen University (Guangzhou) were only slightly higher than that of allergic rhinitis (Figure 7B). The Internet search data showed that compared with the same period from 2017 to 2019, the Baidu index of “allergic rhinitis” in Beijing and Guangzhou decreased significantly in the first half of 2020 (Figure 5A and B), but there was no significant decrease in “allergic conjunctivitis” (Figure 5C and D).
On the contrary, compared with the same period from 2017 to 2019, the pollen concentration in Beijing, monitored by Beijing Meteorological Observatory, increased significantly in the first half of 2020 (Figure 6). The above results showed that affected by the COVID-19 pandemic, the incidence of allergic rhinitis decreased significantly, but the incidence of allergic conjunctivitis did not decrease significantly. We speculated that this contradictory phenomenon might be related to the fact that people wore masks to prevent infection with SARS-CoV-2, thus reducing the direct contact between the upper respiratory tract and airborne allergens. Patients with allergic rhinitis and allergic conjunctivitis in Beijing were mainly allergic to pollen,2,3 and wearing a mask during outdoor activities could effectively prevent sensitized pollen from entering the nasal cavity and reduce the incidence of allergic rhinitis, resulting in a significant decrease in the volumes of searches and the volumes of outpatient visits for “allergic rhinitis”. However, people generally lacked the protection of their eyes, and pollen could still be in direct contact with the conjunctiva, so compared with allergic rhinitis, the volumes of outpatient visits and network search of allergic conjunctivitis was still high. The primary allergen of Guangzhou was dust mites in the family environment.4 People generally would not wear masks at home, so they could not avoid direct contact between the nasal cavity and dust mites, which leads to the disease. However, wearing a mask in outdoor activities, indoor social interaction and other conditions could heat and humidify the inhaled air, thus alleviating the symptoms of discomfort to a certain extent. Besides, affected by the pandemic, people to improve indoor environment, household supplies cleaning may also play a particular role in protection. Therefore, we suggested that patients with allergic rhinitis and allergic conjunctivitis should continue to maintain good personal hygiene habits and wear masks and glasses when going out, which can effectively relieve allergic symptoms.
The main limitations of this study are as follows: First, the use of Internet search data to assist epidemiological surveillance depends on the number of Internet visits, while the primary users of Internet search engines in China are young and middle-aged people aged 20–49 years old. There may be an age bias. Second, because the historical pollen concentration data could be retrieved and obtained only in Beijing, but the pollen concentration prediction project has not been carried out in Guangzhou. As a result, this study failed to analyze the correlation between the pollen concentration and the Baidu index of “allergic rhinitis” and “allergic conjunctivitis” in Guangzhou. Third, only one hospital’s outpatient visits data were obtained in both cities, which may lead to sample bias. Finally, this study found that there is a correlation between the Baidu index and the real-world data. However, we must be clear that correlation is not equal to causation and it might be influenced by many factors. More researches should be carried out in the future to fully prove the role of the Internet big data in the monitoring of diseases.
In conclusion, our study showed that the Baidu index could reflect the real-world situation to some extent and has the potential to predict the epidemiological trend of allergic rhinitis and allergic conjunctivitis. During the COVID-19 pandemic, China’s high mobilization ability prompted everyone to wear masks as required, which may be the main reason for the apparent decline in the number of searches and the volumes of outpatient visits for allergic rhinitis. However, people generally lack the protection of eyes, so the number of network searches and the volumes of outpatient visits of allergic conjunctivitis was still at a high level. To relieve nasal and eye symptoms, we recommend that patients with allergic rhinitis and allergic conjunctivitis use suitable masks, glasses and pollen blockers to reduce allergen inhalation into the nasal cavity or contact with conjunctiva. Besides, the groups who use web search engines for medical information are mainly young and middle-aged people between the ages of 20 and 49, and there is not enough coverage for children and the elderly. Therefore, Internet training for all should be strengthened in the future so that the Internet can provide more accurate and valuable data. In the era of big data, we should pay more attention to this new type of data from the real world, as a useful supplement to traditional data.
Acknowledgments
This work was supported by the National Natural Science Foundation of China (Grant No. 81670912,81870704 and U20A20399), and Sun Yat-sen University Clinical Research 5010 Program (Grant No. 2019006).
Funding Statement
This work was supported by the National Natural Science Foundation of China [Grant numbers 81670912, 81870704 and U20A20399], and Sun Yat-sen University Clinical Research 5010 Program [Grant numbers: 2019006].
Statement of Ethics
Ethical approval was obtained from the Ethics Committee for Human Study at the Third Affiliated Hospital of Sun Yat-sen University (China). ([2020]02-001-01). Written informed consent was obtained from all outpatients in this study. All procedures complied with the declaration of Helsinki.
Author Contributions
All authors made substantial contributions to conception and design, acquisition of data, or analysis and interpretation of data; took part in drafting the article or revising it critically for important intellectual content; agreed to submit to the current journal; gave final approval of the version to be published; and agree to be accountable for all aspects of the work.
Disclosure
The authors have no conflicts of interest to declare.
References
- 1.Bousquet J, Khaltaev N, Cruz AA, et al. Allergic Rhinitis and its Impact on Asthma (ARIA) 2008 update (in collaboration with the World Health Organization, GA (2) LEN and AllerGen). Allergy. 2008;63(Suppl 86):8–160. [DOI] [PubMed] [Google Scholar]
- 2.Lou H, Ma S, Zhao Y, et al. Sensitization patterns and minimum screening panels for aeroallergens in self-reported allergic rhinitis in China. Sci Rep. 2017;7:9286. doi: 10.1038/s41598-017-10111-9 [DOI] [PMC free article] [PubMed] [Google Scholar]
- 3.Ouyang Y, Yin Z, Li Y, et al. Associations among air pollutants, grass pollens, and daily number of grass pollen allergen-positive patients: a longitudinal study from 2012 to 2016. Int Forum Allergy Rhinol. 2019;9:1297–1303. doi: 10.1002/alr.22389 [DOI] [PubMed] [Google Scholar]
- 4.Wang W, Huang X, Chen Z, et al. Prevalence and trends of sensitisation to aeroallergens in patients with allergic rhinitis in Guangzhou, China: a 10-year retrospective study. BMJ Open. 2016;6:e011085. doi: 10.1136/bmjopen-2016-011085 [DOI] [PMC free article] [PubMed] [Google Scholar]
- 5.Bielory L, Delgado L, Katelaris CH, et al. ICON: diagnosis and management of allergic conjunctivitis. Ann Allergy Asthma Immunol. 2020;124(2):118–134. doi: 10.1016/j.anai.2019.11.014 [DOI] [PubMed] [Google Scholar]
- 6.Leynaert B, Neukirch C, Liard R, et al. Quality of life in allergic rhinitis and asthma. A population-based study of young adults. Am J Respir Crit Care Med. 2000;162(4):1391–1396. doi: 10.1164/ajrccm.162.4.9912033 [DOI] [PubMed] [Google Scholar]
- 7.Palmares J, Delgado L, Cidade M, et al. Allergic conjunctivitis: a national cross-sectional study of clinical characteristics and quality of life. Eur J Ophthalmol. 2010;20(2):257–264. doi: 10.1177/112067211002000201 [DOI] [PubMed] [Google Scholar]
- 8.Brozek JL, Bousquet J, Agache I, et al. Allergic Rhinitis and its Impact on Asthma (ARIA) guidelines-2016 revision. J Allergy Clin Immunol. 2017;140:950–958. doi: 10.1016/j.jaci.2017.03.050 [DOI] [PubMed] [Google Scholar]
- 9.World Health Organization. WHO Coronavirus Disease (COVID-19) Dashboard; 2020. https://covid19.who.int/. Accessed April23, 2021.
- 10.Cheng VC, Wong SC, Chuang VW, et al. The role of community-wide wearing of face mask for control of coronavirus disease 2019 (COVID-19) epidemic due to SARS-CoV-2. J Infect. 2020;81:107–114. doi: 10.1016/j.jinf.2020.04.024 [DOI] [PMC free article] [PubMed] [Google Scholar]
- 11.Chu DK, Akl EA, Duda S, et al. Physical distancing, face masks, and eye protection to prevent person-to-person transmission of SARS-CoV-2 and COVID-19: a systematic review and meta-analysis. Lancet. 2020;395:1973–1987. doi: 10.1016/S0140-6736(20)31142-9 [DOI] [PMC free article] [PubMed] [Google Scholar]
- 12.Esposito S, Principi N, Leung CC, et al. Universal use of face masks for success against COVID-19: evidence and implications for prevention policies. Eur Respir J. 2020;55:2001260. doi: 10.1183/13993003.01260-2020 [DOI] [PMC free article] [PubMed] [Google Scholar]
- 13.Javid B, Weekes MP, Matheson NJ. Covid-19: should the public wear face masks? BMJ. 2020;369:m1442. doi: 10.1136/bmj.m1442 [DOI] [PubMed] [Google Scholar]
- 14.Wiersinga WJ, Rhodes A, Cheng AC, et al. Pathophysiology, transmission, diagnosis, and treatment of coronavirus disease 2019 (COVID-19): a Review. JAMA. 2020;324(8):782. doi: 10.1001/jama.2020.12839 [DOI] [PubMed] [Google Scholar]
- 15.Zhong BL, Luo W, Li HM, et al. Knowledge, attitudes, and practices towards COVID-19 among Chinese residents during the rapid rise period of the COVID-19 outbreak: a quick online cross-sectional survey. Int J Biol Sci. 2020;16:1745–1752. doi: 10.7150/ijbs.45221 [DOI] [PMC free article] [PubMed] [Google Scholar]
- 16.CNNIC. The 47th China statistical report on internet development (in Chinese). [serial on the Internet]; 2021. Available from: http://www.cnnic.net.cn/hlwfzyj/hlwxzbg/. Accessed February17, 2021.
- 17.CNNIC. 2019 Chinese netizens search engine usage research report (in Chinese). [serial on the Internet]; 2019. Available from: http://www.cnnic.net.cn/hlwfzyj/hlwxzbg/. Accessed February17, 2021.
- 18.Kang M, Zhong H, He J, et al. Using Google Trends for influenza surveillance in South China. PLoS One. 2013;8(1):e55205. doi: 10.1371/journal.pone.0055205 [DOI] [PMC free article] [PubMed] [Google Scholar]
- 19.Milinovich GJ, Williams GM, Clements ACA, et al. Internet-based surveillance systems for monitoring emerging infectious diseases. Lancet Infect Dis. 2014;14:160–168. doi: 10.1016/S1473-3099(13)70244-5 [DOI] [PMC free article] [PubMed] [Google Scholar]
- 20.Li K, Liu M, Feng Y, et al. Using baidu search engine to monitor AIDS epidemics inform for targeted intervention of HIV/AIDS in China. Sci Rep. 2019;9:320. doi: 10.1038/s41598-018-35685-w [DOI] [PMC free article] [PubMed] [Google Scholar]


