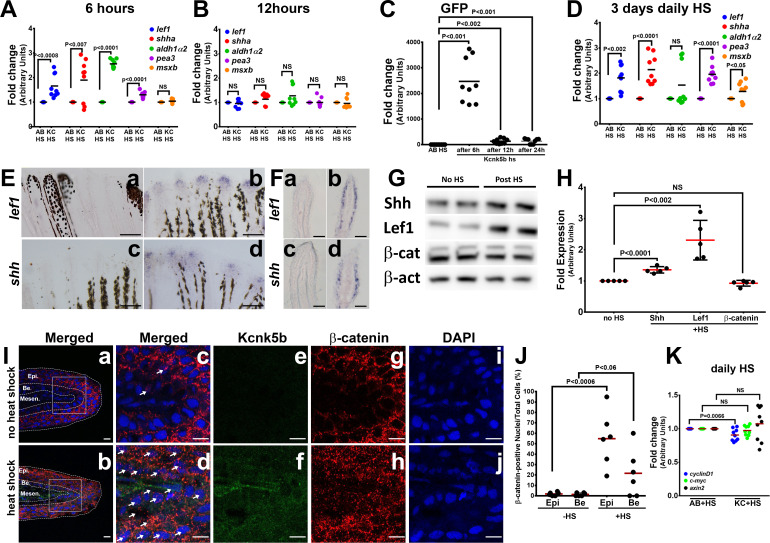
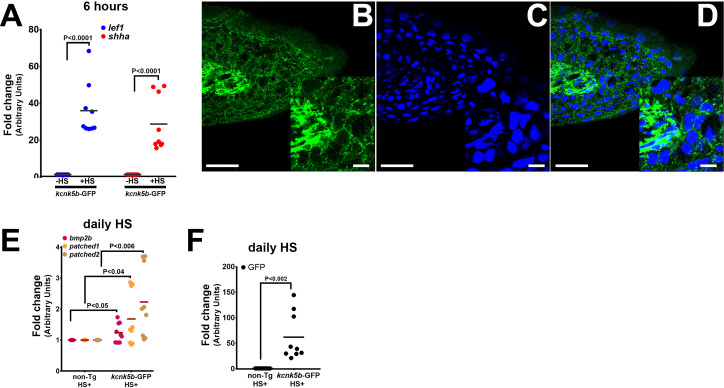
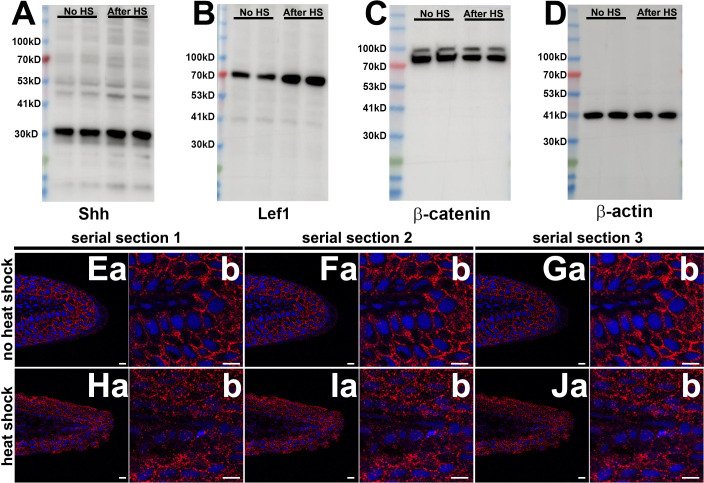
Figure 1. Kcnk5b induces a partial developmental gene response in uninjured adult fins.
(A) qRT-PCR results of shh and lef1, aldh1α2, pea3, and msxb expression from caudal fins of 6-month-old wild-type (AB) and Tg[hsp70:kcnk5b-GFP] zebrafish 6 hr after heat shock (HS)of the caudal fins. (B) qRT-PCR results of shh and lef1, aldh1α2, pea3 and msxb expression from caudal fins of 6-month-old wild-type (AB) and Tg[hsp70:kcnk5b-GFP] zebrafish 12 hr after heat-shock induction of the the caudal fins. (C) qRT-PCR results for GFP from the transgenic fish line Tg[hsp70:kcnk5b-GFP] at the indicated time points relative to the single heat-shock pulse of AB wild-type and transgenic fish. AB HS for each time point were always set at onefold, so they are represented as only one group in the graph. (D) qRT-PCR results for several genes in the caudal fin from daily heat-shock pulse of AB wild-type and Tg[hsp70:knck5b-GFP] over 3 days. (E) In situ hybridization experiments on fins show expression of shh (a,b) and lef1 (c,d) in heat-shocked non-transgenic control fish (a,c) and heat-shocked Tg[hsp70:kcnk5b-GFP](b,d). (F) Cross-sections through fin rays show expression of lef1(a,b) and shh (c,d) before (a,c) and after (b,d) heat-shock induction of Tg[hsp70:kcnk5b-GFP]. (G) Representative images of Western blots show expression of Shh, Lef1 and β-catenin before and 3 days after 10 min daily heat-shock induction of kcnk5b-GFP in the fin. (H) Graphed measurements results of Western blots. (I) Confocal planes (0.45 μm) of immunohistochemistry stained 10 μm sections of control (no heat shock) or transgene-induced (heat shock) uninjured fins for merged GFP from Tg[hsp70:kcnk5b-GFP] and β-catenin (red) (a–d: Merged), GFP from Tg[hsp70:kcnk5b-GFP] (e,f: green) β-catenin (g,h: red) and DAPI (i,j: blue)of fin cross-sections of transgenic Tg[hsp70:kcnk5b-GFP] animals without heat shock (a,c,e,g,i) or after heat shock (b,d,f,h,j). White boxes in (a and b) show location of magnified panels of c,e,g and d,f,j, respectively. Overlapping DAPI and β-catenin staining indicated by white arrows. Epi.’ refers to the outer multilayered epidermis, ‘Be.’ as the underlying basal epithelial layer, and ‘Mesen.’ refers to the underlying mesenchymal tissues. (J) Graphed measurements of DAPI stained nuclei containing staining of β-catenin. (K) qRT-PCR results for the indicated genes in the caudal fin from AB non-transgenic and Tg[hsp70:knck5b-GFP] fish after daily heat-shock pulses over 3 days. Scale bars are 50 µm (D), 1 mm (E), 10 µm (H). The data for each experiment represent three or more separate experiments. The data points show all technical replicates. Student’s T-test used for the tests of significance between indicated experimental groups.


