

Introduction
Chronic myeloid leukemia (CML) is a cancer of the hematopoetic system caused by the formation of the BCR-ABL fusion gene, which promotes the unregulated proliferation of CML cells through the production of novel chimeric tyrosine kinase (1). This disease occurs primarily in adults, with a median age at onset of 65 in the US, and progresses in three stages of increasing severity: chronic, accelerated, and blast (2). The majority of CML cases (approximately 85%) are diagnosed in the chronic phase. With proper disease management and daily tyrosine kinase inhibitor (TKI) therapy, patients in this stage that are responsive to treatment can expect to have a life expectancy approaching that of the average American.
Key to the proper management of CML is sustained adherence to TKIs over the course of a patient’s lifetime. The introduction of the first TKI in 2001 dramatically altered the treatment landscape for the disease, increasing 10-year survival from 32% in 1990 to 70% by 2010 (3). TKIs are orally-administered, targeted therapies that allow the condition to be largely treated in an outpatient setting. This makes CML more easily managed in many respects from the patient perspective but more difficult to monitor from the physician perspective. A decreased ability to monitor patient behavior is important to consider because suboptimal adherence to TKIs (below 80-90% of prescribed doses) has been found to limit treatment effectiveness and is associated with reduced long-term survival rates (4-8). It is estimated that at least 30% of CML patients are non-adherent, even though consistent use of TKIs confers clear improvements in survival (3-6).
Medication adherence, defined as how closely patient behavior corresponds to health care provider treatment recommendations, can be assessed using a variety of methods (9). When the data are indirectly collected, such as with pharmacy claims databases, average measures of either medication possession ratio (MPR) or proportion of days covered (PDC) are most frequently reported (10). While these metrics provide a concise summary measure, they fail to capture the kind of fluctuations in adherence that might have a negative impact on patient prognosis. This distinction is important in the context of CML where, hypothetically, a patient who has stayed consistent at 80% adherence will be less likely to experience treatment failure and resistance than a patient who was initially 100% adherent but then falls to 60% adherence; although their average PDC over the same time period would be exactly the same.
Dynamic measures that account for the time-varying nature of adherence can provide a more nuanced view of patient behavior and are becoming an increasingly popular method for expanding upon single number summaries of medication adherence (11). One such method for deriving these estimates is latent profile analysis (LPA). LPA describes the course of adherence over time for classes of individuals following a similar trajectory (12). This modeling technique is particularly useful for conditions like CML, where even slight non-adherence is associated with reduced clinical outcomes, because it provides insight into which patients are most likely to become non-adherent and at what point in the course of treatment. Information from LPAs can help inform monitoring and intervention strategies for patients identified as likely to be non-adherent. Using this information, targeted interventions could be used to improve patient prognosis and reduce costs to the healthcare system.
The aims of this study are twofold, first to determine whether groups of CML patients with distinct adherence trajectories exist, and, if so, to determine if there are patient characteristics that can be used to predict membership in these groups. To our knowledge, this is the first study using LPA methods to assess determinants of TKI adherence in CML patients.
Methods
Data Sources
This study used data from the Truven Health MarketScan Commercial and Medicare Supplemental Databases (MS) for the time period from January 1, 2007, to December 31, 2017. The MarketScan database contains a convenience sample of claims and encounter data from large employers, managed care organizations, hospitals, electronic medical record (EMR) providers, Medicare and Medicaid. Records include de-identified inpatient medical, outpatient medical, and outpatient pharmacy claims for over 250 million patients (13).
In order to better represent the financial burden imposed by TKIs, data from MarketScan were linked with median income estimates from the 2017-2018 Area Health Resource File (AHRF) (appendix). AHRF is a publicly available dataset that aggregates data on population, healthcare availability, healthcare utilization, economic activity, and socioeconomic and environmental characteristics from more than 50 sources. This linking of medication cost and median income was performed because, although TKIs are one of the more expensive chemotherapies available, evidence on the impact of TKI cost on adherence is mixed (7, 14). TKI cost relative to patient income may be more informative, with the intuition being that for two individuals with the same prescription costs, adherence might be affected more in a lower-income individual for whom this cost represents a larger share of total income.
Study design and population
The study period consisted of the time from the drug index date to the end of 12-months of follow up, with the three months preceding the drug index date serving as the baseline period for covariate measurement. Patients’ drug index date was based on their first claim for any TKI observed in the MarketScan database.
MarketScan enrollees were included if they had two or more diagnoses consistent with International Classification of Diseases, 9th and 10th revision (ICD-9 and ICD-10) CML diagnosis codes (205.1x and C92.1x, respectively) between January 1, 2008 and December 31, 2016. Only individuals over age 18 and under age 65 (to capture the most generalizable MarketScan population) who had at least two prescription fills for one of the available first-line TKIs (imatinib, nilotinib, or dasatinib) were considered eligible. Additionally, participants had to be continuously enrolled in an insurance plan for the duration of the study period. Claims from up to one year prior to the TKI index date were used to confirm that individuals in the sample represented new cases. Exclusion criteria included: treatment discontinuation (defined as a gap of 90 days or more between the last day of medication supply and the end of follow up), inpatient or outpatient claims listing a diagnosis code consistent with any additional indications for imatinib (adapted from Trivedi et al), missing baseline covariate values, and a first CML diagnosis date more than four months after an individual’s TKI index date (Figure 1) (15).
Figure 1:
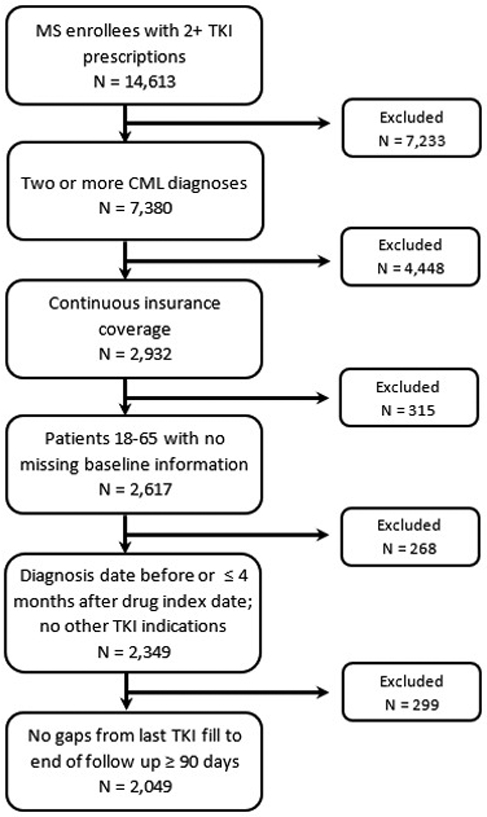
Sample selection flow diagram. MS indicates the MarketScan database.
Covariates
A preliminary search of the literature was conducted to identify demographic, economic, and clinical characteristics previously linked to TKI adherence in CML patients. Sociodemographic covariates were reported as of the TKI index date and included: age, year of diagnosis, health plan type (PPO or other), state, sex, relation to insurance policy holder (employee or spouse/dependent), prescription cost, median income, and financial burden associated with prescription costs. To account for different cost-sharing plans, we created a patient-level prescription cost variable that incorporated both the copayment and coinsurance amount paid for the index TKI. The financial burden of TKI treatment as a share of patient income was estimated by dividing patient-level prescription costs by median income estimates (both standardized per 30-day period) for the corresponding MSA. Missing median income values (n=380) were derived via multiple imputation by chained equations using classification and regression trees (16). Randomness of missing data was assessed by comparing the distribution of baseline characteristics and analysis results for the full sample and for the sample excluding observations with missing MSA data.
In order to control for patients’ initial health status, which may differentially affect adherence, several clinical characteristics were calculated using the 3 months of baseline data. Adjusted Deyo-Charlson comorbidity index score (excluding CML), a measure of relative health based on the presence of up to 17 comorbid conditions, and number of concomitant medications were used to represent patient-level comorbidity and medication burden. Since CML staging information is not typically available in claims data, a proxy value known as the Darkow cancer complexity score was calculated for each patient. This measure uses the presence of diagnoses associated with additional clinical challenges to assign a score representing how difficult a CML patient’s condition will be to manage (“usual”, “moderate”, or “high” complexity) (15, 17). Other clinical factors considered in the analysis were duration of time between CML diagnosis and TKI index date, TKI type, and starting TKI dose (defined as “normal” or “high” based on TKI-specific thresholds from the literature) (18).
Adherence Measurement
The adherence measure used in this analysis was proportion of days covered (PDC). PDC is defined as the number of days supplied of TKIs per 30-day interval during the follow-up period, with maximum adherence capped at 100% (10). PDC was chosen instead of medication possession ratio (MPR) because it provides a more conservative estimate of adherence and has been endorsed by the Pharmacy Quality Alliance/National Quality Forum (10). Individual PDC values calculated for each month of the follow-up served as the longitudinal measures of adherence/outcomes in the study.
One key consideration for the calculation of adherence estimates is how we assume patients behave during gaps in coverage – i.e., is it more likely that they took the medication as prescribed and then completely stopped, or that this gap represents a prolonged period of low adherence? The latter was assumed for this analysis since it is consistent with observed patient behavior and reflects the possibility that patients taking costly medications like TKIs may be more apt to engage in medication rationing (19). This behavior was accounted for in adherence calculations by ‘smoothing’ PDC from periods with prescription coverage across those without (appendix).
PDC estimates per 30-day interval were generated using the AdhereR package in R version 3.4.2 (20).
Statistical Analysis
Latent Profile Analysis
Latent profile analysis (LPA) is a type of finite mixture modeling based on the idea that individuals can be grouped into levels or classes of an unobservable variable according to their response pattern for an observed, continuous indicator over time (21). In this study, it was used to identify distinct patterns of adherence that CML patients fall into according to their longitudinal 30-day PDC trajectories over the follow-up period. These latent classes are assumed to be mutually exclusive and exhaustive, with membership in each group assigned based on the highest posterior probability of belonging to any one class (22).
Since there was no theoretical basis for expecting a specific number of adherence classes, model fitting was conducted using a “forward” classifying approach. This approach represents an iterative process, where models differing by one class are successively run and compared using goodness of fit measures (23). Once the optimal number of classes was identified, the form of these class trajectories was determined by sequentially fitting models incorporating linear, quadratic, and cubic terms. Models with one to eight classes were fit, with a final seven-class model including cubic terms selected for presentation based on the following criteria: lowest BIC, sufficient size per class (>5% of the total sample), and clinical interpretability (appendix).
The LPA was run using the traj command in Stata 15 statistical software.
Multinomial Logistic Regression
The seven adherence classes derived from the LPA model were collapsed into four more clinically relevant categories of “never adherent” (group 1), “initially non-adherent becoming adherent” (group 2), “initially adherent becoming non-adherent” (group 3), and “stable adherent” (groups 4, 5, 6, and 7). Using these groupings, a multinomial logistic regression was run to determine which baseline characteristics were associated with greater probability of membership in either the initially adherent, initially non-adherent, or never adherent groups compared to the reference group (stable adherent). The independence of irrelevant alternatives assumption inherent in multinomial logistic regression was assessed using the Hausman test (appendix). Test results indicated that this assumption was not violated and multinomial logistic regression was an appropriate method.
Relative risk ratios and 95% confidence intervals (CI) are presented for all baseline covariates included in the multinomial logistic regression model. Because relative risk ratios do not provide an easily interpretable measure of the magnitude of the effect of predictors on probability of group membership, marginal effects estimates and 95% confidence intervals (CI) are also reported. These were generated via recycled predictions and the Delta method. The recycled prediction method uses predicted probabilities to estimate average treatment effects for non-linear models (24). Output can be interpreted as the percentage point change in probability of group membership per one-unit change in the independent variable of interest.
Results
Patient Characteristics
Following the application of all inclusion and exclusion criteria, the final sample size for the analysis was 2,049 individuals (Figure 1). Patient characteristics for the overall sample and by LPA class are presented in Table 1. Mean age at TKI index date was 47.9 (standard deviation (SD): 11), with women accounting for 46% of the sample. On average, 87% of patients had usual cancer complexity and were taking 5.9 (SD: 4.2) concomitant medications at baseline. The majority of the sample (93%) started on a normal TKI dosage, with prescription costs representing 3% of patients’ monthly income on average. Over the course of follow-up, 16% of patients switched from their index TKI to another TKI. Average PDC in the sample over the 12-month follow-up period was 87%.
Table 1:
Descriptive Statistics by Adherence Trajectory
| Characteristics | Never adherent | Initially non- adherent becoming adherent |
Initially adherent becoming non-adherent |
Stable adherent | Overall (n=2,049) |
|||
|---|---|---|---|---|---|---|---|---|
| Group 1 (n=145) |
Group 2 (n=214) |
Group 3 (n=181) |
Group 4 (n=285) |
Group 5 (n=204) |
Group 6 (n=598) |
Group 7 (n=422) |
||
| Average 12-month PDC, mean (SD) | 0.40 (0.11) | 0.72 (0.08) | 0.72 (0.10) | 0.95 (0.04) | 1.00 (0.00) | 0.93 (0.05) | 0.97 (0.03) | 0.87 (0.17) |
| Age, mean (SD) | 44.7 (11.8) | 47.1 (10.5) | 45.1 (11.2) | 49.2 (11.1) | 48.6 (11.2) | 47.5 (11) | 50.1 (10.2) | 47.9 (11) |
| Standardized prescription cost, mean (SD) | 125.4 (306.3) | 134 (352.4) | 142 (386.4) | 173.5 (554) | 116.4 (283.2) | 92.3 (241.9) | 158.1 (490.9) | 136.6 (396.1) |
| Median Income, mean (SD) | $5,128 ($1,231) | 5,195 ($1,136) | $5,172 ($1,132) | $5,132 ($1,198) | $5,571 ($1,280) | $5,263 ($1,182) | $5,148 ($1,154) | $5,227 ($1,188) |
| Monthly Financial burden, mean (SD) | 0.03 (0.07) | 0.03 (0.07) | 0.04 (0.14) | 0.02 (0.05) | 0.02 (0.05) | 0.03 (0.08) | 0.03 (0.08) | 0.03 (0.09) |
| Concomitant Medications, mean (SD) | 4.62 (3.64) | 5.53 (4.17) | 5.51 (3.95) | 5.54 (4.03) | 6.25 (4.32) | 6.07 (4.4) | 6.29 (4.14) | 5.85 (4.18) |
| Switched TKI, n (%) | 41 (28%) | 49 (23%) | 42 (23%) | 46 (16%) | 29 (14%) | 78 (13%) | 51 (12%) | 336 (16.40%) |
| Duration, mean (SD) | 101.72 (148.68) | 77.9 (134.1) | 65.2 (115.9) | 73.8 (146.8) | 32.5 (83.9) | 61.3 (128.9) | 38.8 (97.1) | 60.5 (124.4) |
| Female, n (%) | 73 (50%) | 118 (55%) | 92 (51%) | 128 (45%) | 78 (38%) | 269 (45%) | 181 (43%) | 936 (45.70%) |
| Insurance type, n (%) | ||||||||
| Preferred Provider Organization | 102 (70%) | 135 (63%) | 121 (67%) | 188 (66%) | 124 (61%) | 401 (67%) | 245 (58%) | 1,311 (64%) |
| Other | 43 (30%) | 79 (37%) | 60 (33%) | 97 (34%) | 80 (39%) | 197 (33%) | 177 (42%) | 738 (36%) |
| Year of diagnosis, mean (SD) | 2011 (2.18) | 2011 (2.10) | 2011 (2.31) | 2012 (2.23) | 2011 (2.29) | 2011 (2.25) | 2012 (2.21) | 2011 (2.24) |
| Charlson Comorbidity Index, mean (SD) | 1.72 (2.02) | 2.18 (2.18) | 1.57 (1.65) | 2.26 (2.24) | 2.22 (1.95) | 2.15 (2.15) | 2.35 (1.97) | 2.14 (2.07) |
| Darkow Score, n (%) | ||||||||
| Usual | 130 (90%) | 190 (89%) | 157 (87%) | 251 (88%) | 173 (85%) | 518 (87%) | 368 (87%) | 1,787 (87%) |
| Moderate | 12 (8%) | 13 (6%) | 17 (9%) | 22 (8%) | 18 (9%) | 56 (9%) | 36 (9%) | 174 (9%) |
| High | 3 (2%) | 11 (5%) | 7 (4%) | 12 (4%) | 13 (6%) | 24 (4%) | 18 (4%) | 88 (4%) |
| Relationship to policy holder, n (%) | ||||||||
| Employee | 101 (70%) | 146 (68%) | 123 (68%) | 196 (69%) | 141 (69%) | 392 (66%) | 285 (68%) | 1,383 (68%) |
| Spouse or child | 44 (30%) | 68 (32%) | 58 (32%) | 89 (31%) | 63 (31%) | 206 (34%) | 137 (32%) | 666 (32%) |
| TKI type, n (%) | ||||||||
| Imatinib | 80 (55%) | 139 (65%) | 110 (61%) | 160 (56%) | 139 (68%) | 347 (58%) | 245 (58%) | 1,219 (60%) |
| Dasatinib | 28 (19%) | 39 (18%) | 36 (20%) | 91 (32%) | 49 (24%) | 150 (25%) | 101 (24%) | 493 (24%) |
| Nilotinib | 38 (26%) | 36 (17%) | 34 (19%) | 34 (12%) | 16 (8%) | 102 (17%) | 76 (18%) | 337 (16%) |
| Starting Daily Dose level, n (%) | ||||||||
| Normal ‡ | 129 (89%) | 197 (92%) | 157 (87%) | 271 (95%) | 188 (92%) | 562 (94%) | 397 (94%) | 1,906 (93%) |
| High** | 16 (11%) | 17 (8%) | 24 (13%) | 14 (5%) | 16 (8%) | 36 (6%) | 25 (6%) | 143 (7%) |
State-level fixed effects excluded from table
Normal defined as: ≤400mg imatinib, ≤100mg dasatinib, or ≤600mg nilotinib
High defined as: >400mg imatinib, >100mg dasatinib, or >600mg nilotinib
Adherence Trajectories
The LPA identified seven distinct adherence trajectories that were categorized more broadly as exhibiting either never adherent, initially non-adherent becoming adherent, initially adherent becoming non-adherent, or stable adherent behavior (Figure 2). Stability in this case was defined as having no fluctuations in adherence greater than 20% over the follow-up period. The 80% PDC threshold used in the analysis was based on the minimum level of adherence to TKIs in CML patients associated with treatment response at the molecular level (3-6). The majority of individuals in the sample (74%) had the highest probability of falling into the stable adherent group, with 7% classified as never adherent, 10% classified as initially non-adherent becoming adherent, and 9% considered initially adherent becoming non-adherent.
Figure 2:

Mean PDC trajectories within latent profile groups. PDC indicates proportion of days covered. The grey, dashed lines around each trajectoiy represent pointwise 95% confidence intervals per timepoint.
Characteristics of participants by adherence class
Comparing characteristics of individuals falling into each of the four broader groups (Table 1), a few distinct trends emerge. First, for all classes in the stable adherent group, rates of medication switching (≤16% vs ≥23%) and starting TKI dose (≥94% normal vs ≤92% normal) were lower than in any of the three non-stable adherent classes. Patients demonstrating stable adherent behavior also tended to have higher rates of concomitant medication use (≥5.54 vs ≤5.51) and lower financial burden associated with TKI prescription costs (≤0.03 vs ≥0.03). Conversely, patients in the never adherent group represented the youngest cohort (44.7 years; SD:11.8) with the lowest monthly median income ($5,128; SD: $1,231), fewest concomitant medications (4.62; SD: 3.64), and highest proportion of medication switchers (28%). Individuals in the initially adherent becoming non-adherent group had the highest monthly financial burden (0.04; SD: 0.14) and starting daily dose level (11% high). Patient characteristics in the initially non-adherent becoming adherent group were largely similar to those of the other two non-stable adherent groups.
Multinomial Logistic Regression Models Predicting Adherence Trajectory Membership
Results from the multinomial logistic regression adjusting for all model covariates (Table 2) and corresponding marginal effects estimates (Table 3) indicate that patients were significantly more likely to be classified as never adherent if they were younger (0.1 percentage point decrease in probability of group membership per additional year of age), female (1.7 percentage point increase in probability of group membership), had an earlier year of diagnosis (1.0 percentage point decrease in probability of group membership per additional year from 2008), had a longer duration from CML diagnosis to TKI prescription (0.3 percentage point increase in probability of group membership per additional 30-day interval), were taking a non-imatinib TKI (1.1% increase in group membership for dasatinib and 6.4% increase in probability of group membership for nilotinib), and were prescribed fewer concomitant medications (0.4 percentage point decrease in probability of group membership per additional medication). Younger (0.1 percentage point decrease in probability of group membership per additional year of age), female (4.5 percentage point increase in probability of group membership) patients with a higher duration from diagnosis to TKI prescription (0.3 percentage point increase in probability of group membership per additional 30-day interval) had a significantly greater chance of being considered initially non-adherent becoming adherent. Membership in the group exhibiting initial adherence that decreased over time were significantly more likely to be younger (0.1 percentage point decrease in probability of group membership per additional year of age), female (2.1 percentage point increase in probability of group membership), have a higher monthly financial burden (12 percentage point increase in probability of group membership), have a high starting daily TKI dose (6.1 percentage point increase in probability of group membership), and have a lower Charlson comorbidity score (1.1 percentage point decrease in probability of group membership per one-unit increase in score).
Table 2:
Multinomial Logistic Regression Model Predicting Broader Adherence Groups
| Characteristics | Never adherent (n=145) |
Initially non-adherent becoming adherent (n=214) |
Initially adherent becoming non-adherent (n=181) |
|||
|---|---|---|---|---|---|---|
| RRR (95% CI) | P-value | RRR (95% CI) | P-value | RRR (95% CI) | P-value | |
| Age | 0.97 (0.96, 0.99) | <0.01 | 0.98 (0.97, 0.99) | 0.03 | 0.98 (0.96, 0.99) | 0.01 |
| Monthly Financial burden | 1.29 (0.18, 9.23) | 0.80 | 0.78 (0.15, 4.00) | 0.77 | 4.75 (1.03, 21.9) | 0.04 |
| Concomitant Medications | 0.93 (0.88, 0.98) | 0.01 | 0.97 (0.93, 1.01) | 0.15 | 1.00 (0.96, 1.04) | 0.97 |
| Duration (per month) | 1.06 (1.02, 1.09) | <0.01 | 1.04 (1.00, 1.07) | 0.02 | 1.01 (0.98, 1.05) | 0.44 |
| Charlson Comorbidity Index | 0.98 (0.88, 1.10) | 0.73 | 1.05 (0.97, 1.14) | 0.22 | 0.88 (0.79, 0.98) | 0.02 |
| Female | 1.49 (1.03, 2.16) | 0.04 | 1.77 (1.30, 2.41) | <0.01 | 1.46 (1.05, 2.02) | 0.02 |
| Insurance Type | 1.13 (0.76, 1.69) | 0.55 | 0.92 (0.67, 1.26) | 0.60 | 1.05 (0.76, 1.48) | 0.73 |
| Darkow Score (reference category = usual) | 0.21 | 0.62 | 0.80 | |||
| Moderate | 0.80 (0.41, 1.54) | 0.63 (0.34, 1.18) | 1.02 (0.57, 1.85) | |||
| High | 0.40 (0.12, 1.32) | 0.88 (0.43, 1.81) | 0.77 (0.31, 1.94) | |||
| Year of diagnosis | 0.84 (0.76, 0.93) | <0.01 | 0.96 (0.89, 1.03) | 0.29 | 0.95 (0.87, 1.03) | 0.23 |
| Relationship of patient to policy holder (reference category = employee) | 0.80 (0.53, 1.20) | 0.29 | 0.86 (0.63, 1.19) | 0.36 | 0.88 (0.62, 1.25) | 0.47 |
| TKI type (reference category = imatinib) | <0.01 | 0.87 | 0.44 | |||
| Dasatinib | 1.11 (0.65, 1.90) | 0.64 (0.41, 0.99) | 0.69 (0.44, 1.07) | |||
| Nilotinib | 2.51 (1.49, 4.22) | 1.08 (0.69, 1.70) | 1.18 (0.74, 1.90) | |||
| Starting Daily Dose level (reference category = normal) | 1.76 (0.90, 3.46) | 0.10 | 1.75 (1.00, 3.08) | 0.05 | 2.47 (1.44, 4.24) | <0.01 |
State-level fixed effects excluded from table
Multinomial logistic regression model was run comparing the “Never adherent,” “Initially non-adherent becoming adherent” and “Initially adherent becoming non-adherent” groups to the “Stable Adherent” group
Sample size in the “Stable Adherent” was n=1,509
OR indicates odds ratio; CI, confidence interval
All estimates rounded to two decimal places
Table 3:
Marginal effects estimates
| Characteristics | Never adherent (n=145) |
Initial low PDC increasing to adherence (n=214) |
Initial adherence decreasing over time (n=181) |
Stable adherent (n=1,509) |
|---|---|---|---|---|
| Marginal effect (95% CI) | Marginal effect (95% CI) |
Marginal effect (95% CI) |
Marginal effect (95% CI) |
|
| Age | −0.001 (−0.002, <−0.001) | −0.001 (−0.003, <−0.001) | −0.001 (−0.002, <−0.001) | 0.004 (−0.002, 0.006) |
| Monthly Financial burden | 0.006 (−0.110, 0.123) | −0.039 (−0.185, 0.106) | 0.120 (0.005, 0.237) | −0.088 (−0.282, 0.105) |
| Concomitant Medications | −0.004 (−0.008, <−0.001) | −0.002 (−0.006, 0.002) | <0.001 (−0.003, 0.004) | 0.006 (<−0.001, 0.011) |
| Duration (per month) | 0.003 (0.001, 0.005) | 0.003 (<0.001, 0.006) | <0.001 (−0.002, 0.003) | −0.006 (−0.010, −0.002) |
| Charlson Comorbidity Index | −0.001 (−0.007, 0.006) | 0.006 (−0.001, 0.014) | −0.011 (−0.019, −0.002) | 0.005 (−0.006, 0.016) |
| Female | 0.017 (−0.006, 0.039) | 0.045 (0.017, 0.072) | 0.021 (−0.004, 0.046) | −0.082 (−0.120, 0.044) |
| Insurance Type | 0.008 (−0.016, 0.031) | −0.009 (−0.037, 0.019) | 0.004 (−0.021, 0.030) | −0.003 (−0.043, 0.037) |
| Darkow Score (reference category = usual) | ||||
| Moderate | −0.010 (−0.046, 0.026) | −0.035 (−0.076, 0.007) | 0.008 (−0.041, 0.056) | 0.037 (−0.028, 0.103) |
| High | −0.040 (−0.078, 0.001) | −0.003 (−0.067, 0.061) | −0.013 (−0.074, 0.048) | 0.056 (−0.031, 0.143) |
| Year of diagnosis | −0.010 (−0.016, −0.004) | −0.002 (−0.008, 0.005) | −0.002 (−0.009, 0.004) | 0.014 (0.004, 0.023) |
| Relationship of patient to policy holder (reference category = employee) | −0.011 (−0.035, 0.013) | −0.010 (−0.039, 0.018) | −0.007 (−0.034, 0.020) | 0.028 (−0.012, 0.069) |
| TKI type (reference category = imatinib) | ||||
| Dasatinib | 0.011 (−0.019, 0.042) | −0.035 (−0.068, −0.002) | −0.024 (−0.054, 0.006) | 0.048 (<−0.001, 0.096) |
| Nilotinib | 0.064 (0.022, 0.106) | −0.004 (−0.047, 0.038) | 0.005 (−0.034, 0.044) | −0.064 (−0.124, −0.005) |
| Starting Daily Dose level (reference category = normal) | 0.023 (−0.017, 0.063) | 0.037 (−0.012, 0.087) | 0.061 (0.019, 0.102) | −0.121 (−0.190, −0.052) |
State-level fixed effects excluded from table
Marginal effects were derived from results presented in Table 2, are estimated at the mean value for each independent variable and represent the percentage point change in probability of group membership related to a one-unit increase in the covariate of interest.
All estimates rounded to three decimal places
Discussion
In this study, a latent profile analysis was conducted in patients with newly diagnosed CML to identify distinct patterns of TKI adherence trajectories and evaluate characteristics of individuals who were most likely to follow each pattern. Our results suggest that patients tend to fall into four broad groups: stable adherent, never adherent, initially non-adherent becoming adherent, or initially adherent becoming non-adherent.
Age was found to be a significant predictor of membership across all four groups, which is consistent with prior studies that have identified a link between younger age and lower adherence (5,25). This relationship could also be a function of other significant predictors of non-adherence (e.g., fewer comorbidities and concomitant medications) since younger individuals tend to be healthier and may therefore be less accustomed to managing chronic disease. Overall, men and individuals with a shorter duration from diagnosis to initial prescription fill were more likely to be classified as stable adherent, which also corresponds to previous findings (5,15). A higher financial burden imposed by TKI prescription costs was significantly associated with membership in the initially adherent becoming non-adherent group. This result could be explained if patients are able to draw down on other sources of income (e.g., savings, borrowing) to absorb high TKI costs in the short term but not for a prolonged period of time. Other characteristics significantly related to broader adherence group membership, aside from financial burden, are consistent with those identified in previous studies (25).
The 12-month average PDC was 87% for all CML patients included in the sample, with 78% and 64% of patients having average PDCs over 80% and 90%, respectively. This suggeststhat adherence is generally high in the first year of TKI treatment and falls within the 80-90% average level associated with treatment response (3-6). This study highlights the important context that LPA based on longitudinal trajectories can provide to that single summary measure by identifying subgroups for whom monthly PDC fluctuates around or stays below the minimum 80% adherence level over time and who would be expected to have suboptimal outcomes.
These results have major implications for clinical practice and policy. Predictors of non-adherence can be used to inform targeted monitoring of individuals who are more likely to be non-adherent. Depending on which adherence group the individual is most likely to belong to, our results can also guide the timing of interventions by identifying periods when certain groups of individuals are most likely to be non-adherent. For example, individuals in group 3 were adherent for the first months of follow-up and then became non-adherent, with the reverse being true for individuals in group 2. If such medication adherence information were available in (near) real time for prescribers, it could help them personalize the monitoring of patients. For example, patients with characteristics similar to those in the “initially non-adherent becoming adherent” group could benefit from monitoring closely from TKI initiation, and patients with characteristics similar to those in the “initially adherent becoming non-adherent” group could benefit from monitoring more closely around 6 months from their TKI index date.
There are several potential limitations to this study. The data used came from a large administrative claims database primarily including information on employer-based/private insurance, which could lead to selection bias in who was sampled for the study. This is particularly important regarding the relationship between financial burden and longitudinal adherence, as it is likely that this effect is more acute in patients without insurance. Use of a claims database also restricted the variables available for inclusion in the analysis, and it is possible that the omission of variables not found in MarketScan, such as patient knowledge and beliefs regarding adherence, could have led to biased results. Generalizability was affected by restricting the sample to CML patients under 65 since over half of cases are estimated to occur over this age (26). This could also be a source of selection bias given that younger patients tend to have lower adherence than the general CML population (27). That said, we found that 26% of our sample fell into one of the non-stable adherent groups, which is consistent with previous studies that found 30% of the general CML population to be non-adherent (8-10). Selection bias may have also been introduced into the sample due to continuous insurance coverage requirements. Application of this inclusion criterion led to a reduction of over 50% of the sample (Figure 1), and individuals with less secure insurance coverage may have different adherence to expensive drugs like TKIs; however, we did not find any systematic difference in baseline covariate values between the two groups. Reliance on pharmacy fill records for plans available in MarketScan also means that individuals who have separate prescription coverage would not have been included in the analysis. Additionally, a broad measure of patient income representing the median value for a large geographical area (MSA) was used. Although the lack of granularity in these income estimates means that patient-level variation in income (and subsequently financial burden) within MSAs was not captured, ours is the first study to show the impact of even a broad measure of financial burden on TKI adherence in CML patients. These results provide motivation for future work to investigate financial burden in greater detail.
The chronic nature of CML means that important aspects of long-term adherence trajectories may have been missed due to the limited 12-month follow-up period used in this analysis. Further research examining longer-term patterns and determinants of TKI adherence is needed since these patterns have been shown to differ over time (28). Analyzing patients with complete 12-month follow-up and excluding those who died or were lost to follow-up also potentially introduces sample bias. Additionally, given the small sample sizes in the non-stable adherent groups (all have n < 215), it’s also possible that this study was not sufficiently powered to detect some clinically meaningful differences in characteristics between groups.
There were three approved first-line TKIs available during the study period: imatinib, dasatinib, and nilotinib. We did not analyze these TKIs separately due to their shared mechanism of action and concerns regarding the resulting reduction in sample size. Given their different side effect profiles and costs, adherence trajectories for these therapies may vary, particularly amongst medication switchers (14). The higher rates of switching among the non-stable adherent classes indicates that this may have also contributed to some of the observed fluctuations in adherence. Exploration of differential adherence by TKI type and sequencing, along with consideration of other time-varying patient characteristics, such as change in comorbid conditions, are important areas of potential future research.
To our knowledge, this is the first study of TKI adherence in newly diagnosed CML patients using latent profile analysis. Dynamic measures based on these methods are becoming more frequently applied in adherence studies since relying solely on overall measures such as average PDC can cause providers to miss important variation and differences within patient groups over time (14-16). This study supports the use of such metrics, as our latent profile analysis revealed non-adherent groups of individuals who could benefit from targeted interventions and who would not have been identified using the conventional average PDC measure.
Supplementary Material
Acknowledgments
Research support: This research was supported by the National Cancer Institute of the National Institutes of Health (NIH) under grants T32-CA009168 and R37-CA218413. Its contents are solely the responsibility of the authors and do not necessarily represent the official views of the NCI or NIH.
References
- 1.Houshmand M, Simonetti G, Circosta P, et al. Chronic myeloid leukemia stem cells. Leukemia. 2019;33:1543–1556. [DOI] [PMC free article] [PubMed] [Google Scholar]
- 2.Noone AM, Howlader N, Cronin KA, et al. SEER Cancer Statistics Review, 1975-2015. National Cancer Institute. https://seer.cancer.gov/csr/1975_2015/ (2017, accessed 10 October 2019). [Google Scholar]
- 3.Jabbour E, Kantarjian H. Chronic myeloid leukemia: 2018 update on diagnosis, therapy and monitoring. American Journal of Hematology. 2018;93(3):442–59. [DOI] [PubMed] [Google Scholar]
- 4.de Almeida MH, Fogliatto L, Couto D. Importance of adherence to BCR-ABL tyrosine-kinase inhibitors in the treatment of chronic myeloid leukemia. Rev Bras Hematol Hemoter. 2014;36(1):54–9. [DOI] [PMC free article] [PubMed] [Google Scholar]
- 5.Noens L, Lierde M-A van Bock RD, Verhoef G, Zachée P, Berneman Z, et al. Prevalence, determinants, and outcomes of nonadherence to imatinib therapy in patients with chronic myeloid leukemia: the ADAGIO study. Blood. 2009;113(22):5401–11. [DOI] [PubMed] [Google Scholar]
- 6.Marin D, Bazeos A, Mahon F-X, Eliasson L, Milojkovic D, Bua M, et al. Adherence Is the Critical Factor for Achieving Molecular Responses in Patients With Chronic Myeloid Leukemia Who Achieve Complete Cytogenetic Responses on Imatinib. JCO. 2010. Apr 12;28(14):2381–8. [DOI] [PMC free article] [PubMed] [Google Scholar]
- 7.Wu EQ, Guerin A, Yu AP, Bollu VK, Guo A, Griffin JD. Retrospective real-world comparison of medical visits, costs, and adherence between nilotinib and dasatinib in chronic myeloid leukemia. Current Medical Research and Opinion. 2010;26(12):2861–9. [DOI] [PubMed] [Google Scholar]
- 8.Shen C, Zhao B, Liu L, Shih Y-CT. Adherence to tyrosine kinase inhibitors among Medicare Part D beneficiaries with chronic myeloid leukemia. Cancer. 2018;124(2):364–73. [DOI] [PMC free article] [PubMed] [Google Scholar]
- 9.World Health Organization. Adherence to long-term therapies: evidence for action. https://www.who.int/chp/knowledge/publications/adherence_full_report.pdf?ua=1 (2003, accessed 23 October 2019).
- 10.Zullig LL, Mendys P, Bosworth HB. Medication Adherence: A Practical Measurement Selection Guide Using Case Studies. Patient Educ Couns. 2017;100(7):1410–4. [DOI] [PMC free article] [PubMed] [Google Scholar]
- 11.Marcum ZA, Walker RL, Jones BL, Ramaprasan A, Gray SL, Dublin S, et al. Patterns of antihypertensive and statin adherence prior to dementia: findings from the adult changes in thought study. BMC Geriatr. 2019;19. [DOI] [PMC free article] [PubMed] [Google Scholar]
- 12.Nagin DS, Odgers CL. Group-Based Trajectory Modeling in Clinical Research. Annual Review of Clinical Psychology. 2010;6(1):109–38. [DOI] [PubMed] [Google Scholar]
- 13.IBM Watson Health. Truven Health Analytics: Comparative Effectiveness Research: Research and Analytics. available at: https://truvenhealth.com/Portals/0/Assets/2017-MarketScan-Databases-Life-Sciences-Researchers-WP.pdf. (2017, accessed 23 October 2019). [Google Scholar]
- 14.Dusetzina SB, Winn AN, Abel GA, Huskamp HA, Keating NL. Cost Sharing and Adherence to Tyrosine Kinase Inhibitors for Patients with Chronic Myeloid Leukemia. JCO. 2013. Dec 23;32(4):306–11. [DOI] [PubMed] [Google Scholar]
- 15.Trivedi D. Adherence and Persistence Among Chronic Myeloid Leukemia Patients During Second-Line Tyrosine Kinase Inhibitor Treatment. J Manag Care Spec Pharm. 2014. Oct;20(10):1006–15. [DOI] [PMC free article] [PubMed] [Google Scholar]
- 16.Van Buuren S Flexible Imputation of Missing Data. 2018. Second Edition. Chapman & Hall/CRC. Boca Raton, FL. [Google Scholar]
- 17.Darkow T, Henk HJ, Thomas SK, Feng W, Baladi J-F, Goldberg GA, et al. Treatment Interruptions and Non-Adherence with Imatinib and Associated Healthcare Costs. Pharmacoeconomics. 2007. Jun 1;25(6):481–96. [DOI] [PubMed] [Google Scholar]
- 18.Latremouille-Viau D, Guerin A, Gagnon-Sanschagrin P, Dea K, Cohen BG, Joseph GJ. Health Care Resource Utilization and Costs in Patients with Chronic Myeloid Leukemia with Better Adherence to Tyrosine Kinase Inhibitors and Increased Molecular Monitoring Frequency. J Manag Care Spec Pharm. 2017. Feb;23(2):214–24. [DOI] [PMC free article] [PubMed] [Google Scholar]
- 19.Cohen RA. Strategies Used by Adults Aged 18–64 to Reduce Their Prescription Drug Costs, 2017. 2019;(333):8. [PubMed] [Google Scholar]
- 20.Dima AL, Dediu D. Computation of adherence to medication and visualization of medication histories in R with AdhereR: Towards transparent and reproducible use of electronic healthcare data. PLoS One [Internet]. 2017. Apr 26 [cited 2019 Mar 30];12(4). Available from: https://www.ncbi.nlm.nih.gov/pmc/articles/PMC5405929/ [DOI] [PMC free article] [PubMed] [Google Scholar]
- 21.Porcu M, Giambona F. Introduction to Latent Class Analysis With Applications. The Journal of Early Adolescence. 2017. Jan;37(1):129–58. [Google Scholar]
- 22.Lanza ST, Rhoades BL. Latent Class Analysis: An Alternative Perspective on Subgroup Analysis in Prevention and Treatment. Prev Sci. 2013. Apr;14(2):157–68. [DOI] [PMC free article] [PubMed] [Google Scholar]
- 23.Schreiber JB. Latent Class Analysis: An example for reporting results. Research in Social and Administrative Pharmacy. 2017. Nov 1;13(6):1196–201. [DOI] [PubMed] [Google Scholar]
- 24.Muller CJ, MacLehose RF. Estimating predicted probabilities from logistic regression: different methods correspond to different target populations. Int J Epidemiol. 2014. Jun;43(3):962–70. [DOI] [PMC free article] [PubMed] [Google Scholar]
- 25.Gater A, Heron L, Abetz-Webb L, Coombs J, Simmons J, Guilhot F, et al. Adherence to oral tyrosine kinase inhibitor therapies in chronic myeloid leukemia. Leukemia Research. 2012. Jul 1;36(7):817–25. [DOI] [PubMed] [Google Scholar]
- 26.Chronic Myeloid Leukemia - Cancer Stat Facts [Internet]. SEER. [cited 2019 Mar 16]. Available from: https://seer.cancer.gov/statfacts/html/cmyl.html [Google Scholar]
- 27.Tsai Y-F, Huang W-C, Cho S-F, Hsiao H-H, Liu Y-C, Lin S-F, et al. Side effects and medication adherence of tyrosine kinase inhibitors for patients with chronic myeloid leukemia in Taiwan. Medicine. 2018. Jun;97(26):e11322. [DOI] [PMC free article] [PubMed] [Google Scholar]
- 28.Rychter A, Jerzmanowski P, Hołub A, Specht-Szwoch Z, Kalinowska V, Tęgowska U, et al. Treatment adherence in chronic myeloid leukaemia patients receiving tyrosine kinase inhibitors. Med Oncol [Internet]. 2017. [cited 2019 Apr 7];34(6). Available from: https://www.ncbi.nlm.nih.gov/pmc/articles/PMC5405100/ [DOI] [PMC free article] [PubMed] [Google Scholar]
- 29.Franklin JM, Shrank WH, Pakes J, Sanfélix-Gimeno G, Matlin OS, Brennan TA, et al. Group-based Trajectory Models: A New Approach to Classifying and Predicting Long-Term Medication Adherence. Medical Care. 2013. Sep;51(9):789–96. [DOI] [PubMed] [Google Scholar]
- 30.Shafrin J, Ganguli A, Gonzalez YS, Shim JJ, Seabury SA. Geographic Variation in the Quality and Cost of Care for Patients with Rheumatoid Arthritis. JMCP. 2016. Nov 24;22(12):1472–81. [DOI] [PMC free article] [PubMed] [Google Scholar]
Associated Data
This section collects any data citations, data availability statements, or supplementary materials included in this article.