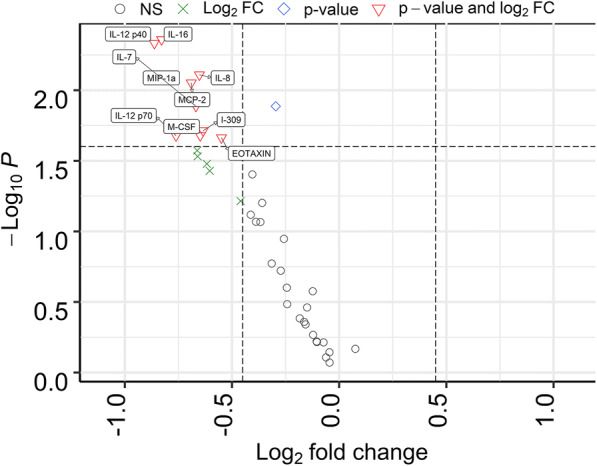
Fig. 4.

Differentially abundant cytokines/chemokines in volcano plot. The cytokines displaying quantitative differences with statistical significance are depicted in red triangles. Non-significant proteins are shown in black circles, and proteins not meeting either p value or log2 FC cutoffs are depicted as green crosses and blue diamonds, respectively. The p value threshold is 0.05. A log FC cutoff of 0.45 was used to generate the plot
