

Abstract
Polycystic kidney diseases (PKDs) comprise the most common Mendelian forms of renal disease. It is characterised by the development of fluid-filled renal cysts, causing progressive loss of kidney function, culminating in the need for renal replacement therapy or kidney transplant. Ireland represents a valuable region for the genetic study of PKD, as family sizes are traditionally large and the population relatively homogenous. Studying a cohort of 169 patients, we describe the genetic landscape of PKD in Ireland for the first time, compare the clinical features of patients with and without a molecular diagnosis and correlate disease severity with autosomal dominant pathogenic variant type. Using a combination of molecular genetic tools, including targeted next-generation sequencing, we report diagnostic rates of 71–83% in Irish PKD patients, depending on which variant classification guidelines are used (ACMG or Mayo clinic respectively). We have catalogued a spectrum of Irish autosomal dominant PKD pathogenic variants including 36 novel variants. We illustrate how apparently unrelated individuals carrying the same autosomal dominant pathogenic variant are highly likely to have inherited that variant from a common ancestor. We highlight issues surrounding the implementation of the ACMG guidelines for variant pathogenicity interpretation in PKD, which have important implications for clinical genetics.
Subject terms: Polycystic kidney disease, Disease genetics, Next-generation sequencing, Genetics research, Genetic testing
Introduction
Polycystic kidney diseases (PKDs) are the most common forms of the inherited renal disease affecting an estimated 12.5 million individuals worldwide [1]. PKD is a leading cause of end-stage kidney disease (ESKD) and the prevalence of PKD related ESKD in Europe ranges from 30 per million population (pmp) in Switzerland to greater than 180 pmp in regions of Spain [2]. In Northern Ireland the prevalence of ESKD due to PKD is reported as 115 pmp [2].
PKD can be autosomal dominant, autosomal recessive (ADPKD and ARPKD) or syndromic and can manifest prior to birth on prenatal ultrasound or as late as the eighth decade of life. Most ADPKD patients (85%) reach ESKD by age 65 years [3]. Approximately 90% of ADPKD cases have an identifiable pathogenic genetic variant in PKD1 or PKD2; leaving ~10% with an unknown genetic cause [4]. PKD1 and PKD2 account for around 80–85% and 15–20% of cases with a molecular diagnosis, respectively [5–10]. Copy number changes in the form of insertions and deletions over 1 kb in size [11] within PKD1 and PKD2 are responsible for 1–5% of cases [5, 8, 12, 13]. Additional genes account for rarer forms of ADPKD (<1% of cases with a molecular diagnosis), including GANAB, ALG9 and DNAJB11 which often have atypical ADPKD presentations [4, 10, 14]. Recessive forms of PKD are more rare and are known to be caused by autosomal recessive (AR) pathogenic variants in genes including PKHD1 [15].
Previous work has demonstrated that the disease gene and autosomal dominant (AD) pathogenic variant type have a significant effect on the age at which patients reach ESKD [16, 17]. Patients with PKD1 AD pathogenic variants tend to have an earlier age at ESKD relative to those with AD pathogenic variants in PKD2. Further, PKD1 truncating AD pathogenic variants are associated with reduced renal survival when compared with PKD1 non-truncating variants. PKD2 truncating variants have been associated with lower age-adjusted eGFR [18].
PKD1 has a high GC-content and lies within a segmentally duplicated part of the genome with six pseudogenes, making it challenging to the sequence. The current gold-standard method for PKD1 variant screening is long-range PCR (LR-PCR) combined with nested PCR, followed by Sanger sequencing, a process which is resource intensive [19]. Hybridisation-based exome library preparation, combined with high-coverage NGS has recently been proposed as an alternative for PKD diagnostic testing, including for PKD1 [19–22]. The American College of Medical Genetics (ACMG) have published guidelines to aid in pathogenicity classification of variants [23], but uptake by the PKD research community has been relatively poor, where alternative, research guidelines such as those developed by the Mayo Clinic are more commonly used [24].
The spectrum of variants causing PKD in the Irish population has yet to be described. As family sizes are traditionally large in Ireland and the population relatively homogenous [25, 26], Ireland represents a valuable region for the genetic study of PKD. Here we set out to (1) describe the pathogenic PKD variants in the Irish population, using a combination of molecular genetic approaches including NGS, (2) test the association between renal survival and PKD AD pathogenic variant type and (3) compare the ACMG guidelines to standard PKD pathogenicity criteria in order to establish the feasibility of these guidelines in PKD clinical genetics.
Materials and methods
Ethics
Written, informed consent was obtained from all participants of this study. Ethical approval was provided from the Ethics committee of Beaumont Hospital, Dublin, Ireland (REC 12/75).
Recruitment centres and inclusion/exclusion criteria
One hundred and sixty-nine patients (from 148 families) were recruited from four renal clinics and dialysis units in Ireland (Beaumont Hospital Dublin, The Mid-Western Regional Hospital Limerick, Galway University Hospitals and Tallaght University Hospital). Patients were included if they were:
-
•
Aged >18 years,
-
•
Able to provide informed consent,
-
•
Did not have a previous genetic diagnosis of PKD (i.e. causal AR/AD pathogenic variant was unknown),
AND
-
•
Had a family history of PKD defined by the presence of a second-degree relative or closer, with the disease, at the time of recruitment to the study,
-
•
Met the unified criteria for ultrasonography diagnosis of ADPKD [27],
OR
-
•
Had no family history of PKD but evidence of >5 cysts on ultrasound examination and no evidence of an alternate cystic kidney disease.
NGS data generation
NGS was performed on 155 samples using a custom targeted panel (Roche SeqCap EZ Choice) of 227 known renal disease genes (99.9% of target bases covered, gene list previously published [28]) on an Illumina Platform (MiSeq or NextSeq). Fourteen samples were sequenced using an alternative panel covering 11 genes (Roche HeatSeq gene list provided in Supplementary Table 1). Bioinformatic analyses were conducted using a GATK Best Practices based pipeline [29]. All variants discussed in this manuscript have been submitted to ClinVar (see Supplementary Table 3) and requests for access to raw sequence data can be made via communication with the corresponding author.
Variant pathogenicity
Candidate AD and AR pathogenic variants were identified as those that were: (1) in established renal disease genes, (2) within exonic and splicing regions (3) predicted damaging by either PolyPhen [30] or SIFT [31] and (4) with a minor allele frequency (MAF) (as per gnomAD [32]) of <1% for homozygotes or compound heterozygotes and <0.1% for heterozygotes. Synonymous variants were excluded. In order to assess if a variant had been previously reported as pathogenic, we accessed ClinVar (clinvar_20140902) (www.ncbi.nlm.nih.gov/clinvar), OMIM (www.omim.org) and the Mayo Clinic PKD database (https://pkdb.mayo.edu/index.html). Qualifying variants were brought forward for discussion at a multidisciplinary team (MDT) meeting (see below).
Sanger sequencing
Patients without candidate AD or AR pathogenic variants following NGS (see above) were further sequenced for PKD1 and PKD2, using LR-PCR and/or nested PCR, followed by Sanger sequencing as described previously [8, 24] (Fig. 1).
Fig. 1. Detection rates of molecular causes of PKD.
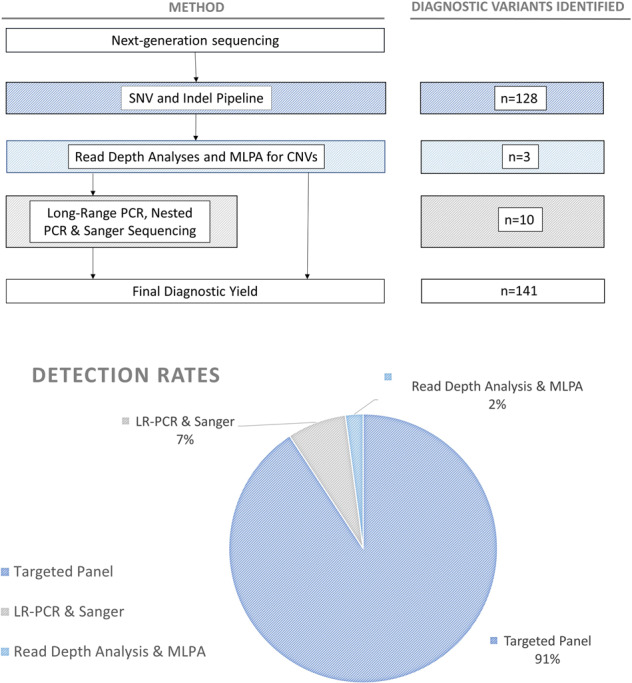
Flow chart (above) describes the methodological workflow for the project alongside the number of AR and AD pathogenic variants identified at each stage. Chart (below) shows the rates of detection of pathogenic variants for each of the methods used. Variants displayed here were classified using Mayo Clinic pathogenicity guidelines.
Copy number variants
Copy-number variants (CNVs) were detected using read-depth analysis from NGS data using both Nexus BioDiscovery (https://www.biodiscovery.com/products/Nexus-Copy-Number) and the BROAD’s GATK4 GermlineCNVCaller [29]. CNVs in key PKD genes (PKD1, PKD2, PKHD1, DZIP1L, GANAB) detected using either of these read depth detection methods were confirmed using multiplex ligation-dependent probe amplification (MLPA) as described previously [13].
Multidisciplinary team meeting (MDT)
With input from nephrologists and geneticists, the clinical picture was reviewed at the MDT with reference to the candidate pathogenic variant, to help establish pathogenicity. Candidate pathogenic variants were assessed using both the PKD variant pathogenicity guidelines from the Mayo Clinic [7, 8] and the ACMG guidelines [23]. Variants classified as ‘Definitely Pathogenic’, ‘Highly Likely Pathogenic’ and ‘Likely Pathogenic’ using guidelines from the Mayo Clinic were considered disease causing. Guidelines from the Mayo Clinic are described in detail in the Supplementary Information. Further details of how we interpreted the ACMG guidelines are provided in Supplementary Table 2. Where a candidate AD or AR pathogenic variant did not clearly match the clinical phenotype of the case, the variant was labelled as a variant of unknown significance (VUS).
Frequency in Irish traveller population
The frequency of PKD variants in the Irish Traveller population was determined using sequence data from 16 individuals. These data were processed using the SNV pipeline used for the PKD sequences described above, limited to the key PKD genes (PKD1, PKD2, GANAB, PKHD1, DZIP1L and DNAJB11).
Survival analysis
Renal survival analyses were conducted in order to calculate the correlation between AD pathogenic variant (gene and variant type) and renal survival (time to ESKD measured in years). Variants were divided into two groups: truncating (stop gain, frameshift indels, CNVs, splicing) or non-truncating (missense, non-frameshift indels). Kaplan–Meier methods were used for these analyses as indicated on SPSS v25 and v26 (SPSS, Inc., NY). Differences between the tested groups were assessed using the log-rank test (0.05 significance level).
Haplotype analysis
Patients who shared the same diagnostic PKD variants with no established familial connection (i.e. pedigree analysis did not indicate a common ancestor) were genotyped using the Illumina Infinium OmniExpress microarray kit. These patients were co-analysed with microarray genotypes from previously obtained control individuals of Irish ancestry from the Irish DNA Atlas cohort [33] (n = 198) and a Trinity College student cohort [34] (n = 2232). Genotypes were merged using PLINK v1.90b6.9 [35, 36] and the following quality control filtering was applied; individuals were removed if genotype missingness >5%, and variants were removed if genotyping missingness >5%, or MAF <2%, or deviation from the Hardy–Weinberg equilibrium with a significance <1 × 10⁻⁶. Irish ancestry of cases was confirmed using PCA analysis in PLINK. Chromosomes were phased using Beagle v5.0 [37]. Identity-by-descent (IBD) segments with a length ≥ 1 cM and log-odds score ≥ 3 were detected in the merged, phased dataset using the refinedIBD model [38]. IBD segments were filtered for those shared between carriers of the same pathogenic PKD variant and overlapping the human genome build 37 coordinates of PKD1/PKD2 (chr16:2138711–2185899, chr4:88928799–88998931, respectively). To describe the potential relationships between individuals with the same diagnostic PKD variants, using the genotype data described above, we quantified genetic relationships by estimating a combination of identity by state (IBS) and IBD using KING v2.2 [39]. The --related command in KING was used to quantifying relationships closer than the 5th degree.
Results
Recruitment
A total of 169 PKD patients from 148 families satisfied our inclusion criteria and were processed for genetic analysis (Table 1). The mean age of diagnosis for the 169 patients was 36 years and median age of diagnosis was 35 years (range 4–79 years), 84 (50%) were male and 97 (57%) had reached ESKD at the time of recruitment. Seventy-three (43%) patients had a functioning renal transplant, 131 (78%) had a family history of PKD.
Table 1.
Baseline characteristics of patients with polycystic kidney disease in whom disease-causing variants were and were not detected.
| All Patients (n = 169) (%) | Solved (n = 141) (%) | Unsolved (n = 28) (%) | Sig. (two-tailed) | 95% Confidence interval | ||
|---|---|---|---|---|---|---|
| Lower | Upper | |||||
| Mean age at diagnosis (range) | 36 (4–79) | 34 (4–66) | 45 (16–79) | 0.003 | −16.804 | −3.47 |
| Male sex | 84 (50%) | 67 (48%) | 17 (61%) | 0.204 | −3.364 | 0.725 |
| Documented family history | 131 (78%) | 112 (79%) | 19 (68%) | 0.137 | −0.409 | 0.295 |
| Known liver cysts | 85 (50%) | 74 (52%) | 11 (39%) | 0.278 | −0.102 | 0.353 |
| Known aneurym | 16 (9%) | 14 (10%) | 2 (7%) | 0.035 | −0.968 | 0.167 |
| Reached ESRD | 114 (67%) | 96 (68%) | 18 (64%) | 0.66 | −0.149 | 0.235 |
| Mean age at ESRD (range) | 50 (21–84) | 49 (21–75) | 54 (25–84) | 0.156 | −9.909 | 1.61 |
| Documented Hypertension | 138 (82%) | 119 (84%) | 19 (68%) | 0.093 | −0.223 | 0.285 |
Comparison of the means between the groups with and without a molecular diagnosis are shown (t-test, assuming unequal variances, p-value for mean age at ESKD between solved and unsolved cases from Kaplan–Meier Log Rank (Mantel-Cox) test was p = 0.063). Variants displayed as pathogenic here were classified using Mayo Clinic pathogenicity guidelines.
Sig. (two tailed) = significance (p value) from two-tailed t-test test.
Variants identified
The overall molecular diagnostic rate using the Mayo Clinic PKD pathogenicity guidelines was 83% (141/169), and 81% (120/148) in families. The overall molecular diagnostic rate using ACMG pathogenicity guidelines was 71% (120/169) and 68% (100/148) in families. All diagnostic, AD and AR pathogenic variants are listed in Supplementary Table 3. Ninety-one percent of these AD and AR pathogenic variants were detected using the NGS pipeline, 7% by LR-PCR and 2% by reading depth analysis and MLPA (Fig. 1). We identified 113 patients (97 families) with an AD pathogenic variant in PKD1, 27 patients (22 families) in PKD2 and one patient/family with a homozygous AR pathogenic genotype in PKHD1. We did not detect any AD pathogenic variants in GANAB. The breakdown of diagnostic variants identified is summarised in Fig. 2. Forty-four percent (44/100) of the detected AD Mayo Clinic classified definitely pathogenic/ highly likely pathogenic/ likely pathogenic variants were novel (46% (39/84) of ACMG pathogenic variants) (see Fig. 3), and previously unreported in the relevant disease databases (see “Methods”). Fourteen AD pathogenic variants in PKD1 and PKD2 were identified in multiple families who were unrelated according to clinical records (Table 2). Two of these repeated AD pathogenic variants were novel.
Fig. 2. Number and type of PKD1 and PKD2 AD pathogenic variants detected.

These charts describe the number and type of AD pathogenic variants identified in the Irish cohort (classified using Mayo Clinic pathogenicity guidelines). The central chart shows the gene in which variants were identified and the outer charts show the breakdown of variant types for each of those genes. Corresponding protein domains for the variants listed in this figure are shown in Supplementary Table 10.
Fig. 3. Diagnostic PKD1 variants detected using custom next-generation sequencing pipeline.

Novel pathogenic PKD1 variants (classified using Mayo Clinic pathogenicity guidelines) detected in our Irish cohort shown across the PKD1 gene. The gene is divided into exons (1–46, as per NG_008617.1) above and key domains are shown below. LRR leucine-rich repeat; WSC cell wall integrity and stress response component; REJ receptor for egg jelly; GPS G protein-coupled receptor proteolytic site; PLAT polycystin-1, lipoxygenase, α toxin; TM transmembrane.
Table 2.
Autosomal dominant and autosomal recessive pathogenic variants observed in multiple, apparently unrelated families.
| Gene | Type of variant | Change | hg38 coordinates | MAF (gnomAD) | Previously reported | Number of families | IBD sharing confirmation | Kinship relationship |
|---|---|---|---|---|---|---|---|---|
| PKD1 | Splicing | c.1606 + 5G > A | chr16:2116828 | 0 | N | 2 | Y | 2nd degree |
| PKD1 | Missense | p.L1361P | chr16:2111085 | 0 | N | 2 | Y | 2nd degree |
| PKD1 | Missense | p.L3142P | chr16:2100539 | 0 | Y | 3 | N | No relationship Identified |
| PKD1 | Stopgain | p.Q2670* | chr16:2105330 | 0 | Y | 2 | N | No relationship Identified |
| PKD1 | Stopgain | p.Q2686* | chr16:2104603 | 0 | Y | 2 | Y | 2nd-3rd degree |
| PKD1 | Stopgain | p.Q4225* | chr16:2089966 | 0 | N | 3 | Y | 2 of 3 families related - 2nd degree |
| PKD1 | Frameshift deletion | p.R1672fs | chr16:2110152 | 0 | Y | 2 | N | No relationship Identified |
| PKD1 | Missense | p.R3750Q | chr16:2092500 | 4.04E-06 | Y | 2 | N | No relationship Identified |
| PKD1 | Missense | p.R611W | chr16:2116010 | 0 | Y | 2 | Y | Full Sibling |
| PKD1 | Stopgain | p.Y3781* | chr16:2092115 | 0 | Y | 2 | Y | 4th degree |
| PKD2 | Stopgain | p.E494* | chr4:88046802 | 0 | Y | 3 | Y | 2 of 3 families related - 2nd degree |
| PKD2 | Missense | p.R322W | chr4:88038371 | 0 | Y | 4 | 2 of 4 families share IBD segment | 2 of 4 families related - 3rd degree |
| PKD2 | Stopgain | p.W201* | chr4:88019464 | 0 | Y | 3 | Y | No relationship Identified |
| PKD2 | Stopgain | p.Y762* | chr4:88065807 | 0 | Y | 2 | Y | Parent Offspring |
MAF (gnomAD) Minor allele frequency in gnomAD database; Gene of Interest Gene in which the disease-causing variant was identified; Previously reported Describes if the variant had previously been reported in the Mayo PKDB, ClinVar or OMIM databases; IBS Identity by State; IBD Identity by Descent; IBD Sharing Confirmation If ‘Y’ indicates that families shared an IBD segment across the gene of interest, if ‘N’ indicates that no IBD segment was detected across the gene of interest; Kinship Relationship Degree of the relationship inferred by KING on the basis of IBS and IBD sharing.
Patient characteristics
We next compared clinical characteristics between groups of patients with and without an identifiable molecular diagnosis (using Mayo Clinic pathogenicity guidelines) (see Table 1 and Supplementary Materials). The mean age at diagnosis was lower in the group with a molecular diagnosis (p = 0.003), however, the age at which these patients reach ESKD was not significantly different (p = 0.66). Although the rate of diagnosis was higher in families with a family history (85%, 112/131), compared to those without (75%, 27/36), this difference was not significant (p value 0.139, (Fisher’s Exact Test, two-sided)). There was no difference in survival rates between patients with and without a molecular diagnosis. Patient 10262 with a molecular diagnosis of PKHD1 was diagnosed at a young age and underwent right orchidopexy and right hydrocele repair at age six. They continued to progress and at age 25 years started on dialysis.
Irish Traveller Dataset
We next looked at the frequency of the identified diagnostic variants in an endogamous population isolate within Ireland, the Irish Travellers (previously sequenced cohort, n = 16 [25]). None of the disease-causing PKD variants from our cohort were detected in this cohort (including the heterozygous PKHD1 variants). The previously described hypomorphic PKD1 variant NM_001009944.3: c.8293C > T:p.(Arg2765Cys) (rs144979397) was observed in two of the Irish Traveller samples sequenced (2/16, 12.5%). This variant has previously been associated with a more severe phenotype when detected along with an established pathogenic PKD1 variant, although this variant in isolation is not expected to cause disease. The disease status of these individuals is unknown [40].
Quantifying the relationship between individuals carrying the same disease-causing variant
Fourteen AD pathogenic variants in PKD1 and PKD2 were identified in multiple unrelated (according to clinical records) Irish PKD patients. This suggests that either these variants may be a recurrent disease-causing variants or that the patients are in fact distantly related and the variants are descended from a common ancestor. To establish if a shared variant indeed descended from a common ancestor, we determined whether that variant was present on a PKD1/PKD2 haplotype that was identical by descent. Table 2 describes the 14 variants shared between 34 families reported as unrelated in the clinical records. We confirmed that nine of the 14 variants showed IBD between all sharing families and one of the fourteen variants showed partial IBD sharing between two out of four families. For the remaining four variants, we were unable to detect IBD across the gene of interest between families. We then went on to quantify the genetic relationship between carriers of the same AD pathogenic variants regardless of pedigree information from the clinical record. Using IBS-based measurements (see Supplementary Tables 4–6), we identified relationships from parent-offspring to 4th degree (see Table 2). The identification of relationships between these individuals, which were not recorded in the clinical record, reduced the number of unique families from 148 to 139.
Renal survival analyses
In order to determine the impact of the PKD gene and AD pathogenic variant type (classified using Mayo Clinic pathogenicity guidelines) on the age of development of ESKD, we conducted renal survival analyses, calculated as time to ESKD measured in years. As expected, PKD1 AD pathogenic variants correlated with a shorter renal survival time from Kaplan–Meier analysis, relative to PKD2. PKD1 patients had an estimated survival time (age at ESKD) of 50 years (standard error (SE) 1.1 years) and PKD2 patients,70 years (SE 2.4 years). When subdivided by variant type (truncating vs non-truncating), PKD1 truncating variants had a lower renal survival (49 years, SE 1.1 years) than those with a PKD1 non-truncating variant (55 years, SE 2.3 years) by log-rank test (p-value 0.002) (see Fig. 4). No significant difference was noted between non-truncating and truncating AD pathogenic variants in PKD2. According to the log-rank test, patients without a molecular diagnosis had a significantly lower age at ESKD than those with an AD pathogenic variant in PKD2 (p-value 0.016) and PKD1 truncating variants (p-value 0.0004) but were not significantly different from those with PKD1 non- truncating variants (p-value 0.542) (Supplementary Fig. 1A). We stratified variant type into additional subcategories ((1) PKD1 frameshift insertion or deletion, (2) PKD1 splicing, (3) PKD1 stopgain or stoploss, (4) PKD2 truncating and (5) PKD2 non-truncating) to test the effect of these sub-groups on renal survival, but did not find any additional novel significant findings (Supplementary Fig. 1B).
Fig. 4. Kaplan Meier survival graph showing time to ESKD.

Kaplan Meier survival graph showing time to ESKD in those with pathogenic (classified using Mayo Clinic pathogenicity guidelines) truncating and non-truncating PKD1 variants and PKD2 variants. Results from the Log Rank (Mantel-Cox) are shown under the graph.
Variant classification
We assessed candidate AD and AR pathogenic variants discussed at MDT using variant assessment guidelines from both the ACMG and the Mayo Clinic. The rate of molecular diagnosis per family was significantly lower when applying the ACMG guidelines (68% (100/148)), than using the Mayo Clinic PKD variant pathogenicity guidelines (81% (120/148)) (Fisher’s Exact test p-value 0.0112). A total of 14% (20/145) of the families with highly likely pathogenic or likely AR/AD pathogenic variants when categorised using the standard Mayo Clinic guidelines were classified as VUS using ACMG criteria (see Supplementary Table 11). Rossetti and colleagues [21] used NGS targeted sequencing to characterise a cohort of 230 ADPKD patients and applied the Mayo Clinic pathogenicity guidelines for variant classification, reporting definitely and likely AR/AD pathogenic variants in 63% (115/183) of patients. We applied ACMG guidelines to the Rossetti variant catalogue and determined a diagnostic yield of 48% (87/183). The ACMG and Mayo Clinic classifications assigned to each variant from the Irish dataset are provided in Supplementary Table 3 and those for the Rossetti article are shown in Supplementary Table 7. We note that the majority of variant pathogenicity discrepancies between the two assessment tools (94% (47/50) of potentially clinically relevant discrepancies) are missense variants within PKD1. No variants found to be likely pathogenic or pathogenic by the ACMG guidelines were classified as benign or uncertain significance using the Mayo Clinic guidelines. Unless missense variants are well-described and/or studied previously (e.g. functional data), they are difficult to classify as anything above a VUS using ACMG criteria.
Discussion
We describe the genetic landscape of PKD in Ireland for the first time, compare the clinical features of patients with and without a molecular diagnosis and correlate disease severity with variant type. We have implemented a combination of molecular diagnostic tools, achieving a diagnostic rate of 83%. We have catalogued the most common Irish PKD AR and AD pathogenic variants and identified 36 novels ACMG pathogenic likely disease-causing variants. We have confirmed that many AD pathogenic variants shared between seemingly unrelated individuals have been inherited from a common ancestor. We highlight some issues surrounding the implementation of the ACMG guidelines for variant pathogenicity interpretation in PKD genomics.
Previous studies have assessed targeted NGS for PKD diagnostics [20] and although LR-PCR/Sanger approaches are still the gold-standard for variant identification, NGS is becoming established as a high-throughput method for the initial assessment of patients, in-tandem with other techniques (e.g. CNV identification and gap-filling Sanger). By combining these techniques with our NGS panel, we identified a diagnostic variant in 14 additional patients (8%; three by reading depth analyses and 11 by LR-PCR and Sanger sequencing) who screened-negative with the standard NGS analyses. Three of these variants were CNVs, three were missense, six were splicing, one was a stopgain, and one was a non-frameshift deletion. All of these variants were within PKD1 and did not cluster in any one exon or region. Variants detected by LR-PCR and Sanger sequencing which were not identified as part of the NGS pipeline were missed due to low coverage in exon 1 of PKD1, poor read mapping as a result of sequence homology to pseudogenes or were excluded as part of bioinformatic hard filtering protocols. As DNAJB11 was not included on the panel, we were unable to assess variants in this gene.
CNVs are known to cause disease in 1–5% of PKD patients [5, 8, 12, 13] and are thus an important part of any diagnostic pipeline. A previous study by Eisenberger and colleagues utilised the VarScan read-depth based tool to successfully confirm two known PKD1 CNVs in two patients, previously identified by MLPA. They did not identify any additional CNVs in the rest of their cohort (n = 55) using this method [12]. We utilised the recently developed GATK4 GermlineCNVCaller [29] to detect CNVs in PKD genes including PKD1 and found three CNVs which were later confirmed by MLPA. We propose that initial screening using NGS-based CNV calling can be used to minimise the number of samples for more time-consuming and expensive MLPA testing.
Our haplotype and genetic distance analysis illustrated that apparently unrelated individuals carrying the same pathogenic PKD variant are highly likely to have inherited the variants from a distant common ancestor in regionally collected populations. We identified nine sets of distantly related families, confirmed by both IBS and IBD. Three pairs of families shared haplotypes across the region covering the AD pathogenic variant, but the IBS analysis was unable to identify a relationship between these individuals. This may be because these individuals are more distantly related than the IBS software (KING) is able to detect (i.e. greater than fourth-degree relatives). We were unable to detect IBD across the gene of interest for four of the fourteen variants. We speculate that these may be older variants, carried on haplotypes that are too short to confirm IBD. Indeed, one of the four variants in question (NM_001009944.3: c.11249G > A:p.(Arg3750Gln)) has an allele frequency in gnomAD of 4 × 10⁻⁶ and has been reported in four families in the PKDB mutation database (https://pkdb.mayo.edu/index.html), suggesting that it is a relatively common and thus probably older PKD variant. Alternatively, these variants may represent independent mutation events. This type of genetic distance analysis may be of use when assigning pathogenicity to a variant using ACMG guidelines. For example, the variant carried by families F391 and F399 could be reclassified using ACMG guidelines from a VUS to likely pathogenic as a result of the additional segregation evidence provided by this relationship analysis.
We have replicated previous reports [16] that link PKD1/2 AD pathogenic variants with disease severity and the association between AD pathogenic variant type (PKD1 ‘truncating’, PKD1 ‘non-truncating’ or PKD2) and age at ESKD [17]. This association did not extend to more finely categorised variant types, perhaps as a result of low numbers in these smaller categories. We did not observe the previously reported [41] difference in the age at which patients with PKD2 truncating or PKD2 non-truncating AD pathogenic variants reach ESKD, probably due to lack of study power. These results are consistent with previous reports [17, 18]. However, previous reports have indicated a difference in levels of eGFR between these groups [18]. Our screen-negative patients appeared to have similar rates of renal survival to those with AD PKD1 non-truncating pathogenic variants and had significantly lower renal survival than those with PKD2 AD pathogenic variants.
We observed three individuals who carried additional variants that satisfied the ACMG guidelines for variant pathogenicity (‘likely pathogenic’/’pathogenic’) (Supplementary Table 8). It is unclear based on the patient phenotypes available whether these variants may have an impact on the severity of the disease in these cases. Two of these patients carried the same splicing variant in COL4A4 (c.2164 + 2T > G). Collagen gene variants including those in COL4A4 are traditionally associated with Alport syndrome/thin basement membrane disease but have been reported previously in-tandem with a PKD AD pathogenic variant and may have a modifier effect on primary PKD variants [42]. The main feature of COL4A4-linked disease is haematuria and progressive renal failure associated with progressive hearing loss. There was no evidence of hearing loss in either pedigree.
Whilst the ACMG guidelines have been widely embraced by the scientific community, it is recognised that there are deficiencies. These guidelines perform best for paediatric-onset rare diseases. For adult-onset disorders such as PKD and those with reduced penetrance, there are a number of weaknesses:
Missense variants are common and score as only moderate evidence for pathogenicity while truncating variants score as strong evidence. This increases the likelihood that missense variants will be scored as a VUS.
Population databases such as gnomAD are used to estimate the frequency of variants in the healthy population. This is a reasonable approach for paediatric rare diseases where penetrance is almost 100% by adulthood. However, it is possible for PKD that a small number of affected patients may be included in the ‘healthy’ population before presenting with symptoms. This may lead an AD pathogenic variant to be deemed as benign/VUS.
The incidence of de novo variants is lower in PKD than in severe paediatric-onset diseases. If a variant is de novo this can be used as strong evidence of pathogenicity within ACMG. As most PKD is inherited, it means that many more variants remain as a VUS.
In diseases like PKD in which there is extreme allelic heterogeneity, it is less likely that a variant will have been previously reported in a disease database, reducing the opportunity to assign strong evidence on the basis of previously established pathogenicity.
We assessed the utility of the ACMG guidelines for clinical variant pathogenicity interpretation in PKD and compared these guidelines to those widely used in PKD research from the Mayo Clinic. An important difference between these tools is that the ACMG guidelines were developed for clinical genetics use, while the guidelines from the Mayo Clinic were designed for research use only. Our results highlight an issue surrounding the use of the ACMG guidelines, with regard to missense PKD1 variant assessment. These missense variants are difficult to classify as likely pathogenic or pathogenic using the ACMG guidelines unless they have been extensively studied and reported previously [43], largely due to the variability in regional pathogenicity of PKD1 [10]. While it is imperative that pathogenicity guidelines are conservative to control for ‘over-calling’ of Pathogenic/Likely Pathogenic variants, the conservative nature of the ACMG guidelines can be problematic as novel PKD1 variants are common, with 31% of diagnostic variants identified being a novel finding from our cohort. Equally, it is important to note that higher diagnostic rates obtained when using the Mayo Clinic research classification tool may be enriched for false-positives, which in a clinical setting could cause harm to patients. The 2015 ACMG guidelines refer to the development of focused guidance for the classification of variants in specific genes since pathogenicity criteria vary by gene and disease [44]. Indeed, gene-specific guidelines for the interpretation of variants have been proposed for other diseases [23, 45–47]. These disease-specific modifications have in some cases increased the number of variants classified as VUS and are not necessarily more permissive of missense variants [45]. We suggest that a tailored set of ACMG-based guidelines may facilitate the standardisation of interpretation of variants in PKD1.
Studies of PKD in US, French, Italian and German populations have contributed to the development of a catalogue of PKD AR and AD pathogenic variants [5, 12, 48–51]. However, the broader European population (and non-Caucasian populations) has not been studied in as much depth as the US one [17, 50, 52]. There have been limited studies cataloguing the spectrum of AD and AR pathogenic variants in the UK and Ireland to date [16], although the inclusion of cystic renal disease patients in the Genomics England initiative will likely result in a catalogue of UK AD and AR pathogenic variants.
There were a number of limitations to this study. The coverage achieved for PKD1 (NG_008617.1) exon 1 was not sufficient for variant identification, necessitating gap-filling Sanger sequencing in patients without a molecular diagnosis from NGS. It is possible that due to low coverage of this region, or due to pseudogene homology to PKD1 that some patients carried additional, clinically relevant variants that were not detected. The sequencing methods used in this study were also unable to detect small insertions and deletions in the variable number tandem repeat region of MUC1.
A genetic diagnosis not only informs on prognosis, but facilitates cascade testing of relatives considering donating a kidney to a family member, and provides information when planning a family or making decisions about care. A confirmed genetic diagnosis opens the possibility of pre-implantation screening for couples with a family history of PKD and may ensure that patients receive follow-up testing for common PKD complications including cerebral aneurysms and liver cysts. We recommend that PKD testing adopts a combination of approaches for the molecular diagnosis of PKD patients. Finally, we recommend further standardisation of variant pathogenicity assessment within the PKD community, but highlight some potential issues with the implementation of established ACMG pathogenicity guidelines which may require some modification for use in PKD.
Supplementary information
Supplementary Table 1: Roche HeatSeq gene list
Supplementary Table 2: ACMG guidelines interpretation method
Supplementary Table 3: Supplementary Table 3: Genetic Diagnosis in patients in which a disease-causing variant of PKD was identified
Supplementary Table 4: KING and refined IBD results
Supplementary Table 5: Kinship scores and inferred relationships
Supplementary Table 7: ACMG and Mayo Clinic classifications assigned to each variant from the Rossetti dataset
Supplementary Table 8: Additional variants which satisfied the ACMG guidelines for variant pathogenicity
Supplementary Table 9: Clinical details of patients without a molecular diagnosis
Supplementary Table 10: Correponding protein domins for variants listed in Figure 2
Supplementary Table 11: Genetic scoring of nontruncating PKD1 and PKD2 variants scored as VUS by the ACMG classification employing the Mayo Research Mutation Classification Algorithm
Acknowledgements
KB is supported by an Enterprise Partnership Scheme Fellowship Award (2019) from The Irish Research Council, in conjunction with Punchestown Kidney Research Fund (EPSPD/2019/213). The authors also acknowledge funding received from the Beaumont Hospital Foundation, the Royal Irish Academy and the Royal College of Surgeons in Ireland. SC is supported by the Irish Clinical Academic Training (ICAT) Programme, supported by the Wellcome Trust and the Health Research Board (Grant Number 203930/B/16/Z), the Health Service Executive National Doctors Training and Planning and the Health and Social Care, Research and Development Division, Northern Ireland. We also acknowledge that this work would not be possible without the participation of the consenting patients and their families.
Compliance with ethical standards
Conflict of interest
The authors declare that they have no conflict of interest.
Footnotes
Publisher’s note Springer Nature remains neutral with regard to jurisdictional claims in published maps and institutional affiliations.
These authors contributed equally: Gianpiero L. Cavalleri, Peter Conlon
Contributor Information
Gianpiero L. Cavalleri, Email: gcavalleri@rcsi.ie
Peter Conlon, Email: peterconlon@beaumont.ie.
Supplementary information
The online version of this article (10.1038/s41431-020-00806-5) contains supplementary material, which is available to authorized users.
References
- 1.Suwabe T, Shukoor S, Chamberlain AM, Killian JM, King BF, Edwards M, et al. Epidemiology of autosomal dominant polycystic kidney disease in olmsted county. Clin J Am Soc Nephrol. 2020;15:69–79. doi: 10.2215/CJN.05900519. [DOI] [PMC free article] [PubMed] [Google Scholar]
- 2.ERA-EDTA Registry Committee. ERA-EDTA Registry Annual Report 2017. 2017.
- 3.McEwan P, Bennett Wilton H, Ong ACM, Ørskov B, Sandford R, Scolari F, et al. A model to predict disease progression in patients with autosomal dominant polycystic kidney disease (ADPKD): the ADPKD Outcomes Model. BMC Nephrol. 2018;19:37. doi: 10.1186/s12882-017-0804-2. [DOI] [PMC free article] [PubMed] [Google Scholar]
- 4.Cornec-Le Gall E, Olson RJ, Besse W, Heyer CM, Gainullin VG, Smith JM, et al. Monoallelic mutations to DNAJB11 cause atypical autosomal-dominant polycystic kidney disease. Am J Hum Genet. 2018;102:832–44. doi: 10.1016/j.ajhg.2018.03.013. [DOI] [PMC free article] [PubMed] [Google Scholar]
- 5.Audrézet MP, Cornec-Le Gall E, Chen JM, Redon S, Quéré I, Creff J, et al. Autosomal dominant polycystic kidney disease: comprehensive mutation analysis of PKD1 and PKD2 in 700 unrelated patients. Hum Mutat. 2012;33:1239–50. doi: 10.1002/humu.22103. [DOI] [PubMed] [Google Scholar]
- 6.Cornec-Le Gall E, Audrézet M-P, Rousseau A, Hourmant M, Renaudineau E, Charasse C, et al. The PROPKD Score: a new algorithm to predict renal survival in autosomal dominant polycystic kidney disease. J Am Soc Nephrol. 2016;27:942–51. doi: 10.1681/ASN.2015010016. [DOI] [PMC free article] [PubMed] [Google Scholar]
- 7.Heyer CM, Sundsbak JL, Abebe KZ, Chapman AB, Torres VE, Grantham JJ, et al. Predicted mutation strength of nontruncating PKD1 mutations aids genotype-phenotype correlations in autosomal dominant polycystic kidney disease. J Am Soc Nephrol. 2016;27:2872–84. doi: 10.1681/ASN.2015050583. [DOI] [PMC free article] [PubMed] [Google Scholar]
- 8.Rossetti S, Consugar MB, Chapman AB, Torres VE, Guay-Woodford LM, Grantham JJ, et al. Comprehensive molecular diagnostics in autosomal dominant polycystic kidney disease. J Am Soc Nephrol. 2007;18:2143–60. doi: 10.1681/ASN.2006121387. [DOI] [PubMed] [Google Scholar]
- 9.Porath B, Gainullin VG, Cornec-Le Gall E, Dillinger EK, Heyer CM, Hopp K, et al. Mutations in GANAB, encoding the glucosidase iiα subunit, cause autosomal-dominant polycystic kidney and liver disease. Am J Hum Genet. 2016;98:1193–207. doi: 10.1016/j.ajhg.2016.05.004. [DOI] [PMC free article] [PubMed] [Google Scholar]
- 10.Cornec-Le Gall E, Torres VE, Harris PC. Genetic complexity of autosomal dominant polycystic kidney and liver diseases. J Am Soc Nephrol. 2017;29:ASN.2017050483. doi: 10.1681/ASN.2017050483. [DOI] [PMC free article] [PubMed] [Google Scholar]
- 11.Redon R, Ishikawa S, Fitch KR, Feuk L, Perry GH, Andrews TD, et al. Global variation in copy number in the human genome. Nature. 2006;444:444–54. doi: 10.1038/nature05329. [DOI] [PMC free article] [PubMed] [Google Scholar]
- 12.Eisenberger T, Decker C, Hiersche M, Hamann RC, Decker E, Neuber S, et al. An efficient and comprehensive strategy for genetic diagnostics of polycystic kidney disease. PLoS One. 2015;10:e0116680. doi: 10.1371/journal.pone.0116680. [DOI] [PMC free article] [PubMed] [Google Scholar]
- 13.Consugar MB, Wong WC, Lundquist PA, Rossetti S, Kubly VJ, Walker DL, et al. Characterization of large rearrangements in autosomal dominant polycystic kidney disease and the PKD1/TSC2 contiguous gene syndrome. Kidney Int. 2008;74:1468–79. doi: 10.1038/ki.2008.485. [DOI] [PMC free article] [PubMed] [Google Scholar]
- 14.Besse W, Chang AR, Luo JZ, Triffo WJ, Moore BS, Gulati A, et al. ALg9 mutation carriers develop kidney and liver cysts. J Am Soc Nephrol. 2019;30:2091–102. doi: 10.1681/ASN.2019030298. [DOI] [PMC free article] [PubMed] [Google Scholar]
- 15.Onuchic LF, Furu L, Nagasawa Y, Hou X, Eggermann T, Ren Z, et al. PKHD1, the polycystic kidney and hepatic disease 1 Gene, encodes a novel large protein containing multiple immunoglobulin-like plexin-transcription–factor domains and parallel beta-helix 1 repeats. Am J Hum Genet. 2002;70:1305–17. doi: 10.1086/340448. [DOI] [PMC free article] [PubMed] [Google Scholar]
- 16.Rossetti S, Burton S, Strmecki L, Pond GR, San Millán JL, Zerres K, et al. The position of the polycystic kidney disease 1 (PKD1) gene mutation correlates with the severity of renal disease. J Am Soc Nephrol. 2002;13:1230–7. doi: 10.1097/01.asn.0000013300.11876.37. [DOI] [PubMed] [Google Scholar]
- 17.Cornec-Le Gall E, Audrézet M-P, Chen J-M, Hourmant M, Morin M-P, Perrichot R, et al. Type of PKD1 mutation influences renal outcome in ADPKD. J Am Soc Nephrol. 2013;24:1006–13. doi: 10.1681/ASN.2012070650. [DOI] [PMC free article] [PubMed] [Google Scholar]
- 18.Cornec-Le Gall E, Audrézet M-P, Renaudineau E, Hourmant M, Charasse C, Michez E, et al. PKD2 -related autosomal dominant polycystic kidney disease: prevalence, clinical presentation, mutation spectrum, and prognosis. Am J Kidney Dis. 2017;70:476–85. doi: 10.1053/j.ajkd.2017.01.046. [DOI] [PMC free article] [PubMed] [Google Scholar]
- 19.Ali H, Al-Mulla F, Hussain N, Naim M, Asbeutah AM, AlSahow A, et al. PKD1 duplicated regions limit clinical utility of whole exome sequencing for genetic diagnosis of autosomal dominant polycystic kidney disease. Sci Rep. 2019;9:4141. doi: 10.1038/s41598-019-40761-w. [DOI] [PMC free article] [PubMed] [Google Scholar]
- 20.Tan AY, Michaeel A, Liu G, Elemento O, Blumenfeld J, Donahue S, et al. Molecular diagnosis of autosomal dominant polycystic kidney disease using next-generation sequencing. J Mol Diagn. 2014;16:216–28. doi: 10.1016/j.jmoldx.2013.10.005. [DOI] [PMC free article] [PubMed] [Google Scholar]
- 21.Rossetti S, Hopp K, Sikkink RA, Sundsbak JL, Lee YK, Kubly V, et al. Identification of gene mutations in autosomal dominant polycystic kidney disease through targeted resequencing. J Am Soc Nephrol. 2012;23:915–33. doi: 10.1681/ASN.2011101032. [DOI] [PMC free article] [PubMed] [Google Scholar]
- 22.Borràs DM, Vossen RHAM, Liem M, Buermans HPJ, Dauwerse H, van Heusden D, et al. Detecting PKD1 variants in polycystic kidney disease patients by single-molecule long-read sequencing. Hum Mutat. 2017;38:870–9. doi: 10.1002/humu.23223. [DOI] [PMC free article] [PubMed] [Google Scholar]
- 23.Richards S, Aziz N, Bale S, Bick D, Das S, Gastier-Foster J, et al. Standards and guidelines for the interpretation of sequence variants: a joint consensus recommendation of the American College of Medical Genetics and Genomics and the Association for Molecular Pathology. Genet Med. 2015;17:405–23. doi: 10.1038/gim.2015.30. [DOI] [PMC free article] [PubMed] [Google Scholar]
- 24.Rossetti S, Harris PC. Genotype-phenotype correlations in autosomal dominant and autosomal recessive polycystic kidney disease. J Am Soc Nephrol. 2007;18:1374–80. doi: 10.1681/ASN.2007010125. [DOI] [PubMed] [Google Scholar]
- 25.Gilbert E, Carmi S, Ennis S, Wilson JF, Cavalleri GL. Genomic insights into the population structure and history of the Irish Travellers. Sci Rep. 2017;7:42187. doi: 10.1038/srep42187. [DOI] [PMC free article] [PubMed] [Google Scholar]
- 26.Byrne RP, Martiniano R, Cassidy LM, Carrigan M, Hellenthal G, Hardiman O, et al. Insular Celtic population structure and genomic footprints of migration. PLoS Genet. 2018;14:e1007152. [DOI] [PMC free article] [PubMed]
- 27.Pei Y, Obaji J, Dupuis A, Paterson AD, Magistroni R, Dicks E, et al. Unified criteria for ultrasonographic diagnosis of ADPKD. J Am Soc Nephrol. 2009;20:205–12. doi: 10.1681/ASN.2008050507. [DOI] [PMC free article] [PubMed] [Google Scholar]
- 28.Cormican S, Connaughton DM, Kennedy C, Murray S, Živná M, Kmoch S, et al. Autosomal dominant tubulointerstitial kidney disease (ADTKD) in Ireland. Ren Fail. 2019;41:832–41. doi: 10.1080/0886022X.2019.1655452. [DOI] [PMC free article] [PubMed] [Google Scholar]
- 29.McKenna A, Hanna M, Banks E, Sivachenko A, Cibulskis K, Kernytsky A, et al. The genome analysis toolkit: a MapReduce framework for analyzing next-generation DNA sequencing data. Genome Res. 2010;20:1297–303. doi: 10.1101/gr.107524.110. [DOI] [PMC free article] [PubMed] [Google Scholar]
- 30.Adzhubei I, Jordan DM, Sunyaev SR. Predicting functional effect of human missense mutations using PolyPhen-2. Curr Protoc Hum Genet. 2013;Chapter 7:Unit7.20. doi: 10.1002/0471142905.hg0720s76. [DOI] [PMC free article] [PubMed] [Google Scholar]
- 31.Kumar P, Henikoff S, Ng PC. Predicting the effects of coding non-synonymous variants on protein function using the SIFT algorithm. Nat Protoc. 2009;4:1073–81. doi: 10.1038/nprot.2009.86. [DOI] [PubMed] [Google Scholar]
- 32.Karczewski KJ, Francioli LC, Tiao G, Cummings BB, Alföldi J, Wang Q, et al. Variation across 141,456 human exomes and genomes reveals the spectrum of loss-of-function intolerance across human protein-coding genes. bioRxiv. 2019;531210.
- 33.Gilbert E, O’Reilly S, Merrigan M, McGettigan D, Molloy AM, Brody LC, et al. The Irish DNA Atlas: Revealing fine-scale population structure and history within Ireland. Sci Rep. 2017;7:17199. doi: 10.1038/s41598-017-17124-4. [DOI] [PMC free article] [PubMed] [Google Scholar]
- 34.Desch KC, Ozel AB, Siemieniak D, Kalish Y, Shavit JA, Thornburg CD, et al. Linkage analysis identifies a locus for plasma von Willebrand factor undetected by genome-wide association. Proc Natl Acad Sci USA. 2013;110:588–93. doi: 10.1073/pnas.1219885110. [DOI] [PMC free article] [PubMed] [Google Scholar]
- 35.Chang CC, Chow CC, Tellier LCAM, Vattikuti S, Purcell SM, Lee JJ, et al. Second-generation PLINK: rising to the challenge of larger and richer datasets. Gigascience. 2015;4:7. doi: 10.1186/s13742-015-0047-8. [DOI] [PMC free article] [PubMed] [Google Scholar]
- 36.Purcell S, Neale B, Todd-Brown K, Thomas L, Ferreira MAR, Bender D, et al. PLINK: a tool set for whole-genome association and population-based linkage analyses. Am J Hum Genet. 2007;81:559–75. doi: 10.1086/519795. [DOI] [PMC free article] [PubMed] [Google Scholar]
- 37.Browning SR, Browning BL. Rapid and accurate haplotype phasing and missing-data inference for whole-genome association studies by use of localized haplotype clustering. Am J Hum Genet. 2007;81:1084–97. doi: 10.1086/521987. [DOI] [PMC free article] [PubMed] [Google Scholar]
- 38.Browning BL, Browning SR. Improving the accuracy and efficiency of identity-by-descent detection in population data. Genetics. 2013;194:459–71. doi: 10.1534/genetics.113.150029. [DOI] [PMC free article] [PubMed] [Google Scholar]
- 39.Manichaikul A, Mychaleckyj JC, Rich SS, Daly K, Sale M, Chen W-M. Robust relationship inference in genome-wide association studies. Bioinformatics. 2010;26:2867–73. doi: 10.1093/bioinformatics/btq559. [DOI] [PMC free article] [PubMed] [Google Scholar]
- 40.Vujic M, Heyer CM, Ars E, Hopp K, Markoff A, Orndal C, et al. Incompletely penetrant PKD1 alleles mimic the renal manifestations of ARPKD. J Am Soc Nephrol. 2010;21:1097–102. doi: 10.1681/ASN.2009101070. [DOI] [PMC free article] [PubMed] [Google Scholar]
- 41.Magistroni R, He N, Wang K, Andrew R, Johnson A, Gabow P, et al. Genotype-renal function correlation in type 2 autosomal dominant polycystic kidney disease. J Am Soc Nephrol. 2003;14:1164–74. doi: 10.1097/01.asn.0000061774.90975.25. [DOI] [PubMed] [Google Scholar]
- 42.Phelan PJ, Fletcher E, Carroll N, Metcalfe W, Turner AN. Simultaneous adult polycystic kidney disease and Alport syndrome. Nephrology. 2016;21:722–3. doi: 10.1111/nep.12661. [DOI] [PubMed] [Google Scholar]
- 43.Durkie M, Chong J, Valluru MK, Harris PC, Ong ACM. Biallelic inheritance of hypomorphic PKD1 variants is highly prevalent in very early onset polycystic kidney disease. Genet Med. 2020. 10.1038/s41436-020-01026-4. [DOI] [PMC free article] [PubMed]
- 44.Richards S, Aziz N, Bale S, Bick D, Das S, Gastier-Foster J, et al. Standards and guidelines for the interpretation of sequence variants: a joint consensus recommendation of the American College of Medical Genetics and Genomics and the Association for Molecular Pathology. Genet Med. 2015;17:405–24. doi: 10.1038/gim.2015.30. [DOI] [PMC free article] [PubMed] [Google Scholar]
- 45.Muiño-Mosquera L, Steijns F, Audenaert T, Meerschaut I, De Paepe A, Steyaert W, et al. Tailoring the American College of Medical Genetics and Genomics and the Association for Molecular Pathology Guidelines for the Interpretation of Sequenced Variants in the FBN1 Gene for Marfan Syndrome. Circ Genom Precis Med. 2018;11:e002039. doi: 10.1161/CIRCGEN.117.002039. [DOI] [PubMed] [Google Scholar]
- 46.Whiffin N, Walsh R, Govind R, Edwards M, Ahmad M, Zhang X, et al. CardioClassifier: disease- and gene-specific computational decision support for clinical genome interpretation. Genet Med. 2018;20:1246–54. doi: 10.1038/gim.2017.258. [DOI] [PMC free article] [PubMed] [Google Scholar]
- 47.Luo X, Feurstein S, Mohan S, Porter CC, Jackson SA, Keel S, et al. ClinGen Myeloid Malignancy Variant Curation Expert Panel recommendations for germline RUNX1 variants. Blood Adv. 2019;3:2962–79. doi: 10.1182/bloodadvances.2019000644. [DOI] [PMC free article] [PubMed] [Google Scholar]
- 48.Willey CJ, Blais JD, Hall AK, Krasa HB, Makin AJ, Czerwiec FS. Prevalence of autosomal dominant polycystic kidney disease in the European Union. Nephrol Dial Transplant. 2016;32:gfw240. doi: 10.1093/ndt/gfw240. [DOI] [PMC free article] [PubMed] [Google Scholar]
- 49.Rossetti S, Strmecki L, Gamble V, Burton S, Sneddon V, Peral B, et al. Mutation analysis of the entire PKD1 gene: genetic and diagnostic implications. Am J Hum Genet. 2001;68:46–63. doi: 10.1086/316939. [DOI] [PMC free article] [PubMed] [Google Scholar]
- 50.Carrera P, Calzavara S, Magistroni R, Den Dunnen JT, Rigo F, Stenirri S, et al. Deciphering variability of PKD1 and PKD2 in an Italian cohort of 643 patients with autosomal dominant polycystic kidney disease (ADPKD) Sci Rep. 2016;6:30850. doi: 10.1038/srep30850. [DOI] [PMC free article] [PubMed] [Google Scholar]
- 51.Mantovani V, Bin S, Graziano C, Capelli I, Minardi R, Aiello V, et al. Gene panel analysis in a large cohort of patients with autosomal dominant polycystic kidney disease allows the identification of 80 potentially causative novel variants and the characterization of a complex genetic architecture in a subset of families. Front Genet. 2020;11:1–14. doi: 10.3389/fgene.2020.00464. [DOI] [PMC free article] [PubMed] [Google Scholar]
- 52.Audrézet M-P, Corbiere C, Lebbah S, Morinière V, Broux F, Louillet F, et al. Comprehensive PKD1 and PKD2 mutation analysis in prenatal autosomal dominant polycystic kidney disease. J Am Soc Nephrol. 2016;27:722–9. doi: 10.1681/ASN.2014101051. [DOI] [PMC free article] [PubMed] [Google Scholar]
Associated Data
This section collects any data citations, data availability statements, or supplementary materials included in this article.
Supplementary Materials
Supplementary Table 1: Roche HeatSeq gene list
Supplementary Table 2: ACMG guidelines interpretation method
Supplementary Table 3: Supplementary Table 3: Genetic Diagnosis in patients in which a disease-causing variant of PKD was identified
Supplementary Table 4: KING and refined IBD results
Supplementary Table 5: Kinship scores and inferred relationships
Supplementary Table 7: ACMG and Mayo Clinic classifications assigned to each variant from the Rossetti dataset
Supplementary Table 8: Additional variants which satisfied the ACMG guidelines for variant pathogenicity
Supplementary Table 9: Clinical details of patients without a molecular diagnosis
Supplementary Table 10: Correponding protein domins for variants listed in Figure 2
Supplementary Table 11: Genetic scoring of nontruncating PKD1 and PKD2 variants scored as VUS by the ACMG classification employing the Mayo Research Mutation Classification Algorithm