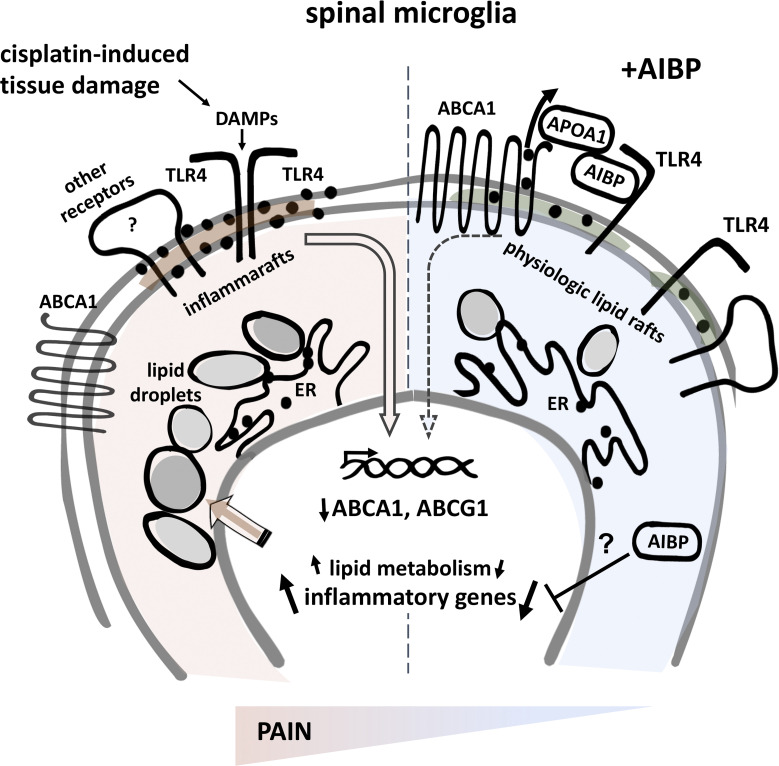
In a mouse model of chemotherapy-induced peripheral neuropathy, spinal microglia are characterized by the presence of inflammarafts—enlarged, cholesterol-enriched lipid rafts—which organize the inflammatory response. Manipulation of specific mechanisms regulating cholesterol metabolism normalizes inflammarafts and reprograms microglia, resulting in long-lasting alleviation of neuropathic pain.
Abstract
Neuroinflammation is a major component in the transition to and perpetuation of neuropathic pain states. Spinal neuroinflammation involves activation of TLR4, localized to enlarged, cholesterol-enriched lipid rafts, designated here as inflammarafts. Conditional deletion of cholesterol transporters ABCA1 and ABCG1 in microglia, leading to inflammaraft formation, induced tactile allodynia in naive mice. The apoA-I binding protein (AIBP) facilitated cholesterol depletion from inflammarafts and reversed neuropathic pain in a model of chemotherapy-induced peripheral neuropathy (CIPN) in wild-type mice, but AIBP failed to reverse allodynia in mice with ABCA1/ABCG1–deficient microglia, suggesting a cholesterol-dependent mechanism. An AIBP mutant lacking the TLR4-binding domain did not bind microglia or reverse CIPN allodynia. The long-lasting therapeutic effect of a single AIBP dose in CIPN was associated with anti-inflammatory and cholesterol metabolism reprogramming and reduced accumulation of lipid droplets in microglia. These results suggest a cholesterol-driven mechanism of regulation of neuropathic pain by controlling the TLR4 inflammarafts and gene expression program in microglia and blocking the perpetuation of neuroinflammation.
Graphical Abstract
Introduction
Regulation of cholesterol metabolism in the context of neurodegeneration and specifically Alzheimer’s disease (AD) received ample attention due in part to strong association between APOE polymorphism and the risk of AD. However, the role of cholesterol regulation as a factor in the development of chronic pain states remains unknown. Chemotherapy-induced peripheral neuropathy (CIPN) is one of the debilitating adverse effects of antineoplastic drug usage during cancer treatment, affecting over 50% of patients undergoing chemotherapy (Seretny et al., 2014). Neuroinflammation mediated by glial cell activation and infiltrating immune cells in the spinal cord and dorsal root ganglia (DRGs) is an important component of CIPN and other neuropathies (Lees et al., 2017; Makker et al., 2017). Glial cells express TLR4, which mediates secretion of inflammatory cytokines, chemokines, and bioactive lipids (Bruno et al., 2018; Gregus et al., 2018; Papageorgiou et al., 2016). In addition, CIPN-associated activation of TLR4 signaling has been reported in DRG nociceptors (Chen et al., 2017; Li et al., 2021). Systemic deficiency of TLR4 or its signaling adaptor molecules MyD88 and TRIF, alone or in combination, attenuates and prevents hyperalgesia and allodynia in mice treated with cisplatin (Hu et al., 2018; Pevida et al., 2013; Yan et al., 2019). However, the cell type in which TLR4 activation induces allodynia is unknown.
TLR4 receptors localize to and dimerize in membrane lipid rafts. The enlarged, cholesterol-rich lipid rafts harboring activated receptors and adaptor molecules—here designated as inflammarafts (Miller et al., 2020)—serve as an organizing platform to initiate inflammatory signaling and the cellular response. Regulation of cholesterol content in the plasma membrane can affect inflammarafts and TLR4 dimerization, signaling, and inflammatory response in various cell types (Karasinska et al., 2013; Tall and Yvan-Charvet, 2015; Yvan-Charvet et al., 2008). In addition to TLR4, inflammarafts regulate activation of numerous other receptors and components of signaling pathways, as reviewed in Miller et al. (2020). Thus, we hypothesized that CIPN was associated with altered cholesterol dynamics in spinal microglia, leading to inflammaraft formation and persistent neuroinflammation in the spinal cord.
To test this hypothesis, we measured spinal microglia lipid rafts and TLR4 dimerization in CIPN mice. To manipulate cholesterol dynamics, we used intrathecal (i.t.) injections of the apoA-I binding protein (AIBP), an effective multiplier of cholesterol removal from several cell types (Choi et al., 2018; Fang et al., 2013; Woller et al., 2018), and mice with inducible, microglia-specific knockdown of the cholesterol transporters Abca1 and Abcg1. We demonstrate that AIBP induces redistribution of cholesterol in the microglia membrane, enhancing colocalization of accessible cholesterol with the cholesterol transporter ABCA1. This redistribution sets conditions for cholesterol depletion from the plasma membrane and the reversal of inflammarafts back to physiological lipid rafts. Microglia-specific Abca1/Abcg1 knockdown induces pain in naive mice and prevents AIBP from reversing CIPN allodynia, highlighting the importance of microglial cholesterol homeostasis in the development of neuropathic pain. Furthermore, characterization of CIPN-associated changes in gene expression in microglia suggests impaired cholesterol metabolism.
Results
CIPN alters lipid rafts and TLR4 dimerization in spinal microglia
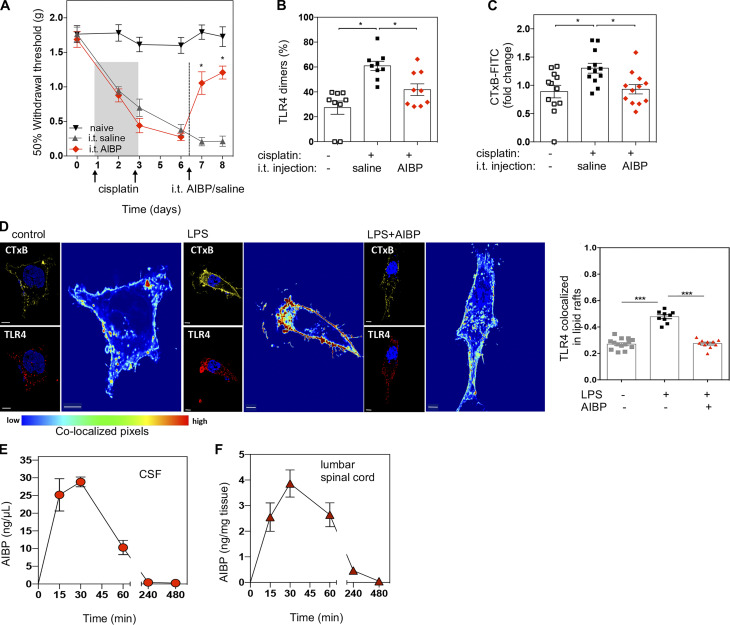
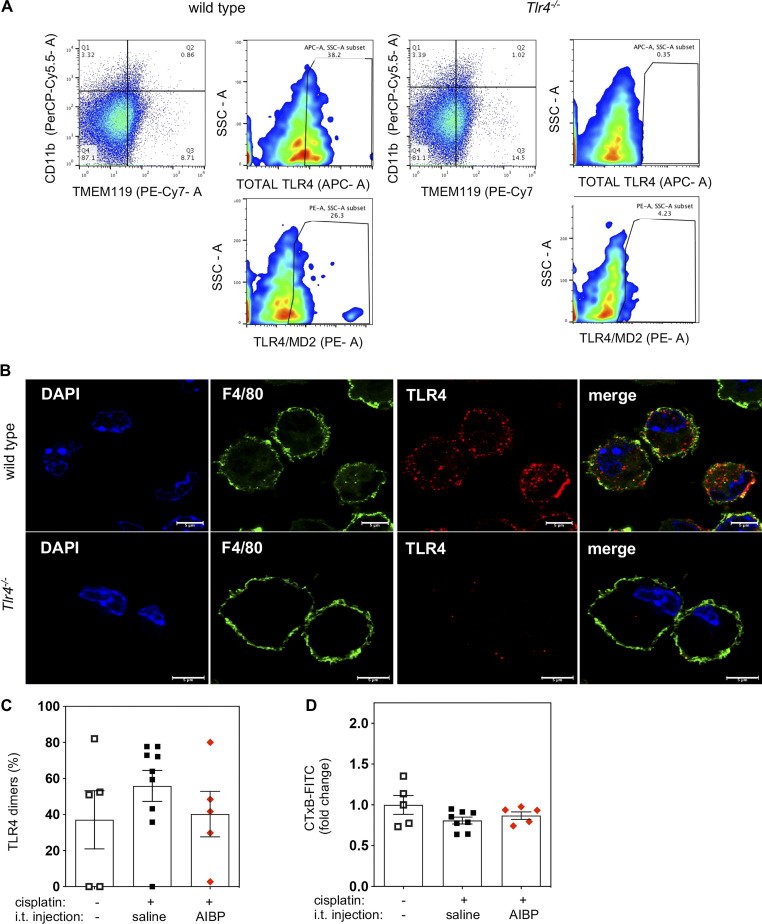
In a model of CIPN (Woller et al., 2018), i.p. injections of cisplatin induced severe tactile allodynia in male mice (Fig. 1 A). This condition was associated with increased formation of lipid rafts in spinal microglia, suggesting alterations in membrane cholesterol dynamics and increased dimerization of TLR4 (Fig. 1, B and C). Intrathecal AIBP reversed CIPN-associated allodynia and normalized lipid raft and TLR4 dimer levels in spinal microglia (Fig. 1, A–C). These data suggest that TLR4 receptor dimerization, which is the first step in the activation of a TLR4 inflammatory cascade, occurs in microglial lipid rafts, as is demonstrated in other cell types (Cheng et al., 2012; Zhu et al., 2010). This notion was supported in in vitro experiments in which localization of TLR4 in lipid rafts was significantly increased in BV-2 microglia cells treated with LPS, and AIBP prevented LPS-induced TLR4-CTxB colocalization (Fig. 1 D). The specificity of the TLR4 antibodies used in flow cytometry and microscopy experiments was verified with cells from Tlr4−/− mice (Fig. S1, A and B). Since macrophages in the DRG are also involved in the nociceptive response and express TLR4, we evaluated their TLR4 dimerization and lipid raft content. However, no significant changes were observed at this time point in the DRG CD11b+ myeloid cells (Fig. S1, C and D).
Figure 1.
CIPN alters TLR4 dimerization and lipid rafts in spinal microglia: Reversal by AIBP. (A) Withdrawal thresholds in WT mice in response to i.p. cisplatin (two injections of 2.3 mg/kg/d), followed by a single dose of i.t. saline (5 µl) or AIBP (0.5 µg/5 µl). Naive mice received no injections. Data from two independent experiments (n = 6 per group). (B and C) Analysis of CD11b+/TMEM119+ spinal microglia cells showing TLR4 dimerization (B) and lipid raft content measured by CTxB staining (C) 24 h after i.t. saline or AIBP (i.e., at day 8 of the time course shown in A). Data from three independent experiments (n = 9 per group for TLR4 dimerization and n = 12 for lipid raft staining). (D) BV-2 microglia cells were incubated for 30 min with AIBP (0.2 µg/ml) or vehicle in complete media, followed by a 5-min incubation with LPS (100 ng/ml). Scale bar, 5 µm. Bar graph shows Manders’ tM1 coefficient. (E and F) Pharmacokinetics of i.t. AIBP (2.5 µg/5 µl) in male Apoa1bp−/− mice in CSF (E) and lumbar spinal cord (F; n = 5). *, P < 0.05; ***, P < 0.001. Two-way ANOVA with Bonferroni post hoc test for multiple comparisons in grouped analyses; one-way ANOVA with Tukey post hoc test for multiple comparisons of three groups and imaging quantification.
Figure S1.
Validation of the specificity of TLR4 antibodies used for flow cytometry and microscopy and TLR4 dimerization and lipid rafts in DRG macrophages. (A) Flow cytometry of single-cell suspensions from spinal cords of WT and Tlr4−/− mice showing TLR4-APC and TLR4/MD2-PE antibody staining of CD11b+(PerCP-Cy5.5)/TMEM199+(Pe-Cy7) microglia. (B) Confocal images of peritoneal elicited macrophages from WT and Tlr4−/− mice costained with F4/80-FITC and TLR4-647 antibodies. Scale bar, 5 µm. (C and D) Flow cytometry analysis of CD11b+ DRG macrophage cells showing TLR4 dimerization (C) and lipid raft content measured by CTxB staining (D) 24 h after i.t. saline or AIBP (i.e., at day 8 of the time course shown in Fig. 1 A); data from two independent experiments (n = 5 for control and AIBP group and n = 9 for cisplatin i.t. saline group). SSC-A, side scatter-A. Mean ± SEM.
Short exposure of AIBP in cerebrospinal fluid (CSF) and spinal cord
A single i.t. dose of AIBP had a long-lasting therapeutic effect of reversing allodynia in CIPN mice, sustained for at least 2 mo (Woller et al., 2018). This can be explained either by AIBP long exposure in the spinal cord upon i.t. delivery or by a disease-modifying effect reflected in changes in the gene expression profile. To test the former, we measured the pharmacokinetics of AIBP in the CSF and lumbar spinal cord homogenates following i.t. delivery of recombinant AIBP. We used Apoa1bp−/− mice in these experiments to avoid cross-reactivity of the antibodies we use with endogenous mouse AIBP in the spinal cord tissue. This study demonstrated a short AIBP exposure in CSF and spinal cord tissue, with peak levels reached by 30 min and already undetectable after 4 h (Fig. 1, E and F). These results agree with recent reports of rapid clearance of macromolecules from the CSF (Ahn et al., 2019) and suggest that mitigation of TLR4 dynamics in the membrane and possibly other effects of AIBP result in reprogramming of spinal cord microglia and/or other cell types.
CIPN alters gene expression profile in spinal microglia
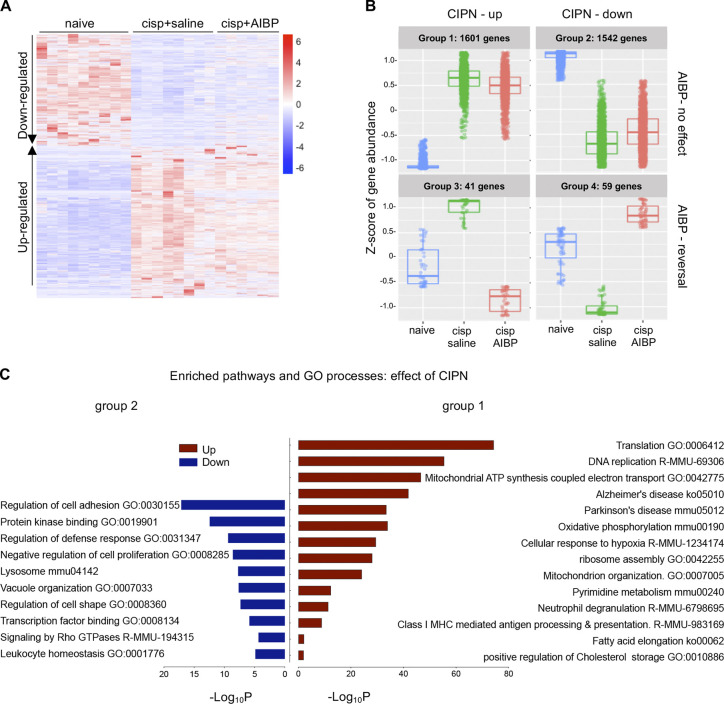
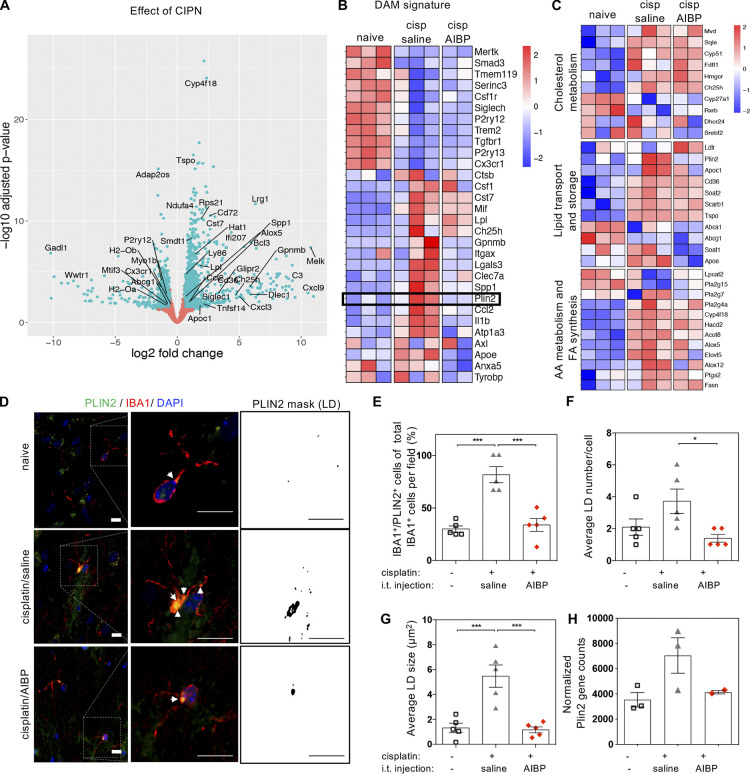
To characterize spinal microglia in CIPN, we performed RNA sequencing (RNA-seq) and differential gene expression analysis of the spinal microglia isolated from naive, cisplatin/saline–, and cisplatin/AIBP–treated WT mice (refer to Materials and methods, Data S1, and Fig. S2 for quality control [QC] and dataset characterization). We used a likelihood ratio test (LRT) to identify genes that were regulated by any condition across all samples and identified 3,254 differentially expressed genes (DEGs) that represent the main effect of CIPN and AIBP in spinal microglia transcriptome (Fig. 2 A). The majority of these changes were driven by the CIPN condition, with little effect of AIBP (Fig. 2, A and B, group 1 and group 2). However, there was a smaller group of CIPN-regulated genes in which changes were completely reversed by AIBP treatment (Fig. 2, A and B, group 3 and group 4). Among the pathways and Gene Ontology (GO) biological processes up-regulated in CIPN were replication, translation, and mitochondrial function. Several enriched pathways were related to microglial phenotype changes associated with central nervous system diseases such as Parkinson’s and AD (Fig. 2 C). Cholesterol transporters Abca1 and Abcg1 were down-regulated in microglia from cisplatin-treated mice, indicating membrane cholesterol trafficking impairment (Fig. 3, A and C). Among other down-regulated genes were lysosomal genes important in autophagy and lipophagy, which suggests lipid storage dysregulation. The arachidonic acid metabolism genes were also up-regulated (Fig. 3 C), suggesting the release of bioactive lipid mediators and inflammation.
Figure S2.
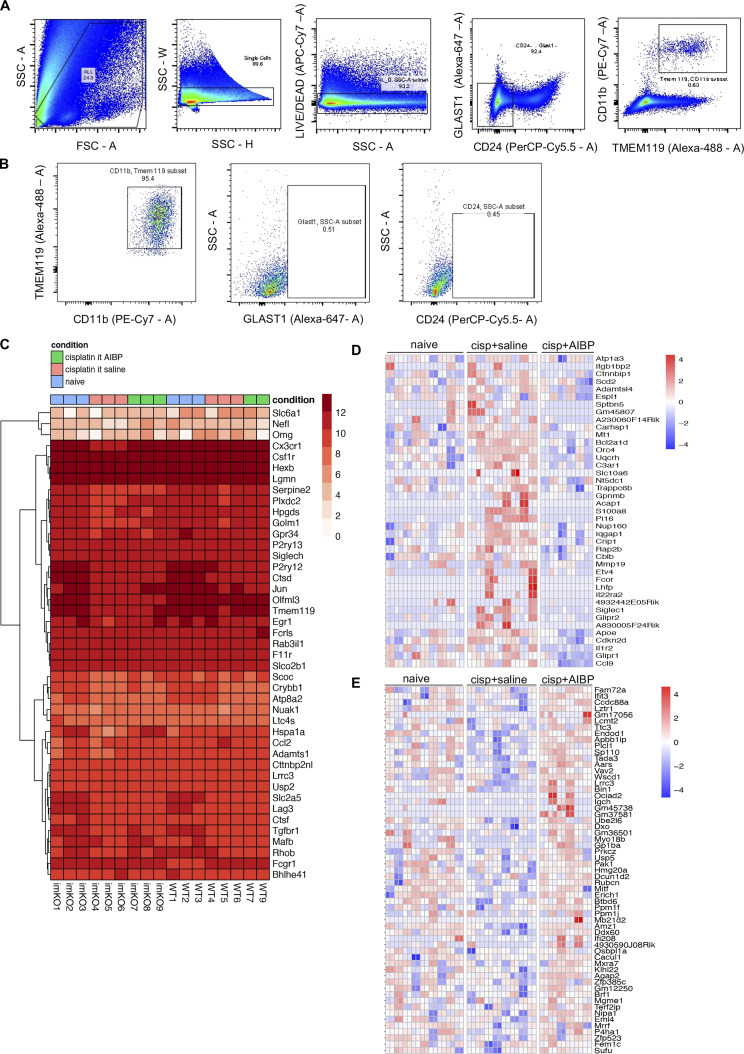
FACS sorting strategy, QC, and phenotypic controls for RNA-seq. (A) Sorting strategy for lumbar CD11b+TMEM119+ spinal microglia. (B) Flow cytometry analysis of sorted microglia measuring purity of sorted cells and absence of GLAST1+ astrocytes or CD24+ neurons. (C) Microglial linkage analysis with a heatmap of microglia-specific genes. Log+1 of normalized counts from all samples was calculated for the 40 microglia-specific genes listed in Butovsky et al. (2014), as well as for the three genes that are expressed at low levels in microglia but at high levels specifically in neurons (Nefl), oligodendrocytes (Omg), or astrocytes (Slc6a1). (D and E) Heatmaps of CIPN-repressed genes that were up-regulated by AIBP (group 4; D) and CIPN-induced genes that were down-regulated by AIBP (group 3) in WT mice (E). Log2 normalized gene counts scaled by row, and columns represent all technical replicates of the three biological samples. cisp, cisplatin; FSC-A, forward scatter-A; SSC-A, side scatter-A; SSC-H, side scatter-H; SSC-W, side scatter-W.
Figure 2.
Gene expression in spinal microglia of CIPN mice. (A and B) Microglia (CD11b+TEMEM119+) were FACS-sorted from three groups shown in Fig. 1 A: WT naive or injected with cisplatin (days 1 and 3) followed on day 7 by i.t. saline (5 µl) or AIBP (0.5 µg/5 µl), terminated on day 8, and subjected to RNA-seq; n = 3 biological replicates (mice) for naive and cisplatin/saline and n = 2 for cisplatin/AIBP (each biological replicate was collapsed from three technical replicates from the same animal). (A) Heatmap of DEGs across all samples (all technical replicates are presented in columns). Significant (adjusted P < 0.01) up- or down-regulated genes showing main effect tested by LRT. Log2 relative expression. (B) Groups of significant DEGs clustered based on expression profile patterns in different treatment conditions. (C) Pathway and GO enrichment analysis of up-regulated (group 1 in B) and down-regulated (group 2) genes induced by cisplatin treatment, using adjusted P < 0.05 and absolute fold change >1.5 and a minimum overlap of three genes in the pathway. Up-regulated pathways are shown in red and down-regulated in blue. cisp, cisplatin; GTPase, guanosine triphosphatase.
Figure 3.
DAM and lipid-related gene expression and lipid droplets in spinal microglia of CIPN mice. (A–C) Same groups as in Fig. 2. (A) Volcano plot of up-regulated and down-regulated genes in spinal microglia of cisplatin-treated versus naive mice. Cutoff of adjusted P < 0.05 and absolute fold change >1.5 represented in light green dots. (B) Heatmap depicting DAM signature genes. (C) Heatmap of log2 normalized gene counts scaled by row showing lipid-related gene sets. (D–H) Lipid droplet (LD) accumulation in spinal microglia (white arrowheads) measured by PLIN2 immunostaining in spinal cord sections costained with IBA1 and DAPI. Experimental conditions as in Fig. 1 A; n = 5 fields of view from five mice per group from two independent experiments. Scale bar, 20 µm. Mean ± SEM; *, P < 0.05; ***, P < 0.001, tested by one-way ANOVA with Tukey’s test for multiple comparisons in grouped analyses. cisp, cisplatin; AA, arachidonic acid; FA, fatty acid.
Using pairwise comparison of CIPN and naive groups after LRT analysis, we also observed down-regulation of Cx3cr1, P2ry12, and Tmem119 homeostatic markers (Fig. 3, A and B), a phenotype related to a transition to neurodegenerative disease-associated microglia (DAM; Masuda et al., 2019; Nugent et al., 2020; Prinz et al., 2019). A subset of the DAM signature genes revealed a DAM signature with reduction of homeostatic genes and increase of inflammatory and cholesterol metabolism genes. Regulation of the phagocytic TAM receptors Tyrobp, Axl, and Mertk partially mimicked DAM characteristics of neurodegenerative disease, except in CIPN microglia, where we observed down-regulation on Trem2 and not a significant effect on its partner receptor gene Tyrobp (Fig. 3 B), which suggests a less phagocytic phenotype associated with altered lipid homeostasis and increased lipid accumulation in macroglia and macrophages (Jaitin et al., 2019; Marschallinger et al., 2020).
Interestingly, the part of the DAM signature associated with lipid storage genes that were enriched in CIPN were down-regulated by AIBP (Fig. 3, B and C), including the gene encoding the lipid droplet protein PLIN2. The PLIN2 immunohistochemistry validated the RNA-seq results, showing increased number and size of lipid droplets in spinal microglia of cisplatin-treated mice and the reversal of this effect by AIBP (Fig. 3, D–H).
Selective reversal by AIBP of CIPN-induced changes in inflammatory gene expression
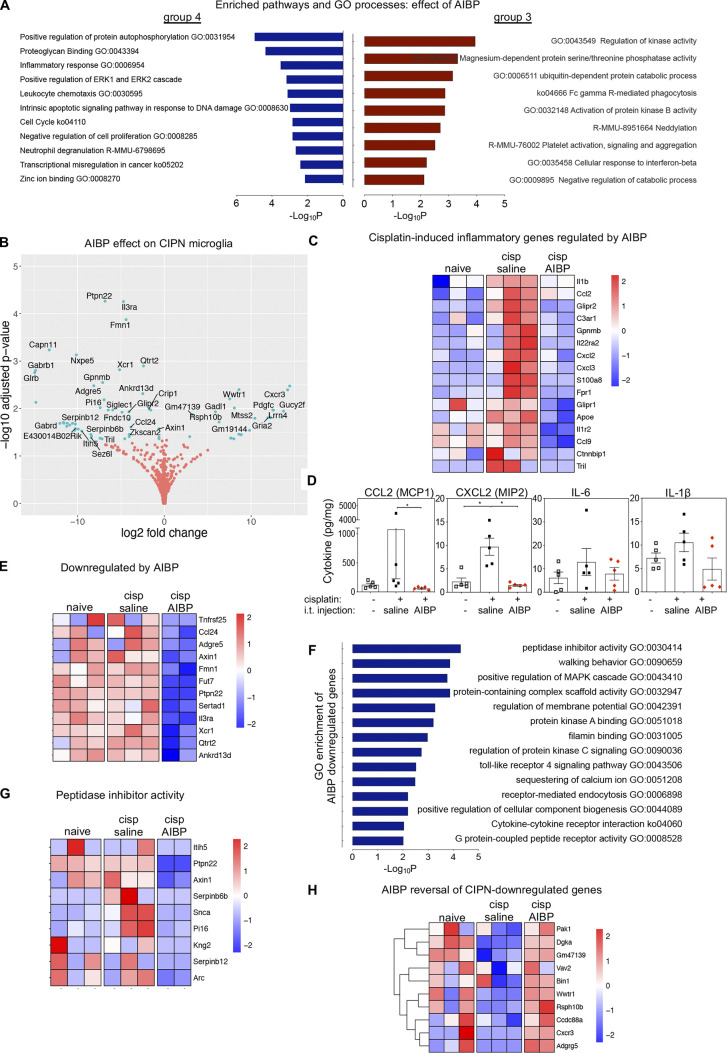
Analyzing the group of genes that was up-regulated by CIPN and reversed by AIBP (group 3 in Fig. 2 B and Fig. S2 F), we found enriched pathways of inflammatory response, leukocyte chemotaxis, and neutrophil degranulation pathways (Fig. 4 A). Some of the genes in these enriched pathways include Il1b, Ccl2, Glipr1, and Glipr2, Gpnmb, Cxcl2, Cxcl3, S100a8, Il22ra2, Il1r2, Fpr1, Apoe, Ccl9, and the TLR4 interactor gene Tril (Fig. 4, B and C). Examining cytokine protein expression in spinal cord tissue, we confirmed regulation of CCL2 (MCP-1) and CXCL2 (MIP2) expression by AIBP (Fig. 4 D). AIBP also down-regulated inflammatory and noninflammatory genes that were not induced by cisplatin. These include Ccl24, Il3ra, Xcr1, and the TLR4 pathway–related gene Ptpn22 (Fig. 4 E). The pathway and GO analysis of all genes down-regulated by AIBP show enrichment in the TLR4 signaling pathway, together with cytokine–cytokine receptor interaction, protein kinase A and C, and MAPK regulation pathways, receptor-mediated endocytosis, and other membrane signaling pathways (Fig. 4 F). Regulation of calcium and membrane potential were also down-regulated, and enrichment of the peptidase inhibitor pathway shows AIBP effect in recently reported pain-associated peptidase inhibition–related genes, such as Pi16, α-synuclein gene Snca, and Arc, which interacts with lipid membranes and regulates vesicle trafficking and neurotransmitter release (Fig. 4 G).
Figure 4.
Gene expression in spinal microglia of CIPN mice: Effect of AIBP. (A–H) Experimental conditions and analysis as in Fig. 1; n = 2 or 3 biological replicates per group (each biological replicate collapsed from three technical replicates). (A) Pathway and GO enrichment analyses of CIPN–up-regulated genes that were down-regulated by AIBP (group 3 in Fig. 2 B) and CIPN–down-regulated genes that were up-regulated by AIBP (group 4), using adjusted P < 0.05 and absolute fold change >1.5 and a minimum overlap of three genes in the pathway. Up-regulated pathways are shown in red and down-regulated in blue. (B) DEGs in spinal microglia induced by i.t. AIBP. Adjusted P < 0.05 and Benjamini–Hochberg FDR <5% represented in a volcano plot of up- and down-regulated genes in cisplatin/AIBP– versus cisplatin/saline–treated mice. Cutoff-adjusted P < 0.05 and absolute fold change >1.5 shown in light green dots. (C) Heatmap of inflammatory genes in group 3 up-regulated in CIPN and down-regulated by AIBP. (D) Cytokine protein expression in spinal tissue from WT naive, cisplatin/saline, and cisplatin/AIBP groups; n = 5 per group. (E) Heatmap of inflammatory genes not induced by cisplatin but down-regulated by AIBP. (F) Pathway and GO enrichment analysis of all genes down-regulated by AIBP using adjusted P < 0.05 and absolute fold change >1.5 and a minimum overlap of three genes in a pathway. (G) Heatmap of noninflammatory genes down-regulated by AIBP included in the most enriched pathway: peptidase inhibitor activity pathway. (H) Heatmap of genes whose down-regulation in CIPN was reversed by AIBP. Mean ± SEM; *, P < 0.05 compared with naive group and cisplatin/i.t. saline group. cisp, cisplatin.
Differential expression analysis of microglia from AIBP-treated mice in the CIPN model also revealed 40 genes that were down-regulated in CIPN and reversed by AIBP (Fig. S2 E). Pathways enriched included regulation of kinase and phosphatase activity (Fig. 4 A) and actin cytoskeleton, membrane reorganization, and nuclear signaling genes Bin1, Pak1, Vav2, and Ccdc88a and the membrane lipid signaling cascade–associated protein Dgka (Fig. 4 H). Overall, these results suggest that the AIBP reversal of microglia reprogramming induced in CIPN mice involves regulation of lipid metabolism and trafficking from the membrane to lipid droplets and/or extracellular acceptors.
AIBP cannot reverse allodynia in mice with ABCA1/ABCG1–deficient microglia
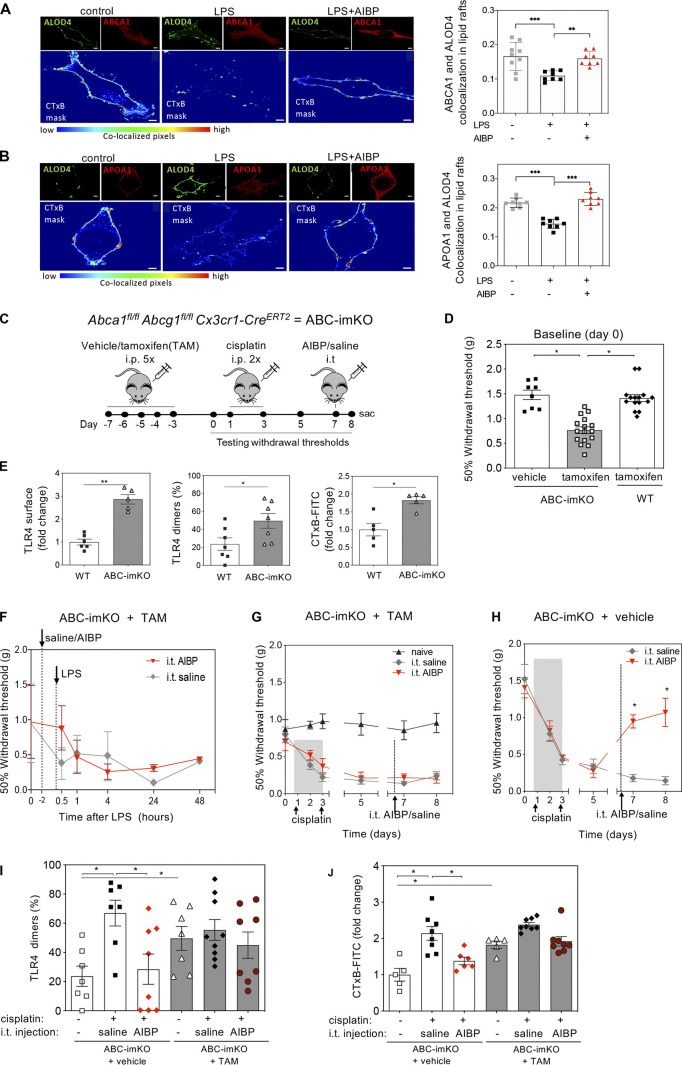
To evaluate the role of microglial cholesterol dynamics in nociception, we first measured colocalization of the ABCA1 cholesterol transporter with the membrane cholesterol accessible for efflux or transport to the endoplasmic reticulum as detected by binding of ALOD4 (He et al., 2017). Treatment of BV-2 cells with LPS decreased colocalization of ALOD4 with ABCA1 and APOA1 in lipid raft domains, and this effect was reversed by AIBP (Fig. 5, A and B).
Figure 5.
ABCA1 and ABCG1 expression in microglia controls nociception and is required for AIBP-mediated reversal of allodynia in a mouse model of CIPN. (A and B) BV-2 cells were incubated for 30 min with AIBP (0.2 µg/ml) or vehicle in complete media, followed by a 5-min incubation with LPS (100 ng/ml). Colocalization of accessible cholesterol with ABCA1 (A) and APOA1 (B) in lipid rafts. Scale bar, 7 µm. Bar graphs show Manders’ tM1 coefficient. (C) Experimental design and timeline: Tamoxifen (TAM, 10 mg/ml, 200 µl/d), cisplatin (2.3 mg/kg), AIBP (0.5 µg/5 µl), or saline (5 µl). (D) Baseline (day 0) withdrawal thresholds before the start of cisplatin intervention. Data from three independent experiments (n = 8 for vehicle-treated ABC-imKO mice; n = 16 for TAM-treated ABC-imKO mice, and n = 15 for littermates Abca1fl/fl Abcg1fl/fl no-Cre [WT] mice treated with TAM). (E) TLR4 surface expression and dimerization and lipid rafts (CTxB) in CD11b+TMEM119+ spinal microglia of naive WT and ABC-imKO mice at baseline (day 0; n = 5 for TLR4 surface expression and lipid raft content analysis for both groups, n = 8 for WT, and n = 9 for ABC-imKO for TLR4 dimerization). (F) Withdrawal thresholds after i.t. saline or AIBP (0.5 µg/5 µl), followed by i.t. LPS (0.1 µg/5 µl) in TAM-induced ABC-imKO mice (n = 4 per group). (G and H) Withdrawal thresholds following i.p. cisplatin and i.t. saline or AIBP (0.5 µg/5 µl) injections in TAM-induced ABC-imKO (G) and noninduced (vehicle) ABC-imKO (H) mice (n = 6 per group); data from two independent experiments. (I and J) TLR4 dimerization (I) and lipid rafts (J) in CD11b+TEMEM119+ spinal microglia at day 8 in the groups shown in G and H. Mean ± SEM (n = 7 or 8) from two independent experiments. *, P < 0.05; **, P < 0.01; ***, P < 0.001. Two-way ANOVA with Bonferroni post hoc test for multiple comparisons in time course analysis; t test for two groups, and one-way ANOVA with Tukey post hoc test for multiple comparisons of more than two groups. sac, sacrificed.
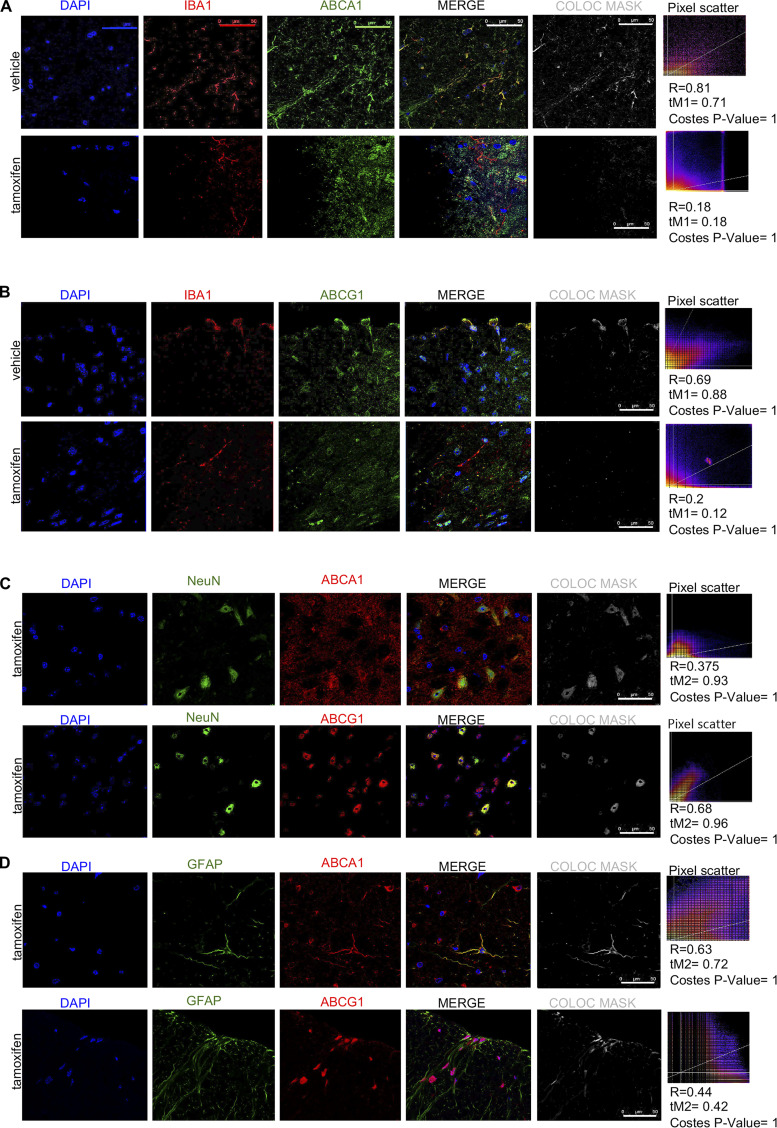
Next, we generated tamoxifen-inducible, microglia-specific ABCA1 and ABCG1 double-KO mice (ABC-imKO; Fig. 5 C) and validated that the ABCA1 and ABCG1 knockdown was observed in spinal cord IBA1+ microglia but not in GFAP+ astrocytes or NeuN+ neurons (Fig. S3). Knocking down ABCA1 and ABCG1 cholesterol transporters in microglia resulted in the development of basal allodynia (day 0) without any stimulatory challenge (Fig. 5 D). These results add to the evidence that the impairment of microglial cholesterol trafficking leads to a facilitated state. Indeed, we observed that spinal microglia from naive ABC-imKO mice had an increased surface expression of TLR4, increased TLR4 dimerization, and higher lipid raft content compared with that in WT mice (Fig. 5 E).
Figure S3.
Validation of ABCA1 and ABCG1 KO in spinal microglia of tamoxifen-induced ABC-imKO mice. (A–D) Immunohistochemistry of spinal cord frozen sections from vehicle- and tamoxifen-induced ABC-imKO mice, showing colocalization (COLOC) of ABCA1 and ABCG1 staining with IBA1 (microglia), NeuN (neurons), and GFAP (astrocytes). Slides were mounted with Prolong Gold with DAPI. Confocal images were acquired with a 63× objective and analyzed with ImageJ software for colocalization. Colocalization masks and Pearson’s R values, Manders’ colocalization coefficients above threshold, and randomization Costes P values were calculated as described in Materials and methods for at least one slide for each animal in the experiment. Representative images and values shown correspond to one animal per condition. Scale bar, 50 µm.
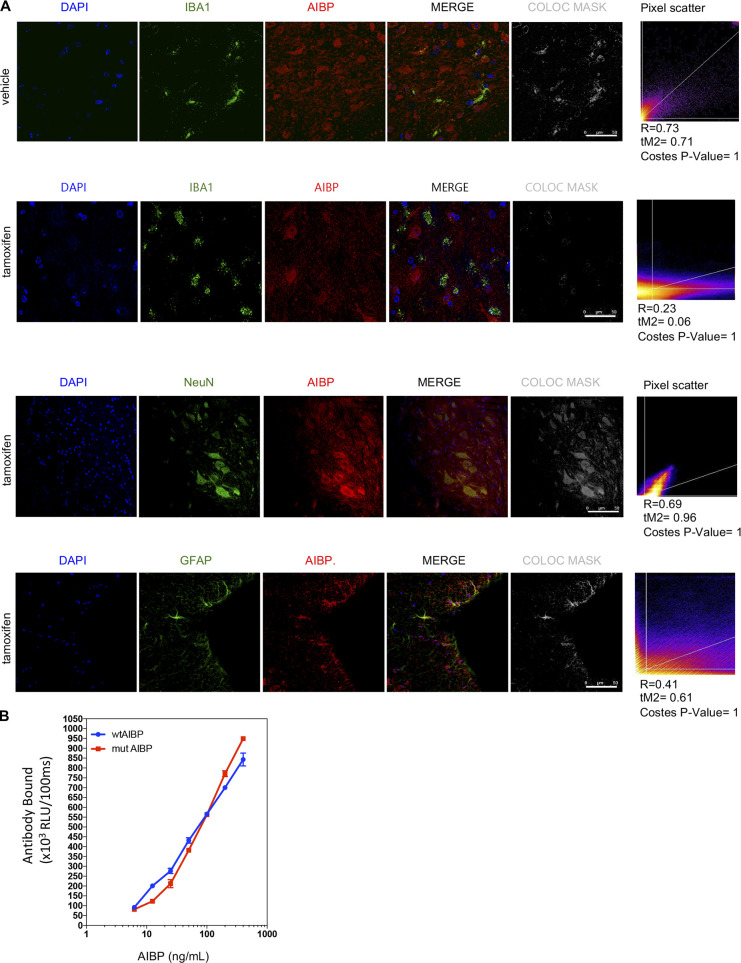
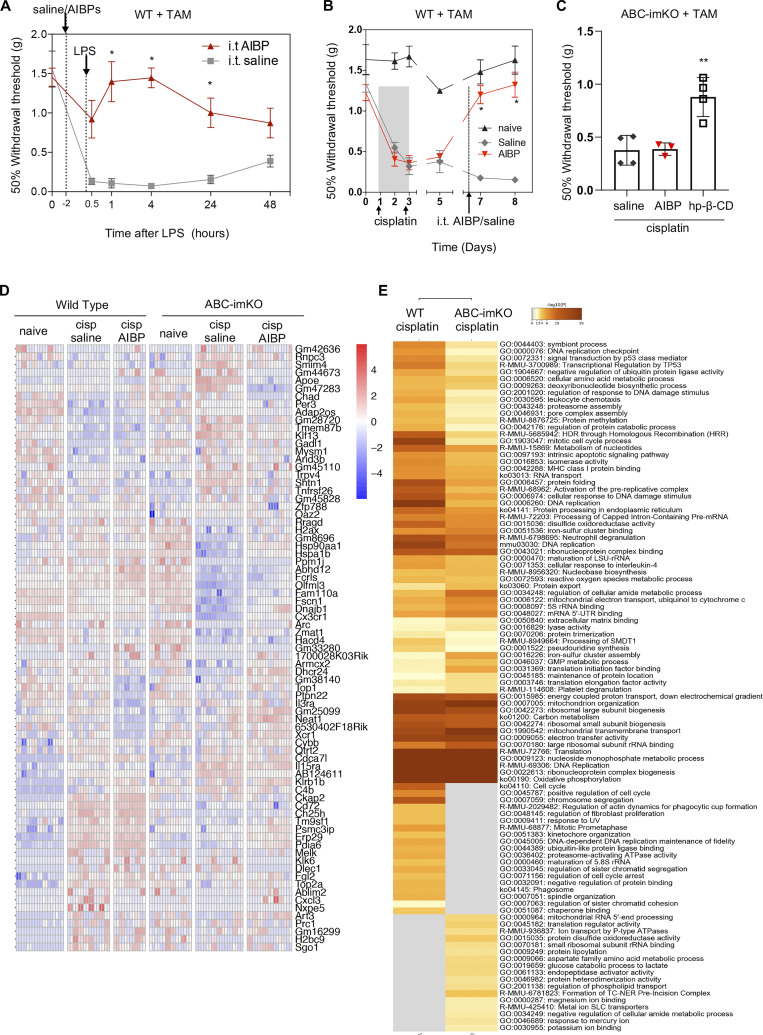
Remarkably, unlike in WT mice, i.t. AIBP was unable to prevent mechanical allodynia induced by i.t. LPS in ABC-imKO mice (Fig. 5 F and Fig. S5 A). We then induced CIPN in ABC-imKO mice with cisplatin and observed further rapid onset of allodynia. Furthermore, i.t. delivery of AIBP in ABC-imKO mice at day 7 of the CIPN model did not reverse mechanical allodynia (Fig. 5 G), whereas i.t. AIBP was effective in reversing CIPN allodynia in transgenic (littermates) mice treated with vehicle instead of tamoxifen (Fig. 5 H) and in WT mice treated with tamoxifen (Fig. S5 B). An i.t. injection of 2-hydroxypropyl-β-cyclodextrin (hp-β-CD), which depletes cholesterol from the plasma membrane but does not require ABCA1 or ABCG1 expression, did alleviate allodynia in ABC-imKO mice (Fig. S4 C). In naive ABC-imKO mice, TLR4 dimerization and lipid raft abundance were significantly higher than in naive WT mice, and they were not significantly altered by cisplatin or by AIBP in ABC-imKO microglia (Fig. 5, I and J). These results support the notion that AIBP requires cholesterol transporters to modify inflammarafts and TLR4 dimerization dynamics in microglia and to reverse allodynia.
Figure S5.
Validation of AIBP KO in spinal microglia of tamoxifen-induced AIBP-imKO mice and BE-1 mAb for AIBP detection. (A) Immunohistochemistry of spinal cord frozen sections from vehicle- and tamoxifen-induced AIBP-imKO mice showing colocalization (COLOC) of AIBP staining with IBA1 (microglia), NeuN (neurons), and GFAP (astrocytes). Slides were mounted with Prolong Gold with DAPI. Confocal images were acquired with a 63× objective and analyzed with ImageJ software for colocalization. Colocalization masks and Pearson’s R values, Manders’ colocalization coefficients, and randomization Costes’ P values were calculated as described in Materials and methods for at least one slide for each animal in the experiment. Representative images and values shown correspond to one animal per condition. Scale bar, 50 µm. (B) Sandwich ELISA using BE-1 as a capture antibody in a microtiter plate. Dose-response curves to wtAIBP and mutAIBP were detected using a rabbit polyclonal anti-AIBP antibody. Mean ± SEM. No statistical differences were found for BE-1 affinity to wtAIBP and mutAIBP using two-way ANOVA with Bonferroni post hoc test for multiple comparisons. RLU, relative light units.
Figure S4.
Tamoxifen WT controls for LPS- and CIPN-induced allodynia and RNA-seq data for ABC-imKO–dependent regulated genes and cisplatin effect on ABC-imKO versus WT mice. (A and B) As a control for ABC-imKO mice, in-house–bred WT littermate mice were subjected to the tamoxifen regimen (TAM, 200 µl/d, 10 mg/ml, 5 consecutive days), followed by i.t. injection of AIBP (0.5 µg/5 µl) or saline (5 µl) and i.t. LPS (0.1 µg/5 µl) 2 h later (n = 4 for i.t. saline and n = 5 for i.t. AIBP; A) and i.p. injections of cisplatin (2.3 mg/kg) on day 1 and day 3, followed by i.t. injection of AIBP (0.5 µg/5 µl) or saline (5 µl) on day 7 (n = 4 per group; B). Tactile allodynia (withdrawal thresholds) was measured using von Frey filaments. Mean ± SEM; *, P < 0.05. Two-way ANOVA with Bonferroni post hoc test for multiple comparisons in time course analysis. (C) ABC-imKO mice were injected with TAM and then cisplatin as above, followed by i.t. saline (5 µl), AIBP (0.5 µg/5 µl), or 2-hydroxypropyl-β-cyclodextrin (hp-β-CD; 0.25 mg/5 µl) on day 7. Shown are tactile thresholds 24 h after the i.t. injection. Mean ± SEM (n = 3 or 4 per group). **, P < 0.01. One-way ANOVA with Dunnett's multiple comparisons test. (D) Heatmap of differentially regulated genes across all conditions (naive, induced by cisplatin/saline or cisplatin/AIBP) regulated in an ABC-imKO manner. All significant genes from LRT using a reduced model without interaction term (condition: genotype). Log2 normalized gene counts scaled by row and columns represent all technical replicates of the two or three biological samples from each group. (E) Heatmap of pathway enrichment of cisplatin up-regulated genes in WT and ABC-imKO microglia using cutoff P < 0.05, enrichment >1.5, and a minimum overlap of three genes in the pathway. Heatmap depicts common and specific pathways enriched by cisplatin in both genotypes. ATPase, adenosine triphosphatase; cisp, cisplatin; rRNA, ribosomal RNA; UTR, untranslated region; HDR, homology-directed repair; LSU, large subunit; GMP, guanosine monophosphate; TC-NER, transcription-coupled nucleotide excision repair; SLC, solute carrier.
ABCA1/ABCG1 deficiency reprograms microglia to a CIPN-like phenotype
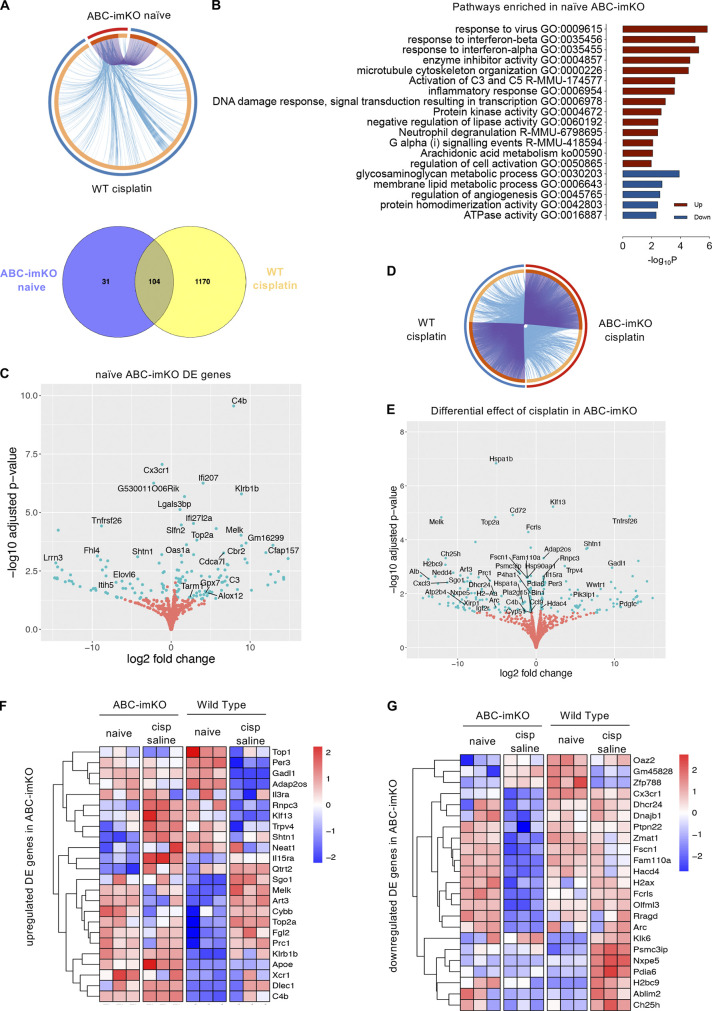
To understand the effect of cholesterol transport in transcriptional changes induced by CIPN and AIBP, we analyzed differential gene expression in ABC-imKO microglia. We identified 121 genes that changed significantly across two genotypes and three experimental conditions (Fig. S4 D). In spinal microglia from naive, not challenged with cisplatin ABC-imKO mice, most of the up-regulated genes and enriched pathways overlapped with the up-regulated genes induced by cisplatin in WT mice (Fig. 6, A and B). Among enriched pathways in naive ABC-imKO mice, we identified response to interferon, inflammatory response, complement activation, and arachidonic acid metabolism pathways (Fig. 6 B). Up-regulated interferon genes included Ifi207 and Ifi27l2a and inflammatory genes Xcr1, Cb4, C3, and Klrb1b. Lipid metabolism–related genes Apoe and Ch25h were significantly up-regulated in naive ABC-imKO, similar to the changes induced by cisplatin in WT mice (Fig. 6, C and F). This microglia reprogramming might explain, at least in part, the pain behavior observed in naive ABC-imKO mice.
Figure 6.
Gene expression in spinal microglia of ABC-imKO mice. Microglia (CD11b+TEMEM119+) were FACS-sorted from three groups of ABC-imKO mice: naive or injected with cisplatin (days 1 and 3), followed on day 7 by i.t. saline (5 µl) or AIBP (0.5 µg/5 µl), and terminated on day 8; n = 3 biological replicates (each biological replicate collapsed from three technical replicates). RNA-seq datasets from ABC-imKO and WT (not littermates) mice were acquired in the same experiment. (A) Top: Overlapping genes (purple lines) and pathways (blue lines) induced in naive ABC-imKO microglia and shared with WT microglia in mice treated with cisplatin showed in purple lines connecting overlapping genes and in blue lines connecting the overlapping enriched pathways. Bottom: Venn diagram of up-regulated genes in spinal microglia from WT cisplatin and ABC-imKO naive mice. (B) Enrichment pathway analysis of up- and down-regulated genes induced by ABCA1 and ABCG1 knockdown in microglia, using cutoff P < 0.05, enrichment >1.5, and a minimum overlap of three genes in the pathway. (C) DEGs in naive spinal microglia of TAM-induced ABC-imKO mice. Adjusted P < 0.05 and Benjamini–Hochberg FDR <5%. (D) Overlapping genes and pathways induced by cisplatin treatment in ABC-imKO microglia and shared with WT microglia in mice treated with cisplatin. (E) DEGs in spinal microglia of cisplatin-treated, TAM-induced ABC-imKO mice compared with cisplatin-treated WT mice. Adjusted P < 0.05 and Benjamini–Hochberg FDR <5%. (F and G) Heatmap of DEGs up-regulated (F) or down-regulated (G) in ABC-imKO microglia either in naive or cisplatin condition. cisp, cisplatin.
Induction of CIPN in ABC-imKO mice also up-regulated several sets of genes and pathways common for both ABC-imKO and WT microglia. However, unlike in WT, such pathways as phagosome, actin dynamics for phagocytic cup formation, and cell cycle pathways were not enriched in ABC-imKO microglia of cisplatin-treated mice (Fig. 6 D and Fig. S5 E). Cisplatin in ABC-imKO microglia failed to induce expression of several inflammatory genes and down-regulated expression of Cxcl3, Xrip1, and phagosome-related Fcrls and Cybb (NOX2) (Fig. 6, F and G). In the absence of cholesterol transporters, cisplatin did not induce cholesterol synthesis pathway genes and down-regulated Ch25h and Dhcr24, suggesting that excess of free cholesterol was present to favor accumulation of desmosterol (Fig. 6, E and G), which is a liver X receptor (LXR) agonist and a key regulator of macrophage foam cell transcriptome in atherosclerosis (Spann et al., 2012). Impaired phagocytosis and up-regulation of Tnfrsf26, Trpv4, Il3ra, Il15a, and Shtn1 (Fig. 6, E–G) may indicate a differential role of membrane dynamics for nociceptive processes in ABC-imKO mice.
Microglial reprogramming by AIBP is dependent on ABCA1 and ABCG1 expression
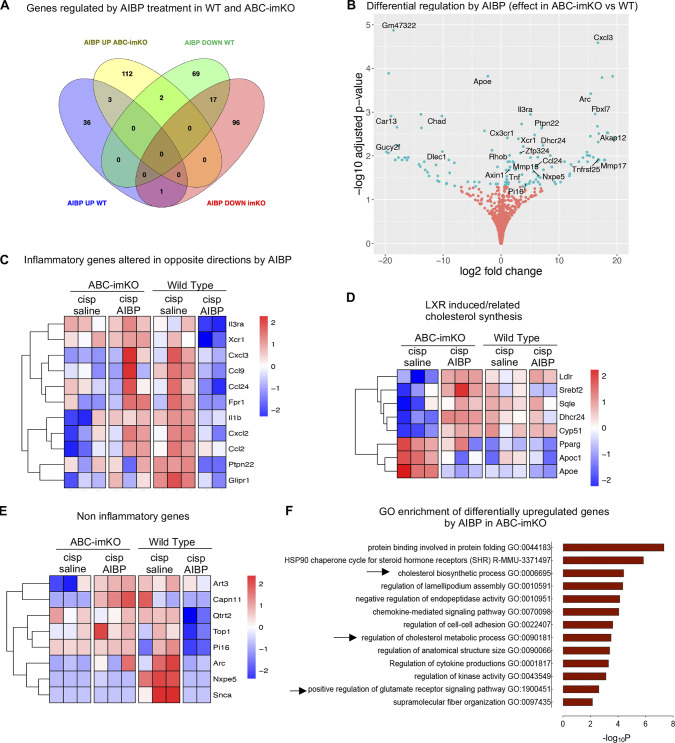
To understand the differential effect of AIBP in WT and ABC-imKO mice, we compared up- and down-regulated genes induced by AIBP treatment in both genotypes (Fig. 7, A and B). The effect of AIBP on gene regulation was remarkably different, with only a few common genes down-regulated in both genotypes (Fig. 7 A). In the absence of cholesterol trafficking machinery, AIBP failed to down-regulate inflammatory genes and instead induced their expression (Fig. 7, B and C). Induction of inflammatory genes correlated with increased Dhcr24 and other cholesterol biosynthetic genes, including Srebf2, which were down-regulated in WT microglia (Fig. 7 D). This suggests that reduced desmosterol and increased cholesterol content regulate inflammatory gene expression in microglia. In agreement, induction of genes controlled by LXR, such as Apoe, Apoc1, and Pparg, was observed in microglia of ABC-imKO but not WT mice (Fig. 7 D). Other noninflammatory genes regulated in opposite direction in ABC-imKO by AIBP compared with WT include endopeptidase activity genes Pi16 and Capn11 and the α-amino-3-hydroxy-5-methyl-4-isoxazolepropionic acid (AMPA) receptor and synaptic regulator Arc (Fig. 7 E). In ABC-imKO microglia, AIBP up-regulated cholesterol metabolism pathways, cytokine release and chemokine signaling regulation, kinase and endopeptidase activity, and lamellipodia and fiber organization pathways (Fig. 7 F). Most of these pathways were down-regulated by AIBP in WT microglia (Fig. 4 F). Altogether, these data indicate that reprogramming of microglial gene expression induced by AIBP is dependent on cholesterol homeostasis regulated by the cholesterol transporters ABCA1 and ABCG1.
Figure 7.
Microglial reprogramming by AIBP is dependent on ABCA1/ABCG1 expression. (A) Venn diagram comparing the effect of AIBP treatment on gene expression in WT and ABC-imKO mice in which CIPN was induced by cisplatin. (B) Volcano plot representation of up- and down-regulated genes by AIBP treatment in CIPN comparing AIBP effect on ABC-imKO versus WT mice. Cutoff of adjusted P < 0.05 and absolute fold change >1.5 shown in light green dots. (C) Heatmap of log2 normalized gene counts of inflammatory genes altered by AIBP in an ABC-dependent manner (down-regulated by AIBP in WT microglia but up-regulated by AIBP in ABC-imKO. (D) Heatmap of cholesterol synthesis and LXR-related genes comparing cisplatin and AIBP effect in WT and ABC-imKO. (E) Heatmap of noninflammatory genes regulated by AIBP in an ABC-dependent manner. (F) Enrichment pathway analysis of up-regulated genes by AIBP in ABC-imKO microglia, using cutoff P < 0.05, enrichment >1.5, and a minimum overlap of three genes in the pathway. Black arrows highlight cholesterol-related pathways and signaling pathway related to neurotransmitter regulation. cisp, cisplatin.
Microglial AIBP and TLR4 regulate nociception
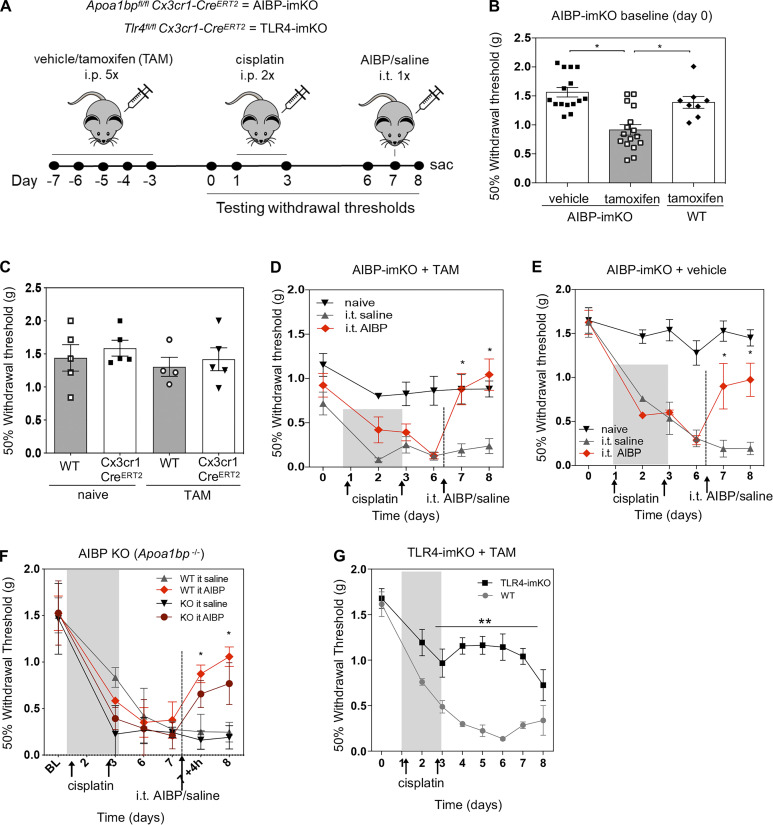
Because the above experiments implicated AIBP-regulated cholesterol homeostasis and activation of microglial TLR4 in nociception, we asked whether microglia-specific KO of AIBP or TLR4 will affect CIPN allodynia. We generated tamoxifen-inducible, microglia-specific Apoa1bp and Tlr4 KO mice (AIBP-imKO and TLR4-imKO; Fig. 8 A). Knocking down endogenous AIBP in microglia induced mechanical allodynia even before the mice were challenged with cisplatin (day 0; Fig. 8 B). This suggests that AIBP plays a role in the maintenance of microglia homeostatic function in mechanical nociception. In control Cx3cr1-CreERT2 mice with no floxed genes, injections of tamoxifen induced no mechanical allodynia (Fig. 8 C). After cisplatin challenge, microglia AIBP knockdown resulted in a faster reduction in mechanical thresholds than in control mice (compare day 2 in Fig. 8 D with day 6 in Fig. 8 E), indicating higher sensitization in microglia AIBP knockdown mice. Intrathecal injection of recombinant AIBP on day 7 equally reversed CIPN-associated allodynia in both vehicle and tamoxifen-induced AIBP-imKO mice (Fig. 8, C and D). In the whole-body Apoa1bp KO mice, we did not observe basal allodynia compared with WT mice, and i.t. AIBP rescued CIPN-induced allodynia (Fig. 8 F). In contrast to AIBP-imKO or ABC-imKO, the TLR4-imKO mice were protected from the rapid onset of cisplatin-induced allodynia and showed delayed and less severe allodynia (Fig. 8 G), suggesting the role of TLR4 expression in microglia in mediating pain sensitization.
Figure 8.
Endogenous AIBP and TLR4 in microglia are important in nociception. (A) Experimental design and timeline. Tamoxifen (TAM, 10 mg/ml, 200 µl/d), cisplatin (2.3 mg/kg/d), AIBP (0.5 µg/5 µl), and saline (5 µl). (B) Baseline (day 0 in A) withdrawal thresholds before the start of cisplatin intervention. Mean ± SEM (n = 15 for vehicle-treated and n = 16 for TAM-treated AIBP-imKO mice and n = 8 for littermates Apoa1bpfl/fl no-Cre [WT] mice treated with TAM). (C) WT and Cx3cr1-CreERT2 (no floxed genes) mice were tested for withdrawal threshold before (naive, day −7 in A timeline) and after (TAM, day 0) tamoxifen injection regimen (10 mg/ml, 200 µl/d for 5 d). n = 5 per group. One animal was found dead for WT +TAM group. No statistical differences were found. (D-F) Withdrawal thresholds following i.p. cisplatin and i.t. saline or AIBP injections in TAM-induced AIBP-imKO mice (D; n = 6 or 7, data from two independent experiments), noninduced (vehicle) AIBP-imKO mice (E; n = 4 or 5, data from two independent experiments), and bred in-house whole-body AIBP KO mice (F; n = 4 per group). (G) Withdrawal thresholds in WT and tamoxifen-induced TLR4-imKO mice following cisplatin injections (n = 4 for bred in-house WT and n = 7 for TLR4-imKO mice). Mean ± SEM; *, P < 0.05; **, P < 0.01. Two-way ANOVA with Bonferroni post hoc test for multiple comparisons in grouped analyses; one-way ANOVA with Tukey post hoc test for multiple comparisons of more than two groups. sac, sacrificed.
Identification of an AIBP domain responsible for TLR4 binding
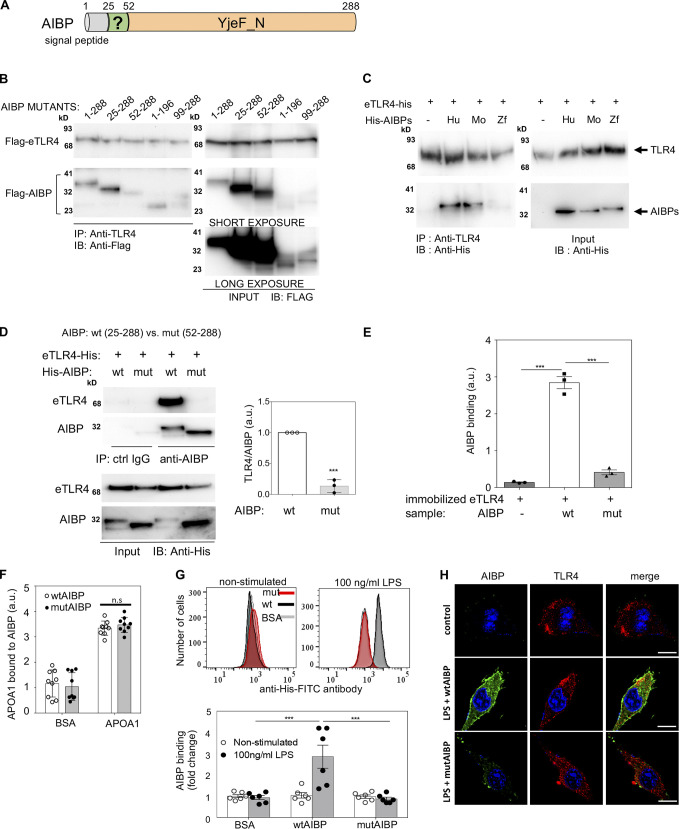
Because TLR4-imKO mice were protected from early/acute CIPN (Fig. 8 G), we were unable to use this model to evaluate the in vivo significance of AIBP-TLR4 binding we reported previously (Woller et al., 2018). Here, we took a different approach and made an AIBP mutant that did not bind TLR4. To elucidate which domain in AIBP is responsible for binding to TLR4, we started from mutating amino acids predicted from the crystal structure (Jha et al., 2008) of the YjeF_N domain of AIBP (Fig. 9 A) to participate in protein–protein interaction, but these mutants retained TLR4-binding properties (not shown). Next, we developed a series of deletion mutants of AIBP scanning the full length of the protein and tested them in a pull-down assay with the TLR4 ectodomain (eTLR4; Fig. 9 B). These experiments suggested that a 25–51 aa N-terminal domain, located behind the aa 1–24 signal peptide, is involved in eTLR4 binding (Fig. 9, A and B). The aa 25–51 N-terminal domain was unstructured in the published crystal structure of mouse AIBP (Jha et al., 2008). Human and mouse AIBP both contain the homologous aa 25–51 N-terminal domain, but zebrafish AIBP does not. Indeed, unlike human and mouse, zebrafish AIBP did not bind human eTLR4 (Fig. 9 C). For further experiments, we expressed and purified from a baculovirus/insect cell system human WT AIBP (wtAIBP; aa 25–288) lacking the signal peptide and mutant AIBP (mutAIBP; aa 52–288) lacking both the signal peptide and the N-terminal domain.
Figure 9.
Identification of the domain in the AIBP molecule responsible for TLR4 binding. (A) Human AIBP: signal peptide (aa 1–24), previously uncharacterized N-terminal domain (aa 25–51), and YjeF_N domain (aa 52–288). (B) Flag-tagged deletion mutants of human AIBP were coexpressed in HEK293 cells with the Flag-tagged eTLR4. Cell lysates were immunoprecipitated (IP) with an anti-TLR4 antibody and immunoblotted (IB) with an anti-Flag antibody. (C) His-tagged human (Hu), mouse (Mo), and zebrafish (Zf) AIBP, all lacking the signal peptide expressed in a baculovirus/insect cell system, were combined in a test tube with eTLR4-His, followed by IP with an anti-TLR4 antibody and IB with an anti-His antibody. (D–H) Binding of His-tagged WT (wt, 25–288 aa) and the deletion mutant (mut, 52–288 aa) human AIBP to eTLR4, APOA1, and microglia. IP of eTLR4 and wtAIBP or mutAIBP in a test tube with an anti-AIBP antibody; blot and quantification from three independent experiments (D). ELISA with plates coated with eTLR4 and incubated with wtAIBP or mutAIBP (n = 3; E). ELISA with plates coated with BSA, wtAIBP, or mutAIBP and incubated with APOA1 (F). Flow cytometry (n = 6; F) and confocal imaging (G) showing binding of wtAIBP and mutAIBP (2 µg/ml) to BV-2 microglia cells, unstimulated or treated for 15 min with LPS (100 ng/ml). Detection with an anti-His antibody (flow) and an anti-TLR4 antibody (imaging). Scale bar, 10 µm. Mean ± SEM. ***, P < 0.001. Two-way ANOVA with Bonferroni post hoc test for multiple comparisons in time course analysis; t test for two groups; and one-way ANOVA with Tukey post hoc test for multiple comparisons of more than two groups. a.u., arbitrary units; ctrl, control.
Unlike wtAIBP, mutAIBP did not bind eTLR4 in a pull-down assay (Fig. 9 D) or in ELISA with eTLR4-coated plates and detection of bound AIBP with the BE-1 anti-AIBP mAb developed in our laboratory (Choi et al., 2020; Fig. 9 E). The BE-1 mAb had equal affinity to wtAIBP and mutAIBP (Fig. S5 B). Binding of mutAIBP to APOA1 remained unchanged when compared with wtAIBP (Fig. 9 F). In cell culture experiments, wtAIBP but not mutAIBP bound to BV-2 microglia stimulated with LPS (Fig. 9, G and H). The increase in wtAIBP binding in response to LPS can be explained by the recruitment of TLR4 to the cell surface and its localization to inflammarafts (Yvan-Charvet et al., 2008; Zhang et al., 2018; Zhu et al., 2010). In aggregate, these results suggest the role of the aa 25–51 N-terminal domain of AIBP in TLR4 binding.
AIBP lacking its TLR4-binding domain cannot alleviate CIPN allodynia
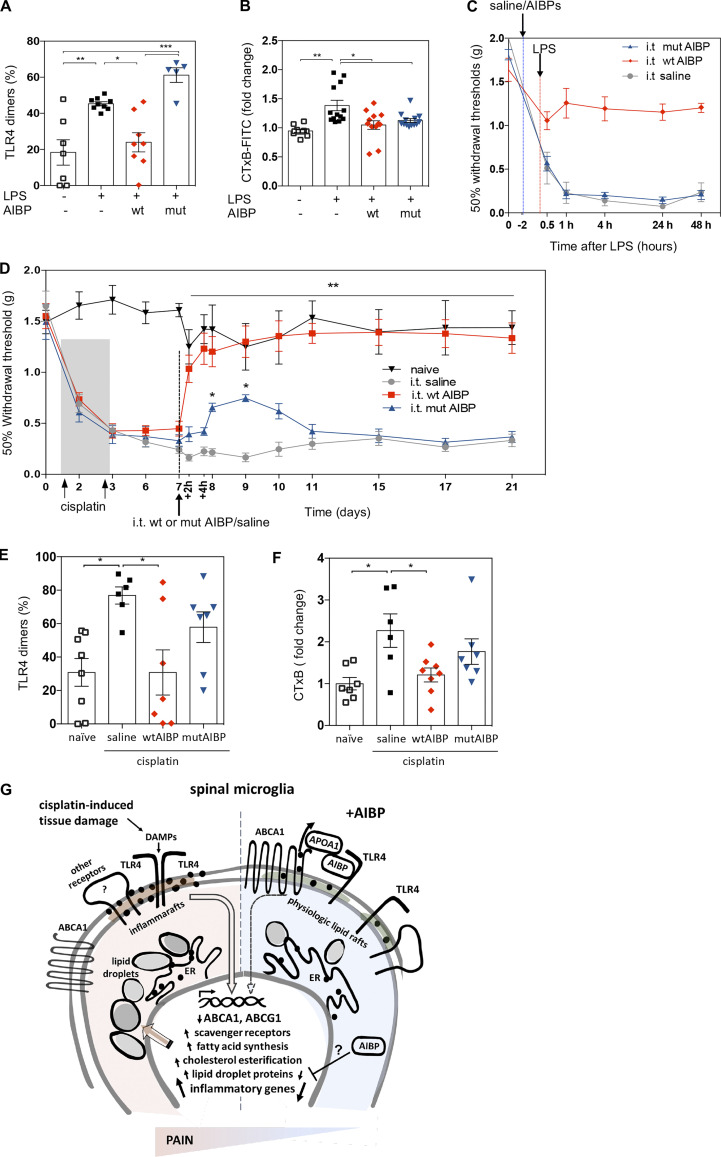
Unlike wtAIBP, mutAIBP lacking the TLR4-binding site was unable to inhibit LPS-induced TLR4 dimerization in BV-2 microglia (Fig. 10 A) but retained the overall ability to reduce lipid rafts (Fig. 10 B). Next, we tested the hypothesis that this TLR4 targeting mediates the therapeutic effect of AIBP. Mice that received i.t. saline or mutAIBP before i.t. LPS developed allodynia rapidly and to the same extent, whereas i.t. wtAIBP prevented mechanical allodynia induced by LPS (Fig. 10 C). In a CIPN mouse model, i.t. wtAIBP reversed established allodynia, with the sustained therapeutic effect lasting for at least 14 d (Fig. 10 D). However, i.t. mutAIBP induced only a modest and transient reversal in mechanical thresholds that did not reach naive or baseline levels and lasted only for 2–3 d (Fig. 10 D). At day 21, the mice were terminated, and lumbar spinal cords were analyzed. Remarkably, at this late time point, cisplatin-induced polyneuropathy continued to be associated with increased TLR4 dimerization and lipid rafts in spinal microglia, which were significantly reduced by i.t. wtAIBP but not mutAIBP (Fig. 10, E and F), similar to the effect observed on day 8 (Fig. 1, B and C). These results support the hypothesis that AIBP targeting of TLR4 inflammarafts mediates, in large part, the therapeutic effect of AIBP in a mouse model of CIPN.
Figure 10.
Intrathecal delivery of AIBP lacking the TLR4-binding domain cannot alleviate CIPN allodynia. (A and B) TLR4 dimerization (A) and lipid rafts (B) in BV-2 cells pretreated with wtAIBP or mutAIBP (0.2 µg/ml) and stimulated with 100 ng/ml LPS for 15 min. Mean ± SEM (n = 7 for control group, n = 5 for mutAIBP group, n = 9 for LPS group, and n = 8 for wtAIBP group in TLR4 dimerization analysis; n = 8 for control group and n = 13 for mutAIBP, LPS, and wtAIBP group in lipid rafts analysis; data from two independent experiments). (C) Withdrawal thresholds in WT mice that received i.t. AIBP (0.5 µg/5 µl) or saline (5 µl), followed by i.t. LPS (0.1 µg/5 µl); n = 5 per group. (D) Withdrawal thresholds in WT mice in response to i.p. cisplatin (2.3 mg/kg/d), followed by i.t. wtAIBP (0.5 µg/5 µl), mutAIBP (0.5 µg/5 µl), or saline (5 µl). Naive mice did not receive any injections (n = 7 for naive group, n = 8 for wtAIBP and mutAIBP group, n = 9 for i.t. saline group; data from two independent experiments). (E and F) TLR4 dimerization (E) and lipid rafts (F) in CD11b+/TMEM119+ microglia from lumbar spinal cord of mice in experimental groups shown in D, at day 21 (n = 7–9; data from two independent experiments). Mean ± SEM. *, P < 0.05; **, P < 0.01; ***, P < 0.005. Two-way ANOVA with Bonferroni post hoc test for multiple comparisons in time course analysis; and one-way ANOVA with Tukey post hoc test for multiple comparisons of more than two groups. (G) Diagram illustrating the effect of CIPN and AIBP treatment on microglia gene expression and lipid droplet accumulation. Black dots in the plasma membrane and the ER depict cholesterol. DAMPs, disease-associated molecular patterns.
Discussion
In this study, we report a new mechanism of selective cholesterol depletion from TLR4-hosting inflammarafts in spinal microglia as a new level of regulation of neuropathic pain in CIPN (Fig. 10 G) and possibly in other neuropathies. Conditional deletion of cholesterol transporters ABCA1 and ABCG1 in microglia induced spontaneous allodynia in naive mice showing similarities to the cisplatin effect, and importantly, the lack of ABCA1 and ABCG1 expression in microglia abolished the AIBP ability to reverse LPS- or cisplatin-induced allodynia or to reduce inflammarafts and TLR4 dimerization in spinal microglia. This differential effect in behavior and TLR4 dynamics was accompanied by the differential gene expression and inability of AIBP to repress inflammatory genes in ABC-imKO microglia.
AIBP has a singular ability to disrupt inflammarafts in activated cells but has little effect on physiological lipid rafts in quiescent cells. We proposed that this is due to AIBP binding to TLR4, which is highly expressed on the surface of inflammatory cells, directing cholesterol depletion to these cells (Miller et al., 2020; Woller et al., 2018). In this work, we identified the N-terminal domain of AIBP as the binding site for TLR4 and demonstrated the critical role of this domain in enabling AIBP binding to activated microglia and its therapeutic effect in CIPN. We propose that this makes AIBP a selective therapy directed to inflammarafts as opposed to nonselective cholesterol removal effected by cyclodextrins, APOA1 and APOA1 mimetic peptides, or LXR agonists. The mutated human AIBP lacking the N-terminal domain still binds to APOA1, and the WT zebrafish Aibp, in which this N-terminal domain is naturally absent, still augments cholesterol efflux from endothelial cells and regulates angiogenesis and orchestrates emergence of hematopoietic stem and progenitor cells from hemogenic endothelium (Fang et al., 2013; Gu et al., 2019), suggesting a different, TLR4-independent mechanism of AIBP interaction with endothelial cells.
Intrathecal delivery of AIBP has a lasting therapeutic effect in a mouse model of CIPN, observed for as long as 10 wk in our earlier work (Woller et al., 2018) and for 2 wk in this study. This is in contrast to a short exposure of i.t. AIBP, peaking at 30 min and largely gone by 4 h from both CSF and lumbar spinal cord tissue. The dissociation between exposure and therapeutic effect suggests a disease-modifying action of AIBP. The reduced CTxB binding and reduced percentage of TLR4 dimers in spinal microglia were observed for as long as 24 h and even 2 wk after a single i.t. AIBP injection, indicating sustained disruption of inflammarafts by AIBP, in contrast to their persistent presence in microglia of i.t. saline–injected CIPN mice. In addition to the targeted effect on TLR4 inflammarafts, the AIBP disease-modifying effect likely involves reprogramming of gene expression profile in spinal microglia. Although AIBP reversed only 3% of all genes whose expression in spinal microglia was affected by CIPN, AIBP significantly reduced the inflammatory gene expression and the levels of inflammatory cytokines in spinal tissue induced by the cisplatin regimen. These include genes encoding cytokines and chemokines that have been described to have a role in CIPN, such as Il1b, Cxcl2, and Ccl2 (Brandolini et al., 2019; Oliveira et al., 2014; Pevida et al., 2013; Yan et al., 2019).
In addition to inflammatory genes, the cisplatin regimen induced transcriptional changes that resemble the gene signature of diseases associated with neurodegenerative microglia (DAM). CIPN was associated with altered expression of lipid metabolism genes in microglia and the accumulation of lipid droplets, which was reduced by AIBP treatment. A similar microglia lipid droplets phenotype and the transcriptome were recently described as associated with aging and neurodegeneration (Marschallinger et al., 2020; Nugent et al., 2020). Homeostatic genes down-regulated during the microglial transition to these pathological phenotypes (Masuda et al., 2019; Nugent et al., 2020; Prinz et al., 2019) were also down-regulated in microglia of CIPN mice. Down-regulation of microglial Abca1 and Abcg1 expression induced by CIPN is a key factor in understanding the AIBP effect. Even though AIBP did not reverse CIPN-associated reduction in Abca1 or Abcg1 mRNA, its ability to stabilize the ABCA1 protein and promote cholesterol efflux (Zhang et al., 2016) might suffice to normalize microglia cholesterol metabolism. The AIBP effect on allodynia was replicated, albeit transiently, by i.t. APOA1 or an LXR agonist (Woller et al., 2018). Furthermore, a negative association of an ABCA1 single nucleotide variant has been found with quality of life scores in painful bone metastasis patients (Furfari et al., 2017). However, we cannot exclude other mechanisms, unrelated to the reversal of a subset of CIPN-affected genes, by which AIBP reprograms microglia to confer a protective phenotype in facilitated pain states.
One of the key findings of this work was that in the absence of ABCA1 and ABCG1 in microglia, AIBP failed to down-regulate inflammatory genes and even up-regulated some of them and up-regulated noninflammatory, pain-related Arc and Pi16 genes that regulate synaptic plasticity (Hossaini et al., 2010; Singhmar et al., 2020). Differential reprograming by AIBP of WT and ABCA1/ABCG1–deficient microglia could be dependent on the desmosterol-converting enzyme Dhcr24, which regulates desmosterol and cholesterol content and, when decreased, is associated with foam cell formation and homeostatic anti-inflammatory response (Spann et al., 2012). Importantly, AIBP was also unable to reverse CIPN- or LPS-induced allodynia in ABC-imKO mice. These results indicate that the AIBP anti-inflammatory and anti-nociceptive effects depend on cholesterol depletion from the plasma membrane and that in the absence of efflux machinery, AIBP may in fact promote inflammatory and cytotoxic effects.
Overall, the results of this study suggest that regulation of cholesterol content in the plasma membrane of spinal microglia has profound effects on the cell signaling originating from inflammarafts and the ensuing gene expression of inflammatory and lipid metabolism genes, culminating in control of nociception under polyneuropathy conditions.
Materials and methods
The key resources used in this study are listed in Table S1.
Animals
WT, Abca1fl/fl Abcg1fl/fl, Tlr4fl/fl, and Cx3cr1-CreERT2 mice, all on the C57BL/6 background, were purchased from The Jackson Laboratory or bred and weaned in-house. Tlr4−/− mice were a gift from Dr. Akira (Osaka University, Osaka, Japan). The Apoa1bpfl/fl mouse was previously generated in our laboratory using embryonic stem cells derived from C57BL/6 mice. The following mouse lines were crossbred in our laboratories: Apoa1bpfl/fl Cx3cr1-CreERT2 (AIBP-imKO), Tlr4fl/fl Cx3cr1-CreERT2 (TLR4-imKO), and Abca1fl/fl Abcg1fl/fl Cx3cr1-CreERT2 (ABC-imKO). All microglia conditional KO mice used in experiments had only one allele of Cx3cr1-CreERT2 to avoid generating a Cx3cr1 KO. Mice were housed up to four per standard cage at room temperature and maintained on a 12:12–h light:dark cycle. All behavioral testing was performed during the light cycle. Both food and water were available ad libitum. All experiments were conducted with male mice and according to protocols approved by the Institutional Animal Care and Use Committee of the University of California, San Diego.
Cells
BV-2 immortalized microglia cell line (Blasi et al., 1990) was cultured in Dulbecco’s MEM with 5% FBS. Thioglycollate-elicited peritoneal macrophages were harvested from C57BL/6 or Tlr4−/− mice and maintained in DMEM (Cellgro) supplemented with 10% heat-inactivated FBS (Cellgro) and 50 µg/ml gentamicin (Omega Scientific). HEK293 cells (RRID:CVCL_0045) were cultured in DMEM supplemented with 10% FBS and 50 µg/ml gentamicin. All cells were cultured in 5% CO2 atmosphere at 37°C. Cell lines were used between passages 1–3.
CIPN model
To develop CIPN, i.p. injections of cisplatin (2.3 mg/kg/injection; Spectrum Chemical MFG) were performed on day 1 and day 3. During the period of cisplatin administration, weight loss, behavioral changes, and mechanical allodynia were monitored and measured. The criteria for euthanasia were weight loss in excess of 20% body weight and erratic behavior; however, no animals required euthanasia.
Mechanical allodynia measurements
Animals were placed in clear, plastic, bottomless cages over a wire mesh surface and acclimated for at least 30 min before the initiation of testing. Tactile thresholds were measured with a series of von Frey filaments (Bioseb) ranging from 2.44 to 4.31 (0.02–2.00 g). The 50% probability of withdrawal threshold was recorded. Mechanical withdrawal thresholds were assessed before treatment (baseline or day 0) and at enter time points after treatment using the up-down method (Chaplan et al., 1994).
Intrathecal delivery of AIBP or saline
Mice were anesthetized using 5% isoflurane in oxygen for induction and 2% isoflurane in oxygen for maintenance of anesthesia. Intrathecal injections were performed according to Hylden and Wilcox (1980). Briefly, the lower back was shaven and disinfected, and the animals were placed in a prone posture holding the pelvis between the thumb and forefinger. The L5 and L6 vertebrae were identified by palpation, and a 30G needle was inserted percutaneously on the midline between the L5 and L6 vertebrae. Successful entry was assessed by the observation of a tail flick. Injections of 5 µl were administered over an interval of ∼30 s. Drugs for i.t. delivery were formulated in physiological sterile 0.9% NaCl. Based on previous study (Woller et al., 2018), AIBP dosing for spinal delivery in these studies was 0.5 µg/5 µl. Following recovery from anesthesia, mice were evaluated for normal motor coordination and muscle tone.
Intraperitoneal injection of tamoxifen for inducible Cre-driver lines
In this study, we followed The Jackson Laboratory tamoxifen induction protocol. Tamoxifen (Sigma-Aldrich) was dissolved in corn oil at a concentration of 10 mg/ml by shaking overnight at 37°C and wrapped in aluminum foil and stored at 4°C. 200 µl tamoxifen or vehicle (corn oil) was injected i.p. every 24 h for 5 d consecutively.
Ex vivo and in vitro TLR4 dimerization and lipid rafts assays
The TLR4 dimerization assay uses two TLR4 antibodies for flow cytometry: MTS510 recognizes TLR4/MD2 as a monomer (in TLR4 units) but not a dimer; SA15-21 binds to any cell surface TLR4 irrespective of its dimerization status (Akashi et al., 2003; Zanoni et al., 2016). The percentage of TLR4 dimers was then calculated from MTS510 and SA15-21 measured in the same cell suspension. Lipid raft content was measured using CTxB, which binds to ganglioside GM1. To assess TLR4 dimerization in vitro, BV-2 cells were preincubated with 0.2 µg/ml AIBP in serum-containing medium for 30 min, followed by a 15-min incubation with 100 ng/ml LPS. At the end of incubation, cells were immediately put on ice, washed once with PBS, and fixed for 10 min with 4% formaldehyde. Then cells were washed two times with ice-cold FACS buffer, incubated with 2% normal mouse serum containing an anti–CD16/CD32 antibody (BD Bioscience; FcγR blocker) for 30 min on ice, followed by staining with a 1:100 dilution of PE-conjugated MTS510 antibody and an APC-conjugated SA15-21 antibody (Thermo Fisher Scientific and BioLegend, respectively; RRID:AB_2562503 and RRID:AB_466263) together with 1:200 dilution of CTxB-FITC (Thermo Fisher Scientific) for 30 min on ice. Cells were washed and analyzed using a FACSCanto II (BD Biosciences) flow cytometer.
For ex vivo assays, spinal cords were harvested by hydro extrusion (Kennedy et al., 2013), fixed with 4% formaldehyde, and put on ice while processing. Single-cell suspensions from lumbar tissue were obtained using a Neural Tissue Dissociation kit (Miltenyi Biotec) according to the manufacturer’s protocol. To remove myelin, Myelin Removal Beads II (Miltenyi Biotec) were added to samples and incubated for 15 min at 4°C, followed by separation with LS column and a MACS Separator (Miltenyi Biotec). Following isolation, cells were incubated with 2% normal mouse serum containing an anti–CD16/CD32 antibody (BD Bioscience; FcγR blocker) for 30 min on ice, followed by staining with an antibody mix of 1:100 PerCP-Cy5.5–conjugated CD11b antibody (BioLegend; RRID:AB_893232), 1:100 rabbit anti-mouse TMEM119 antibody (Abcam; RRID:AB_2744673), PE-conjugated MTS510, APC-conjugated SA15-21 antibodies (Thermo Fisher Scientific; RRID:AB_2562503 and BioLegend; RRID:AB_466263, respectively), and 1:200 dilution of CTxB-FITC (Thermo Fisher Scientific) for 45 min on ice; cells were then washed and incubated with (1:250) secondary Alexa PECy7-conjugated anti-rabbit antibody for 30 min on ice. Cells were washed and analyzed using a FACSCanto II (BD Biosciences) flow cytometer.
For in vitro and ex vivo staining compensations, beads and/or single stained cells that we used to compensate the signal overlap between channels and isotype controls for CD11b, MTS510, and SA15-21 antibodies together with a fluorescence minus one control were used to delineate gates. Data were analyzed by FlowJo (BD Bioscience; RRID:SCR_008520). From these data, we calculated the abundance of lipid rafts and a relative change in the number of TLR4 dimers in spinal microglia (zero dimers were arbitrarily assigned to unstimulated or naive cells).
Immunofluorescence, confocal imaging, and colocalization analysis
BV-2 cells were plated on coverslips in 12-well plates and preincubated with 0.2 µg/ml AIBP in 5% serum-containing medium for 30 min, followed by a 5- or 15-min incubation with 100 ng/ml LPS. At the end of incubation, cells were immediately put on ice, washed once with PBS, and fixed for 10 min with 4% formaldehyde. Cells were washed two times with ice-cold PBS and incubated with blocking buffer containing 5% FBS for 30 min, followed by staining with a 1:200 dilution of CTxB–Alexa Fluor 555 and 1:100 dilution of mouse anti-TLR4 antibody (Abcam; RRID:AB_446735) or with 1:100 rabbit anti-APOA1 antibody (Abcam) or 1:100 rabbit anti-ABCA1 (Novus Biological; RRID:AB_10000630), washed and incubated with anti-rabbit Alexa Fluor 647–conjugated secondary antibody, and incubated with recombinant, His-tagged ALOD4 and a 1:100 FITC-conjugated anti-His secondary antibody (LSbio) for staining of accessible cholesterol in the membrane. Cells were washed, and coverslips were mounted with Prolong Gold into slides and sealed. Slides were analyzed using a Leica SP8 super-resolution confocal microscope with Lightening deconvolution.
For validating microglia-specific AIBP or ABCA1/ABCG1 KO, spinal cord tissue was collected and postfixed in 4% formaldehyde at 4°C. Then, the tissue was dehydrated in 30% sucrose and frozen in optimal cutting temperature compound until sectioning. Spinal cords were sliced into 10-µm sections using a cryostat, and slides were stored at −20°C. Frozen sections were blocked with a 2% FBS and 0.3% Triton X100 solution, followed by incubations with 1:100 rabbit anti-AIBP antibody (a kind gift from Dr. Longhou Fang, Houston Methodist Research Institute, Houston, TX). Separate sections were stained with 1:100 rabbit anti-ABCA1 or 1:100 rabbit anti-ABCG1 antibodies (Novus Biological; RRID:AB_10000630 and RRID:AB_10125717) overnight at 4°C. Slides were washed and incubated with a 1:200 dilution of anti-rabbit Alexa Fluor 488– (Abcam; RRID:AB_2630356) or Alexa Fluor 647–conjugated secondary antibody for 2 h, followed by three washes, and all sections were incubated with either Alexa Fluor 488–conjugated IBA-1 antibody (Millipore-Sigma) or Alexa Fluor 633–conjugated IBA1 antibody (Wako Chemicals; RRID: AB_2687911). Alternatively, slides were incubated with either 1:100 Alexa Fluor 488–conjugated anti-NeuN antibody (Cell Signaling; RRID:AB_2799470) or 1:100 Alexa Fluor 488–conjugated anti-GFAP antibody (Cell Signaling; RRID:AB_2263284). Slides were washed three times with PBS and mounted with Prolong Gold with DAPI (Cell Signaling). Image acquisitions of at least one slide of each animal were performed using a 63× objective and a Leica SP8 confocal microscope with Lightening deconvolution. Colocalization analyses were performed in ImageJ/FIJI (National Institutes of Health; RRID:SCR_003070/SCR_002285) using the Coloc2 tool. Thresholds, Pearson’s R, and Manders’ coefficients above thresholds, together with masked colocalized images, Costes P value, and pixel scatter plots were generated for each image. tM1 or tM2 were used depending on which channel represented the cell markers.
ALOD4 expression and purification
The pALOD4 plasmid (Gay et al., 2015) was obtained from Addgene (cat no. 111026; RRID:Addgene_111026) and used to transform Escherichia coli competent cells BL21(DE3), and positive colonies were selected in Amp+ LB plates. After induction of the expression with 1 mM isopropyl β-d-1-thiogalactopyranoside and lysis, His-tagged ALOD4 was purified using a Ni-NTA agarose column with imidazole elution. Protein was dialyzed against PBS, and concentration was measured. Aliquots were stored at −80°C.
Cloning and expression of wtAIBP and mutAIBP in baculovirus/insect cell system
AIBP was produced in a baculovirus/insect cell system to ensure posttranslational modification and endotoxin-free preparation as described in Choi et al. (2018) and Woller et al. (2018). Bulk production of AIBP was ordered from Selvita, Inc. wtAIBP and mutAIBP, mouse WT AIBP, and zebrafish WT AIBP (Fang et al., 2013) were cloned into a pAcHLT-C vector behind the polyhedrin promoter. The vector contains an N-terminal His-tag to enable purification and detection. Insect Sf9 cells were transfected with BestBac baculovirus DNA (Expression Systems) and the AIBP vector. After 4–5 d, the supernatant was collected to afford a baculovirus stock. Fresh Sf9 cells were infected with the AIBP-producing baculovirus; cell pellets were collected after 3 d, lysed, sonicated, and cleared by centrifugation, and the supernatants were loaded onto a Ni-NTA agarose column eluted with imidazole. Protein was dialyzed against saline, and concentration was measured. Aliquots were stored at −80°C.
Pharmacokinetics of AIBP in spinal tissue
AIBP KO mice were used for the pharmacokinetic study. Intrathecal injections of AIBP (2.5 µg/5 µl) were performed as previously described (Hylden and Wilcox, 1980), and the CSF was collected after 15 min, 30 min, 1 h, 4 h, or 8 h as described (Liu and Duff, 2008). Briefly, capillary tubes (0.8 × 100 mm) were pulled using a micropipette puller. Mice were anesthetized using 3% isoflurane with a mixture of 50% oxygen and 50% room air. The skin of the neck was shaved, and the mouse was placed on the stereotaxic instrument. After swabbing the surgical site, a sagittal incision of the skin inferior to the occiput was made. The subcutaneous tissue and muscles were dissected away, exposing the dura mater. The pulled capillary tube was directly punctured into the cisterna magna, and a noncontaminated sample was drawn. After CSF collection, the capillary tube was flushed into a PCR tube containing 50 µl of NaCl 0.09%, and the mouse was then perfused with 35 ml of 0.9% NaCl. The spinal cord was flushed by hydro-extrusion with 5 ml of 0.9% NaCl. Spinal cord tissue was weighed and extracted with complete N-PER Neuronal Protein Extraction Reagent (Thermo Fisher Scientific) at 1 g/10 ml on ice. After 10-min incubation on ice, samples were centrifuged (10,000 ×g for 10 min at 4°C) to pellet the cell debris, and supernatants were diluted 1:1 with 1% BSA–Tris-buffered saline. Plates were coated with BE-1 anti-AIBP mAb (5 µg/ml), incubated for 3 h with spinal cord extracts or CSF samples, and detected with a rabbit polyclonal anti-AIBP antibody, followed by a goat–anti-rabbit-ALP antibody (Sigma-Aldrich; RRID: AB_258103). Plates were read as above.
FACS sorting of spinal microglia for RNA-seq
Cell suspensions from lumbar spinal cords were prepared as described above, except for the fixation step. Fresh tissue was processed and blocked for 30 min with 2% normal mouse serum containing an anti–CD16/CD32 antibody (BD Bioscience; FcγR blocker) and then stained with a mix of 1:50 PE-Cy7–conjugated CD11b antibody (BioLegend; RRID: AB_312799), 1:50 rabbit anti-mouse TMEM119 antibody (Abcam; RRID:AB_2744673), and 1:50 PerCP-Cy5.5–conjugated CD24 antibody (BioLegend; RRID:AB_1595491); cells were then washed and incubated with (1:200) secondary Alexa Fluor 488–conjugated anti-rabbit antibody (Abcam; RRID:AB_2630356) and incubated for 30 min on ice. After that, cells were washed and incubated with 1:50 Alexa Fluor 647–conjugated Glast1 antibody (Novus Biologicals) and 1:100 dilution of Life/Death Ghost Red 780 dye (Cell Signaling) for 30 min on ice. Cells were washed with sorting buffer and filtered before being sorted into lysis buffer using a FACS-Aria cell sorter (BD Biosciences). Three technical replicates, each with 400 cells from the same animal, were sorted. See Fig. S2, A and B for sorting strategy and analysis of purity of sorted microglia.
RNA-seq library prep, sequencing, and QC
We followed the low-input bulk seq SmartSeq2 protocol from Rosales et al. (2018). Cells sorted into a lysis buffer containing Triton X-100, RNase Inhibitor, and Oligo(dT)30-VN were hybridized with oligo(dT)+ to the poly(A) tails of the mRNA. Reagents for reverse transcription were added to construct cDNA libraries following addition of reagents for PCR amplification (quantitative PCR was not performed at this point). Libraries were quantified, and QC was performed using TapeStation high-sensitivity D5000 screen tape in addition to Qubit double-stranded high-sensitivity assay. All samples were adjusted to 1 ng of cDNA for input into NexteraXT protocol. QC check was performed with TapeStation high-sensitivity D1000 screen tape in addition to Qubit double-stranded high-sensitivity assay. The samples were subjected to quantitative PCR and pooling and were loaded onto the NovaSeq for paired-end 50 × 50 reads using NovaSeq S1 100 cycle kit.
Splice-aware alignment of FASTQ data was done using STAR (Dobin et al., 2013). QC of sequenced data and alignment were performed by FASTQC (RRID:SCR_014583), QoRTs (RRID:SCR_018665; Hartley and Mullikin, 2015), and MultiQC tool (RRID:SCR_014982; Ewels et al., 2016). Counting of genes associated with the reads was performed using STAR (RRID:SCR_015899).
Sequencing QCs indicated good data quality (Data S1). Two technical replicates (Y_10 and Y_30) were removed due to suboptimal gene coverage. We used R package DEseq2 (RRID:SCR_015687) to analyze differential expression (Love et al., 2014). We identified a total of 18,818 genes in lumbar spinal microglia with cutoff set to >10 counts per million mapped reads for at least three samples. One sample was removed from further analysis because it displayed extreme irregular distribution in principal component analysis and clustering in the top 500 most variable genes in comparison to all other samples. We used a subset of 40 microglia-specific genes reported in Butovsky et al. (2014) and the genes specific for neurons (Nefl), oligodendrocytes (Omg), and astrocytes (Slc6a1) to confirm the microglia enrichment in our samples and data (Fig. S2 D). Determination of DEGs was performed by DEseq2 binomial modeling using an LRT including all samples across all factors and using a reduced design without condition factor to determine the main effect of cisplatin and AIBP and all significant genes altered by these conditions. We used an LRT model, comparing it to a reduced design without interaction term of condition and genotype, to identify the genes regulated in a genotype (ABC-imKO)-dependent manner. Adjusted P < 0.05 and a false discovery rate (FDR) of 5% were used to filter significant genes. Determination of clusters of genes by gene expression pattern of the identified significant genes was performed by DESeq2 function: degpatterns. Pairwise comparisons after LRT of experimental groups were performed with Wald test and accounting for an FDR of 5%. Volcano plots include genes significantly different with an absolute fold change >1.5. Pathway enrichment and GO analysis were performed in metascape.org (RRID:SCR_016620) using a minimum of three genes and P < 0.05 (Zhou et al., 2019).
Co-immunoprecipitation assays for TLR4 binding
Pull-down assay of eTLR4 and wtAIBP or mutAIBP in test tube was performed by mixing 1 µg of eTLR4 (Sino Biological) and AIBP in PBS containing 0.5% Triton X-100 and incubating for 1 h at room temperature. Samples were precleared by adding Protein A/G Sepharose beads at room temperature for 30 min, followed by addition of 1 µg of BE-1 monoclonal anti-AIBP antibody and incubation for 2 h. Protein A/G Sepharose beads were added and incubated for an additional 1 h, followed by five washes with PBS containing 0.5% Triton X-100 and immunoblot of samples.
HEK293 cells (RRID:CVCL_0045) were transfected with Flag-eTLR4 and a Flag-AIBP (WT or one of the mutants) construct. 36 h after transfection, cells were harvested and lysed with an ice-cold lysis buffer (50 mM Tris-HCl, pH 7.5, 1% NP-40, 150 mM NaCl, 1 mM EDTA, 1 mM EGTA, 5 mM Na3VO4, 1 mM NaF, and a protease inhibitor cocktail from Sigma-Aldrich). Cell lysates were preincubated with protein A/G Sepharose beads for 30 min at 4°C and immunoprecipitated with a mouse anti-TLR4 antibody (Abcam) overnight at 4°C. Next day, the lysates were incubated with protein A/G beads for 1 h at 4°C. Unbound proteins were removed by washing with lysis buffer, and the beads were run on a Bolt Bis-Tris gel (Invitrogen); the bound AIBP was detected by immunoblotting with an anti-Flag antibody (Sigma-Aldrich).
ELISA binding assays
To assess AIBP-TLR4 binding, 96-well plates were coated with 5 µg/ml of eTLR4, washed three times with PBS containing 0.05% Tween-20, blocked with PBS containing 1% BSA, and incubated with wtAIBP or mutAIBP, followed by 2 µg/ml of a biotinylated BE-1 anti-AIBP mAb. To assess AIBP-APOA1 binding, plates were coated with BSA, wtAIBP, or mutAIBP; washed; blocked; and incubated with 5 µg/ml of human APOA1 (a gift from Dmitri Sviridov, Baker Heart and Diabetes Institute, Melbourne, Australia), followed by a biotinylated anti-APOA1 antibody (Academy Bio-Medical Company; RRID:AB_1238781). In both assays, neutravidin-AP was added and incubated for 45 min at room temperature, followed by LumiPhos 530 (Lumigen) for 90 min, and luminescence was measured using a luminescence plate reader (BioTek).
Flow cytometry assay for AIBP cell binding
BV-2 microglia cells stimulated or not with 100 ng/ml LPS for 15 min were blocked with Tris-buffered saline containing 1% BSA for 60 min on ice and incubated with either 2 µg/ml BSA or 2 µg/ml AIBP for 2 h on ice. Cells were fixed and incubated with 1 µg/ml FITC-conjugated anti-His antibody (LSBio) for 1 h at 4°C and analyzed using a FACSCanto II (BD Biosciences) flow cytometer and FlowJo software (RRID: SCR_008520).
Cytokine measurement in spinal tissue by ELISA
Levels of IL-6 (DY406), IL-1β (DY401), MCP-1 (DY479), and MIP2 (DY452) in spinal cord lysates were measured using a mouse DuoSet ELISA (R&D Systems) according to the manufacturer’s instructions.
Statistical analyses
For other than RNA-seq datasets, results were analyzed using Student’s t test (for differences between two groups), one-way ANOVA (for multiple groups), or two-way ANOVA with the Bonferroni post hoc test (for multiple groups time course experiments) using GraphPad Prism (RRID:SCR_002798). Differences between groups with P < 0.05 were considered statistically significant.
Online supplemental material
Fig. S1 provides validation of the specificity of TLR4 antibodies used for flow cytometry and microscopy. It also shows TLR4 dimerization and lipid rafts measured in DRG macrophages. Fig. S2 shows FACS sorting strategy for spinal microglia and phenotypic controls for RNA-seq. Fig. S3 provides immunohistochemical validation of conditional KO of ABCA1 and ABCG1 in spinal microglia of tamoxifen-induced ABC-imKO mice. Fig. S4 shows tactile allodynia data for tamoxifen-treated WT mice in i.t. LPS and CIPN experiments. It also provides additional RNA-seq data for ABC-imKO dependent genes and the cisplatin effect on ABC-imKO versus WT mice. Fig. S5 provides immunohistochemical validation of AIBP KO in spinal microglia of tamoxifen-induced AIBP-imKO mice. It also demonstrates that the BE-1 mAb has similar affinity to wtAIBP and mutAIBP. Table S1 lists the key resources used in this paper. Data S1 shows quality controls for the sequencing data.
Supplementary Material
lists the key resources used in this paper, including their source and identifier numbers.
shows quality controls for sequencing analyses.
Acknowledgments
This study was supported by National Institutes of Health grants NS102432 (to Y.I. Miller and T.L. Yaksh), NS104769 (to Y.I. Miller and T.L. Yaksh), NS099338 (to T.L. Yaksh and M. Corr), HL135737 (to Y.I. Miller), HL136275 (to Y.I. Miller and K. Ley), and São Paulo Research Foundation grant FAPESP 2018/05778-3 (to G.F. Catroli). National Institute of Neurological Disorders and Stroke grant P30 NS047101 supports the University of California, San Diego, School of Medicine Microscopy Core.
Author contributions: Studies were designed and planned by Y.I. Miller, S.-H. Choi, J.M. Navia-Pelaez, and T.L. Yaksh. The experiments were performed by J.M. Navia-Pelaez, S.-H. Choi, L.d.S.A. Capettini, A. Gonen, C. Agatisa-Boyle, L. Delay, B. Saylor, Y. Xia, G. Gonçalves dos Santos, G.F. Catroli, J.W. Lu, and J. Kim. The RNA-seq experiments were performed by J.M. Navia-Pelaez, H. Winkels, and C.P. Durant, analyzed by J.M. Navia-Pelaez and Y. Ghosheh, and supervised by K. Ley. Other data analyses were performed by J.M. Navia-Pelaez, S.-H. Choi, and Y.I. Miller; J.M. Navia-Pelaez and Y.I. Miller wrote the manuscript. T.L. Yaksh, M. Corr, S.-H. Choi, G. Beaton, and I. Kufareva contributed to study discussions and manuscript revisions.
Data availability
The Gene Expression Omnibus accession no. for the sequencing results reported in this paper is GSE154816. The data can be explored at https://ncbi.nlm.nih.gov/geo/. All custom analysis scripts and data that support the conclusions are available from the authors on request.
References
- Ahn, J.H., Cho H., Kim J.H., Kim S.H., Ham J.S., Park I., Suh S.H., Hong S.P., Song J.H., Hong Y.K., et al. 2019. Meningeal lymphatic vessels at the skull base drain cerebrospinal fluid. Nature. 572:62–66. 10.1038/s41586-019-1419-5 [DOI] [PubMed] [Google Scholar]
- Akashi, S., Saitoh S., Wakabayashi Y., Kikuchi T., Takamura N., Nagai Y., Kusumoto Y., Fukase K., Kusumoto S., Adachi Y., et al. 2003. Lipopolysaccharide interaction with cell surface Toll-like receptor 4-MD-2: higher affinity than that with MD-2 or CD14. J. Exp. Med. 198:1035–1042. 10.1084/jem.20031076 [DOI] [PMC free article] [PubMed] [Google Scholar]
- Blasi, E., Barluzzi R., Bocchini V., Mazzolla R., and Bistoni F.. 1990. Immortalization of murine microglial cells by a v-raf/v-myc carrying retrovirus. J. Neuroimmunol. 27:229–237. 10.1016/0165-5728(90)90073-V [DOI] [PubMed] [Google Scholar]
- Brandolini, L., d’Angelo M., Antonosante A., Allegretti M., and Cimini A.. 2019. Chemokine Signaling in Chemotherapy-Induced Neuropathic Pain. Int. J. Mol. Sci. 20:2904. 10.3390/ijms20122904 [DOI] [PMC free article] [PubMed] [Google Scholar]
- Bruno, K., Woller S.A., Miller Y.I., Yaksh T.L., Wallace M., Beaton G., and Chakravarthy K.. 2018. Targeting toll-like receptor-4 (TLR4)-an emerging therapeutic target for persistent pain states. Pain. 159:1908–1915. 10.1097/j.pain.0000000000001306 [DOI] [PMC free article] [PubMed] [Google Scholar]
- Butovsky, O., Jedrychowski M.P., Moore C.S., Cialic R., Lanser A.J., Gabriely G., Koeglsperger T., Dake B., Wu P.M., Doykan C.E., et al. 2014. Identification of a unique TGF-beta-dependent molecular and functional signature in microglia. Nat. Neurosci. 17:131–143. 10.1038/nn.3599 [DOI] [PMC free article] [PubMed] [Google Scholar]
- Chaplan, S.R., Bach F.W., Pogrel J.W., Chung J.M., and Yaksh T.L.. 1994. Quantitative assessment of tactile allodynia in the rat paw. J. Neurosci. Methods. 53:55–63. 10.1016/0165-0270(94)90144-9 [DOI] [PubMed] [Google Scholar]
- Chen, T., Li H., Yin Y., Zhang Y., Liu Z., and Liu H.. 2017. Interactions of Notch1 and TLR4 signaling pathways in DRG neurons of in vivo and in vitro models of diabetic neuropathy. Sci. Rep. 7:14923. 10.1038/s41598-017-15053-w [DOI] [PMC free article] [PubMed] [Google Scholar]
- Cheng, A.M., Handa P., Tateya S., Schwartz J., Tang C., Mitra P., Oram J.F., Chait A., and Kim F.. 2012. Apolipoprotein A-I attenuates palmitate-mediated NF-κB activation by reducing Toll-like receptor-4 recruitment into lipid rafts. PLoS One. 7:e33917. 10.1371/journal.pone.0033917 [DOI] [PMC free article] [PubMed] [Google Scholar]
- Choi, S.H., Wallace A.M., Schneider D.A., Burg E., Kim J., Alekseeva E., Ubags N.D., Cool C.D., Fang L., Suratt B.T., and Miller Y.I.. 2018. AIBP augments cholesterol efflux from alveolar macrophages to surfactant and reduces acute lung inflammation. JCI Insight. 3:e120519. 10.1172/jci.insight.120519 [DOI] [PMC free article] [PubMed] [Google Scholar]
- Choi, S.-H., Agatisa-Boyle C., Gonen A., Kim A., Kim J., Alekseeva E., Tsimikas S., and Miller Y.I.. 2020. Intracellular AIBP (Apolipoprotein A-I Binding Protein) Regulates Oxidized LDL (Low-Density Lipoprotein)-Induced Mitophagy in Macrophages. Arterioscler. Thromb. Vasc. Biol. 120:315485. [DOI] [PMC free article] [PubMed] [Google Scholar]
- Dobin, A., Davis C.A., Schlesinger F., Drenkow J., Zaleski C., Jha S., Batut P., Chaisson M., and Gingeras T.R.. 2013. STAR: ultrafast universal RNA-seq aligner. Bioinformatics. 29:15–21. 10.1093/bioinformatics/bts635 [DOI] [PMC free article] [PubMed] [Google Scholar]
- Ewels, P., Magnusson M., Lundin S., and Käller M.. 2016. MultiQC: summarize analysis results for multiple tools and samples in a single report. Bioinformatics. 32:3047–3048. 10.1093/bioinformatics/btw354 [DOI] [PMC free article] [PubMed] [Google Scholar]
- Fang, L., Choi S.H., Baek J.S., Liu C., Almazan F., Ulrich F., Wiesner P., Taleb A., Deer E., Pattison J., et al. 2013. Control of angiogenesis by AIBP-mediated cholesterol efflux. Nature. 498:118–122. 10.1038/nature12166 [DOI] [PMC free article] [PubMed] [Google Scholar]
- Furfari, A., Wan B.A., Ding K., Wong A., Zhu L., Bezjak A., Wong R., Wilson C.F., DeAngelis C., Azad A., et al. 2017. Genetic biomarkers associated with changes in quality of life and pain following palliative radiotherapy in patients with bone metastases. Ann. Palliat. Med. 6(S2, Suppl 2):S248–S256. 10.21037/apm.2017.09.01 [DOI] [PubMed] [Google Scholar]
- Gay, A., Rye D., and Radhakrishnan A.. 2015. Switch-like responses of two cholesterol sensors do not require protein oligomerization in membranes. Biophys. J. 108:1459–1469. 10.1016/j.bpj.2015.02.008 [DOI] [PMC free article] [PubMed] [Google Scholar]
- Gregus, A.M., Buczynski M.W., Dumlao D.S., Norris P.C., Rai G., Simeonov A., Maloney D.J., Jadhav A., Xu Q., Wei S.C., et al. 2018. Inhibition of spinal 15-LOX-1 attenuates TLR4-dependent, nonsteroidal anti-inflammatory drug-unresponsive hyperalgesia in male rats. Pain. 159:2620–2629. 10.1097/j.pain.0000000000001373 [DOI] [PMC free article] [PubMed] [Google Scholar]
- Gu, Q., Yang X., Lv J., Zhang J., Xia B., Kim J.D., Wang R., Xiong F., Meng S., Clements T.P., et al. 2019. AIBP-mediated cholesterol efflux instructs hematopoietic stem and progenitor cell fate. Science. 363:1085–1088. 10.1126/science.aav1749 [DOI] [PMC free article] [PubMed] [Google Scholar]
- Hartley, S.W., and Mullikin J.C.. 2015. QoRTs: a comprehensive toolset for quality control and data processing of RNA-Seq experiments. BMC Bioinformatics. 16:224. 10.1186/s12859-015-0670-5 [DOI] [PMC free article] [PubMed] [Google Scholar]
- He, C., Hu X., Jung R.S., Weston T.A., Sandoval N.P., Tontonoz P., Kilburn M.R., Fong L.G., Young S.G., and Jiang H.. 2017. High-resolution imaging and quantification of plasma membrane cholesterol by NanoSIMS. Proc. Natl. Acad. Sci. USA. 114:2000–2005. 10.1073/pnas.1621432114 [DOI] [PMC free article] [PubMed] [Google Scholar]
- Hossaini, M., Jongen J.L., Biesheuvel K., Kuhl D., and Holstege J.C.. 2010. Nociceptive stimulation induces expression of Arc/Arg3.1 in the spinal cord with a preference for neurons containing enkephalin. Mol. Pain. 6:43. 10.1186/1744-8069-6-43 [DOI] [PMC free article] [PubMed] [Google Scholar]
- Hu, L.Y., Zhou Y., Cui W.Q., Hu X.M., Du L.X., Mi W.L., Chu Y.X., Wu G.C., Wang Y.Q., and Mao-Ying Q.L.. 2018. Triggering receptor expressed on myeloid cells 2 (TREM2) dependent microglial activation promotes cisplatin-induced peripheral neuropathy in mice. Brain Behav. Immun. 68:132–145. 10.1016/j.bbi.2017.10.011 [DOI] [PubMed] [Google Scholar]
- Hylden, J.L., and Wilcox G.L.. 1980. Intrathecal morphine in mice: a new technique. Eur. J. Pharmacol. 67:313–316. 10.1016/0014-2999(80)90515-4 [DOI] [PubMed] [Google Scholar]
- Jaitin, D.A., Adlung L., Thaiss C.A., Weiner A., Li B., Descamps H., Lundgren P., Bleriot C., Liu Z., Deczkowska A., et al. 2019. Lipid-Associated Macrophages Control Metabolic Homeostasis in a Trem2-Dependent Manner. Cell. 178:686–698.e14. 10.1016/j.cell.2019.05.054 [DOI] [PMC free article] [PubMed] [Google Scholar]
- Jha, K.N., Shumilin I.A., Digilio L.C., Chertihin O., Zheng H., Schmitz G., Visconti P.E., Flickinger C.J., Minor W., and Herr J.C.. 2008. Biochemical and structural characterization of apolipoprotein A-I binding protein, a novel phosphoprotein with a potential role in sperm capacitation. Endocrinology. 149:2108–2120. 10.1210/en.2007-0582 [DOI] [PMC free article] [PubMed] [Google Scholar]
- Karasinska, J.M., de Haan W., Franciosi S., Ruddle P., Fan J., Kruit J.K., Stukas S., Lütjohann D., Gutmann D.H., Wellington C.L., and Hayden M.R.. 2013. ABCA1 influences neuroinflammation and neuronal death. Neurobiol. Dis. 54:445–455. 10.1016/j.nbd.2013.01.018 [DOI] [PubMed] [Google Scholar]
- Kennedy, H.S., Jones C. III, and Caplazi P.. 2013. Comparison of standard laminectomy with an optimized ejection method for the removal of spinal cords from rats and mice. J. Histotechnol. 36:86–91. 10.1179/014788813X13756994210382 [DOI] [PMC free article] [PubMed] [Google Scholar]
- Lees, J.G., Makker P.G., Tonkin R.S., Abdulla M., Park S.B., Goldstein D., and Moalem-Taylor G.. 2017. Immune-mediated processes implicated in chemotherapy-induced peripheral neuropathy. Eur. J. Cancer. 73:22–29. 10.1016/j.ejca.2016.12.006 [DOI] [PubMed] [Google Scholar]
- Li, Y., Marri T., North R.Y., Rhodes H.R., Uhelski M.L., Tatsui C.E., Rhines L.D., Rao G., Corrales G., Abercrombie T.J., et al. 2021. Chemotherapy-induced peripheral neuropathy in a dish: dorsal root ganglion cells treated in vitro with paclitaxel show biochemical and physiological responses parallel to that seen in vivo. Pain. 162:84–96. 10.1097/j.pain.0000000000002005 [DOI] [PMC free article] [PubMed] [Google Scholar]
- Liu, L., and Duff K.. 2008. A technique for serial collection of cerebrospinal fluid from the cisterna magna in mouse. J. Vis. Exp. 21:960. 10.3791/960 [DOI] [PMC free article] [PubMed] [Google Scholar]
- Love, M.I., Huber W., and Anders S.. 2014. Moderated estimation of fold change and dispersion for RNA-seq data with DESeq2. Genome Biol. 15:550. 10.1186/s13059-014-0550-8 [DOI] [PMC free article] [PubMed] [Google Scholar]
- Makker, P.G., Duffy S.S., Lees J.G., Perera C.J., Tonkin R.S., Butovsky O., Park S.B., Goldstein D., and Moalem-Taylor G.. 2017. Characterisation of Immune and Neuroinflammatory Changes Associated with Chemotherapy-Induced Peripheral Neuropathy. PLoS One. 12:e0170814. 10.1371/journal.pone.0170814 [DOI] [PMC free article] [PubMed] [Google Scholar]
- Marschallinger, J., Iram T., Zardeneta M., Lee S.E., Lehallier B., Haney M.S., Pluvinage J.V., Mathur V., Hahn O., Morgens D.W., et al. 2020. Lipid-droplet-accumulating microglia represent a dysfunctional and proinflammatory state in the aging brain. Nat. Neurosci. 23:194–208. 10.1038/s41593-019-0566-1 [DOI] [PMC free article] [PubMed] [Google Scholar]
- Masuda, T., Sankowski R., Staszewski O., Böttcher C., Amann L., Sagar C., Scheiwe C., Nessler S., Kunz P., van Loo G., et al. 2019. Spatial and temporal heterogeneity of mouse and human microglia at single-cell resolution. Nature. 566:388–392. 10.1038/s41586-019-0924-x [DOI] [PubMed] [Google Scholar]
- Miller, Y.I., Navia-Pelaez J.M., Corr M., and Yaksh T.L.. 2020. Lipid rafts in glial cells: role in neuroinflammation and pain processing. J. Lipid Res. 61:655–666. 10.1194/jlr.TR119000468 [DOI] [PMC free article] [PubMed] [Google Scholar]
- Nugent, A.A., Lin K., van Lengerich B., Lianoglou S., Przybyla L., Davis S.S., Llapashtica C., Wang J., Kim D.J., Xia D., et al. 2020. TREM2 Regulates Microglial Cholesterol Metabolism upon Chronic Phagocytic Challenge. Neuron. 105:837–854.e9. 10.1016/j.neuron.2019.12.007 [DOI] [PubMed] [Google Scholar]
- Oliveira, A., Dinis-Oliveira R.J., Nogueira A., Gonçalves F., Silva P., Vieira C., Silvestre R., Carvalho F., and Medeiros R.. 2014. Interleukin-1β genotype and circulating levels in cancer patients: metastatic status and pain perception. Clin. Biochem. 47:1209–1213. 10.1016/j.clinbiochem.2014.04.009 [DOI] [PubMed] [Google Scholar]
- Papageorgiou, I.E., Lewen A., Galow L.V., Cesetti T., Scheffel J., Regen T., Hanisch U.K., and Kann O.. 2016. TLR4-activated microglia require IFN-γ to induce severe neuronal dysfunction and death in situ. Proc. Natl. Acad. Sci. USA. 113:212–217. 10.1073/pnas.1513853113 [DOI] [PMC free article] [PubMed] [Google Scholar]
- Pevida, M., Lastra A., Hidalgo A., Baamonde A., and Menéndez L.. 2013. Spinal CCL2 and microglial activation are involved in paclitaxel-evoked cold hyperalgesia. Brain Res. Bull. 95:21–27. 10.1016/j.brainresbull.2013.03.005 [DOI] [PubMed] [Google Scholar]
- Prinz, M., Jung S., and Priller J.. 2019. Microglia Biology: One Century of Evolving Concepts. Cell. 179:292–311. 10.1016/j.cell.2019.08.053 [DOI] [PubMed] [Google Scholar]
- Rosales, S.L., Liang S., Engel I., Schmiedel B.J., Kronenberg M., Vijayanand P., and Seumois G.. 2018. A Sensitive and Integrated Approach to Profile Messenger RNA from Samples with Low Cell Numbers. Methods Mol. Biol. 1799:275–302. 10.1007/978-1-4939-7896-0_21 [DOI] [PubMed] [Google Scholar]
- Seretny, M., Currie G.L., Sena E.S., Ramnarine S., Grant R., MacLeod M.R., Colvin L.A., and Fallon M.. 2014. Incidence, prevalence, and predictors of chemotherapy-induced peripheral neuropathy: A systematic review and meta-analysis. Pain. 155:2461–2470. 10.1016/j.pain.2014.09.020 [DOI] [PubMed] [Google Scholar]
- Singhmar, P., Trinh R.T.P., Ma J., Huo X., Peng B., Heijnen C.J., and Kavelaars A.. 2020. The fibroblast-derived protein PI16 controls neuropathic pain. Proc. Natl. Acad. Sci. USA. 117:5463–5471. 10.1073/pnas.1913444117 [DOI] [PMC free article] [PubMed] [Google Scholar]
- Spann, N.J., Garmire L.X., McDonald J.G., Myers D.S., Milne S.B., Shibata N., Reichart D., Fox J.N., Shaked I., Heudobler D., et al. 2012. Regulated accumulation of desmosterol integrates macrophage lipid metabolism and inflammatory responses. Cell. 151:138–152. 10.1016/j.cell.2012.06.054 [DOI] [PMC free article] [PubMed] [Google Scholar]
- Tall, A.R., and Yvan-Charvet L.. 2015. Cholesterol, inflammation and innate immunity. Nat. Rev. Immunol. 15:104–116. 10.1038/nri3793 [DOI] [PMC free article] [PubMed] [Google Scholar]
- Woller, S.A., Choi S.H., An E.J., Low H., Schneider D.A., Ramachandran R., Kim J., Bae Y.S., Sviridov D., Corr M., et al. 2018. Inhibition of Neuroinflammation by AIBP: Spinal Effects upon Facilitated Pain States. Cell Rep. 23:2667–2677. 10.1016/j.celrep.2018.04.110 [DOI] [PMC free article] [PubMed] [Google Scholar]
- Yan, X., Li F., Maixner D.W., Yadav R., Gao M., Ali M.W., Hooks S.B., and Weng H.R.. 2019. Interleukin-1beta released by microglia initiates the enhanced glutamatergic activity in the spinal dorsal horn during paclitaxel-associated acute pain syndrome. Glia. 67:482–497. 10.1002/glia.23557 [DOI] [PubMed] [Google Scholar]
- Yvan-Charvet, L., Welch C., Pagler T.A., Ranalletta M., Lamkanfi M., Han S., Ishibashi M., Li R., Wang N., and Tall A.R.. 2008. Increased inflammatory gene expression in ABC transporter-deficient macrophages: free cholesterol accumulation, increased signaling via toll-like receptors, and neutrophil infiltration of atherosclerotic lesions. Circulation. 118:1837–1847. 10.1161/CIRCULATIONAHA.108.793869 [DOI] [PMC free article] [PubMed] [Google Scholar]
- Zanoni, I., Tan Y., Di Gioia M., Broggi A., Ruan J., Shi J., Donado C.A., Shao F., Wu H., Springstead J.R., and Kagan J.C.. 2016. An endogenous caspase-11 ligand elicits interleukin-1 release from living dendritic cells. Science. 352:1232–1236. 10.1126/science.aaf3036 [DOI] [PMC free article] [PubMed] [Google Scholar]
- Zhang, M., Li L., Xie W., Wu J.F., Yao F., Tan Y.L., Xia X.D., Liu X.Y., Liu D., Lan G., et al. 2016. Apolipoprotein A-1 binding protein promotes macrophage cholesterol efflux by facilitating apolipoprotein A-1 binding to ABCA1 and preventing ABCA1 degradation. Atherosclerosis. 248:149–159. 10.1016/j.atherosclerosis.2016.03.008 [DOI] [PubMed] [Google Scholar]
- Zhang, M., Zhao G.J., Yin K., Xia X.D., Gong D., Zhao Z.W., Chen L.Y., Zheng X.L., Tang X.E., and Tang C.K.. 2018. Apolipoprotein A-1 Binding Protein Inhibits Inflammatory Signaling Pathways by Binding to Apolipoprotein A-1 in THP-1 Macrophages. Circ. J. 82:1396–1404. 10.1253/circj.CJ-17-0877 [DOI] [PubMed] [Google Scholar]
- Zhou, Y., Zhou B., Pache L., Chang M., Khodabakhshi A.H., Tanaseichuk O., Benner C., and Chanda S.K.. 2019. Metascape provides a biologist-oriented resource for the analysis of systems-level datasets. Nat. Commun. 10:1523. 10.1038/s41467-019-09234-6 [DOI] [PMC free article] [PubMed] [Google Scholar]
- Zhu, X., Owen J.S., Wilson M.D., Li H., Griffiths G.L., Thomas M.J., Hiltbold E.M., Fessler M.B., and Parks J.S.. 2010. Macrophage ABCA1 reduces MyD88-dependent Toll-like receptor trafficking to lipid rafts by reduction of lipid raft cholesterol. J. Lipid Res. 51:3196–3206. 10.1194/jlr.M006486 [DOI] [PMC free article] [PubMed] [Google Scholar]
Associated Data
This section collects any data citations, data availability statements, or supplementary materials included in this article.
Supplementary Materials
lists the key resources used in this paper, including their source and identifier numbers.
shows quality controls for sequencing analyses.
Data Availability Statement
The Gene Expression Omnibus accession no. for the sequencing results reported in this paper is GSE154816. The data can be explored at https://ncbi.nlm.nih.gov/geo/. All custom analysis scripts and data that support the conclusions are available from the authors on request.


