

Abstract
Primary liver cancer represents a major health problem. It comprises hepatocellular carcinoma (HCC) and intrahepatic cholangiocarcinoma (ICC), which differ markedly with regards to their morphology, metastatic potential and responses to therapy. However, the regulatory molecules and tissue context that commit transformed hepatic cells towards HCC or ICC are largely unknown. Here we show that the hepatic microenvironment epigenetically shapes lineage commitment in mosaic mouse models of liver tumorigenesis. Whereas a necroptosis-associated hepatic cytokine microenvironment determines ICC outgrowth from oncogenically transformed hepatocytes, hepatocytes containing identical oncogenic drivers give rise to HCC if they are surrounded by apoptotic hepatocytes. Epigenome and transcriptome profiling of mouse HCC and ICC singled out Tbx3 and Prdm5 as major microenvironment-dependent and epigenetically regulated lineage-commitment factors, a function that is conserved in humans. Together, our results provide insight into lineage commitment in liver tumorigenesis, and explain molecularly why common liver-damaging risk factors can lead to either HCC or ICC.
Chronic liver inflammation and liver cirrhosis represent the most important risk factors for the development of primary liver cancer. Primary liver cancer comprises hepatocellular carcinoma (HCC) and intrahepatic cholangiocarcinoma (ICC), which are distinct with respect to their morphology, metastatic capacity and their response to cancer therapy1,2. Whereas HCC grow in a solid, trabecular and sometimes pseudoglandular pattern with a high density of tumour cells, ICC are composed of ductular, papillary or solid tumour structures embedded in a dense tumour stroma, a feature shared with ontogenetically related pancreatic ductal adenocarcinomas3. HCC mostly show a local invasive growth restricted to the liver, whereas ICC tend to metastasize early, and also to distant organs4. Liver cells contain a high grade of cellular plasticity and it has been suggested that HCC and ICC both can derive from hepatocytes5,6.
Epidemiological data indicate that in western countries, common liver-damaging risk factors such as obesity, alcohol abuse, dyslipidaemia, metabolic syndrome and steatohepatitis predispose to HCC as well as ICC development7,8. However, so far the molecular mechanisms that determine HCC growth in some patients and ICC growth in others remain elusive.
Here we report that the hepatic microenvironment determines lineage commitment in liver tumorigenesis via epigenetic regulation. Using mosaic mouse models, we demonstrate that a necroptosis-associated hepatic cytokine microenvironment switches HCC to ICC development, independently of the oncogenic drivers. Pharmacological or genetic suppression of necroptosis revert the necroptosis-dependent cytokine microenvironment and switches ICC to HCC. Epigenome and transcriptome profiling of mouse HCC and ICC identified Tbx3 and Prdm5 as major microenvironment-dependent and epigenetically regulated lineage-commitment factors, which were validated in a cohort of 199 cases of human HCC and ICC. Our study provides fundamental insights into how lineage commitment in liver tumorigenesis is regulated, and explains how common hepatic risk factors such as a western lifestyle and fatty liver disease can lead to the development of either HCC or ICC.
Generation of HCC or ICC using transposon mouse models
To study liver tumorigenesis in mice, we used a well-established mouse model in which transposable elements are stably delivered into the liver via hydrodynamic tail-vein (HDTV) injection9,10. To model the frequent upregulation of MYC and the induction of the MEK-ERK or PI3K-mTOR signalling in human HCC11, we engineered transposon vectors co-expressing oncogenic mouse Myc and mouse NrasG12V (pCaMIN) or mouse Myc and human AKT1 (pCaMIA) (Extended Data Fig. 1a). When HDTV was used to co-deliver these vectors together with a sleeping beauty transposase (SB13)-encoding plasmid (pSB13) into the hepatocytes of p19Arf−/− (encoded by the Cdkn2a locus) mice, we observed multifocal liver carcinomas (Fig. 1a), which resembled HCC with a solid and sometimes trabecular growth pattern and steatosis (Extended Data Fig. 1b). Immunohistochemistry revealed strong expression of the hepatocyte-specific transcription factor hepatocyte nuclear factor-4α (HNF4α) (Fig. 1b) but a lack of biliary type keratin 19 (K19) expression (Fig. 1c), therefore confirming all pCaMIN- and pCaMIA-induced tumours to be HCC (Extended Data Fig. 1d).
Fig. 1 |. Intrahepatic delivery of transposable elements encoding Myc and NrasG12V or Myc and AKT1 into p19Arf−/− mice results in multifocal HCC or unilocular ICC.
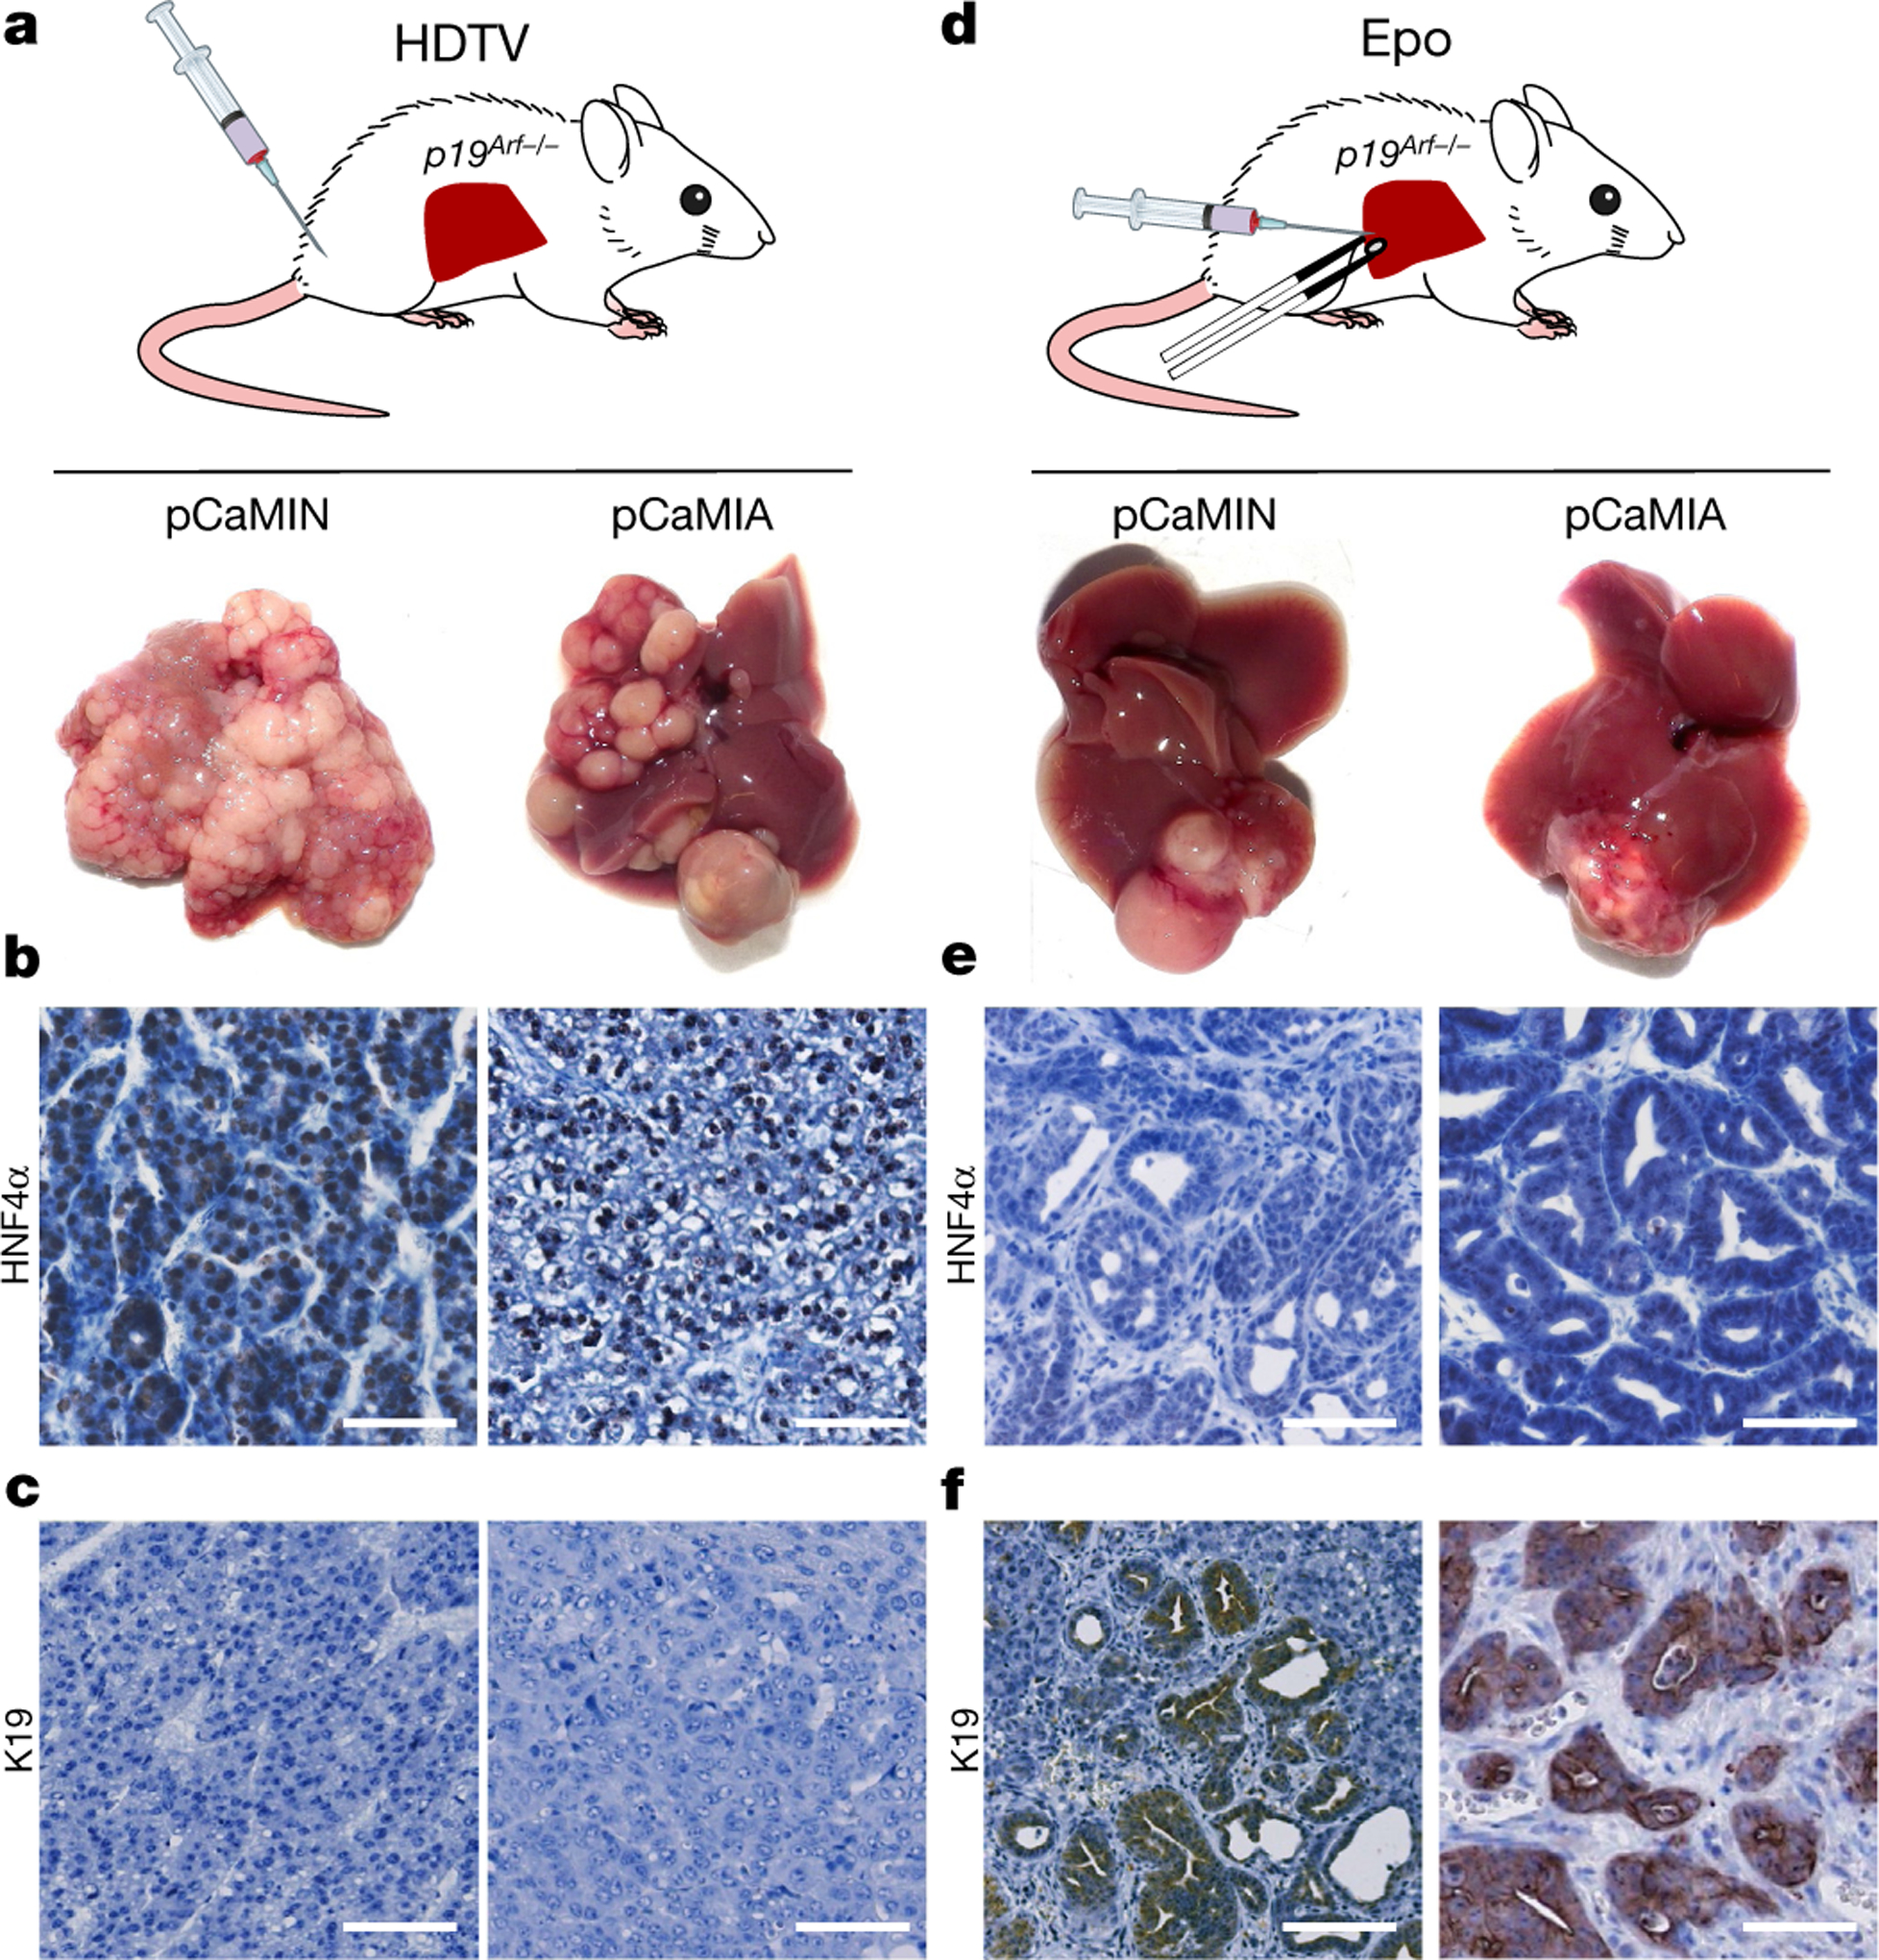
a, Intrahepatic delivery of the transposable vectors pCaMIN (encoding Myc and NrasG12V; compare Extended Data Fig. 1a) (n = 11) or pCaMIA (encoding Myc and AKT1; compare Extended Data Fig. 1b) (n = 14) via HDTV results in multifocal tumour development after 4 weeks. b, c, Representative micrographs of immunohistochemistry staining against K19 (b) and HNF4α (c). Scale bar, 100 μm. d, Epo treatment of pCaMIN (compare Extended Data Fig. 1a) (n = 19) or pCaMIA (compare Extended Data Fig. 1b) (n = 8) results in the development of unilocular liver carcinomas 4 weeks after electroporation. e, f, Representative immunohistochemistry images of K19 (e) and HNF4α (f). Scale bars, 100 μm. Experiments were conducted in three independent cohorts.
Development of multifocal HCC throughout the liver is a situation often seen in patients with advanced-stage HCC. However, to study unilocular hepatocellular carcinomas, we first injected pCaMIN or pCaMIA under the liver capsule and then applied in vivo electroporation (Epo), which efficiently and focally transfects hepatocytes12 (Fig. 1d). Histopathological and immunohistochemistry analysis revealed that most tumours were either ICC or combined ICC–HCC (Extended Data Fig. 1c, e) developing focally at the electroporation site (Fig. 1g), staining negatively or weakly and focally restricted for HNF4α (Fig. 1e) but strongly positive for K19 (Fig. 1f).
In vivo lineage tracing reveals hepatic origin of ICC
Recent studies suggested that ICC can be derived from cholangiocytes, liver progenitor cells or hepatocytes5,13. To determine the cell of origin of tumorigenesis induced by Epo, we used a well-established lineage-tracing mouse model, in which only differentiated hepatocytes show a switch from red to green fluorescence14. These mice were crossed on a p19Arf-deficient background to obtain ROSAmT/mG × Alb-cre × p19Arf−/− mice (Fig. 2a, Extended Data Fig. 1f). Next, we stably delivered pCaMIN transposon vectors by either HDTV or Epo. Whereas HDTV of pCaMIN again triggered the growth of HCC (HNF4α+, K19−), Epo delivery still resulted in the development of ICC (HNF4α−, K19+) (Fig. 2b, Extended Data Fig. 1g, h). Native fluorescence analysis of HDTV-induced HCC and Epo-triggered ICC revealed homogenous green fluorescence throughout the tumours, thereby identifying differentiated hepatocytes as the cells of origin (Fig. 2c) for both tumour types. Co-localization of native GFP (green) and K19 (red; Extended Data Fig. 1i) confirmed the hepatocytic origin of K19-positive ICC. The ICC typical tumour stroma only showed red fluorescence (Fig. 2c).
Fig. 2 |. In vivo lineage tracing identifies hepatocytes as cells of origin for ICC development.
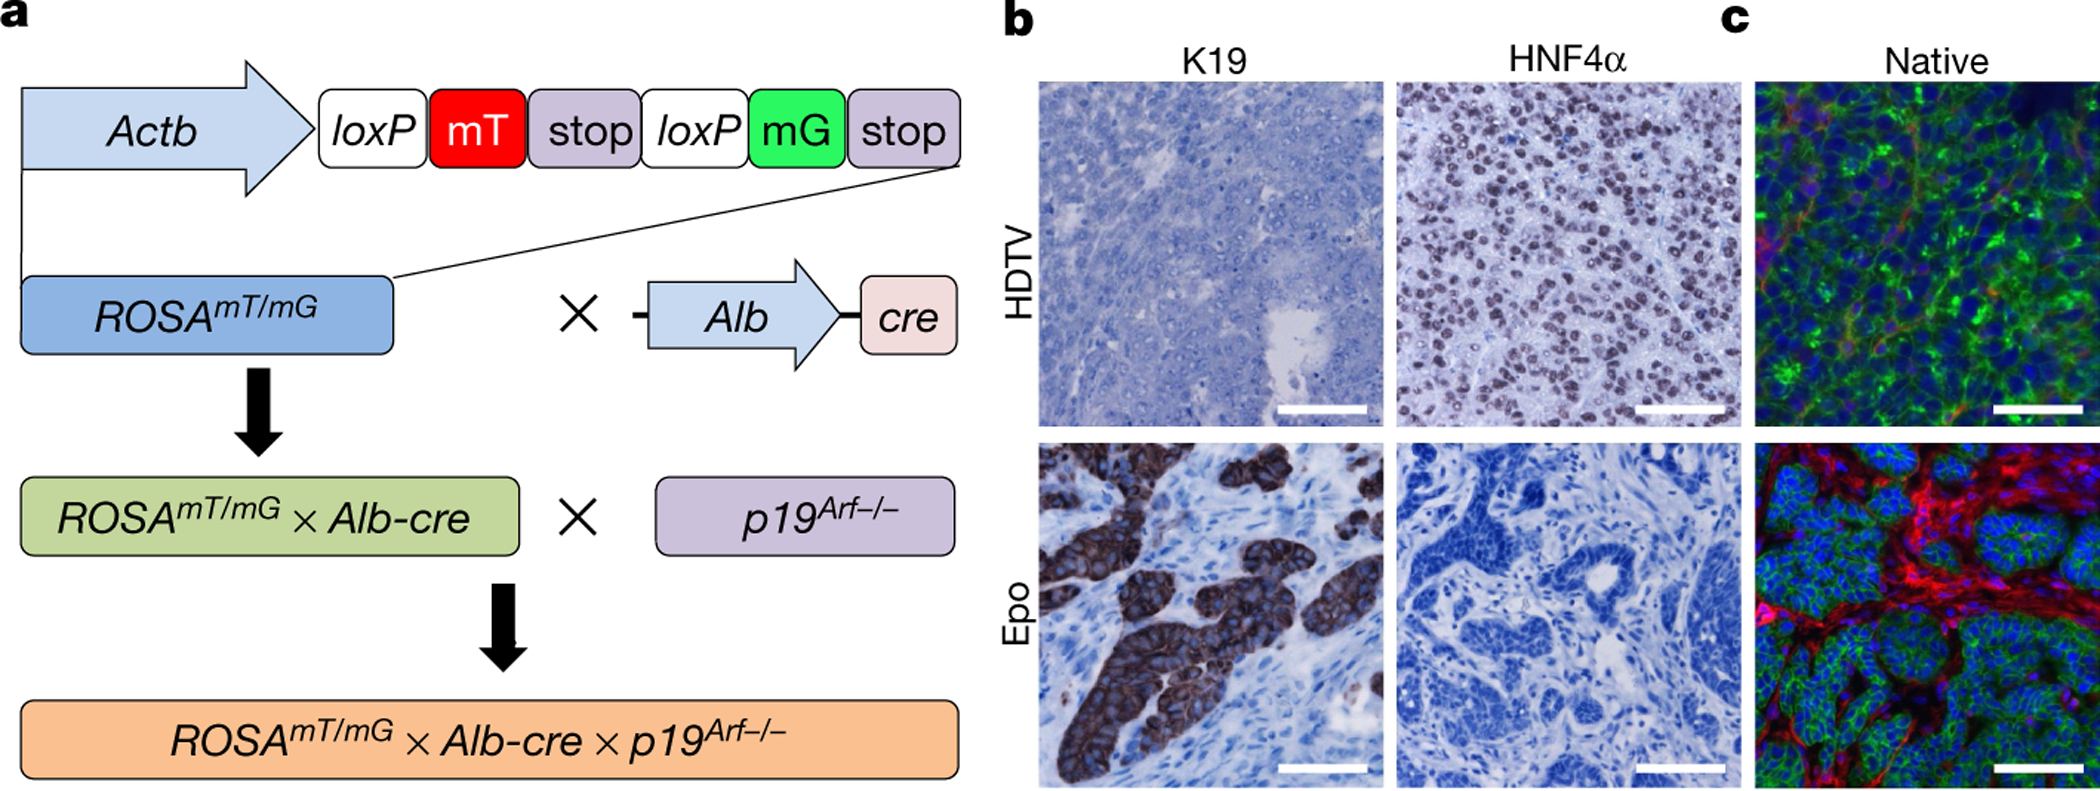
a, ROSAmT/mG mice were crossed to Alb-cre mice. The resulting mice were intercrossed with p19Arf−/− mice to generate ROSAmT/mG × Alb-cre × p19Arf−/− mice. b, c, Representative images of tumours 4 weeks after HDTV (top) or Epo (bottom) treatment of the pCaMIN vector in ROSAmT/mG × Alb-cre × p19Arf−/−. Shown are immunohistochemistry staining results using antibodies against K19 and HNF4α (b) as well as native fluorescence (c) (n = 4). Scale bars, 100 μm.
Microenvironment determines lineage commitment
We next sought to address why HDTV-mediated transposon delivery leads to HCC, but delivery of the same vectors via Epo leads to ICC. To exclude the role of quantitative differences in transposon integration, we injected pCaMIN via HDTV followed by a mock Epo treatment (without DNA) of a defined area of the same liver two hours later (Fig. 3a). Histopathological analyses identified developing tumours as ICC or combined ICC–HCC (Fig. 3b, c), whereas HDTV-induced tumours were pure HCC (Fig. 3b, d). Quantitative PCR (qPCR) analyses with transposon-specific primers on HDTV-mediated HCC and Epo-mediated ICC ruled out the possibility that different levels of transposon integration contribute to the distinct tumour phenotypes (Extended Data Fig. 1j, k).
Fig. 3 |. Electroporation associated microenvironment determines outgrowth of ICC from hepatocytes.
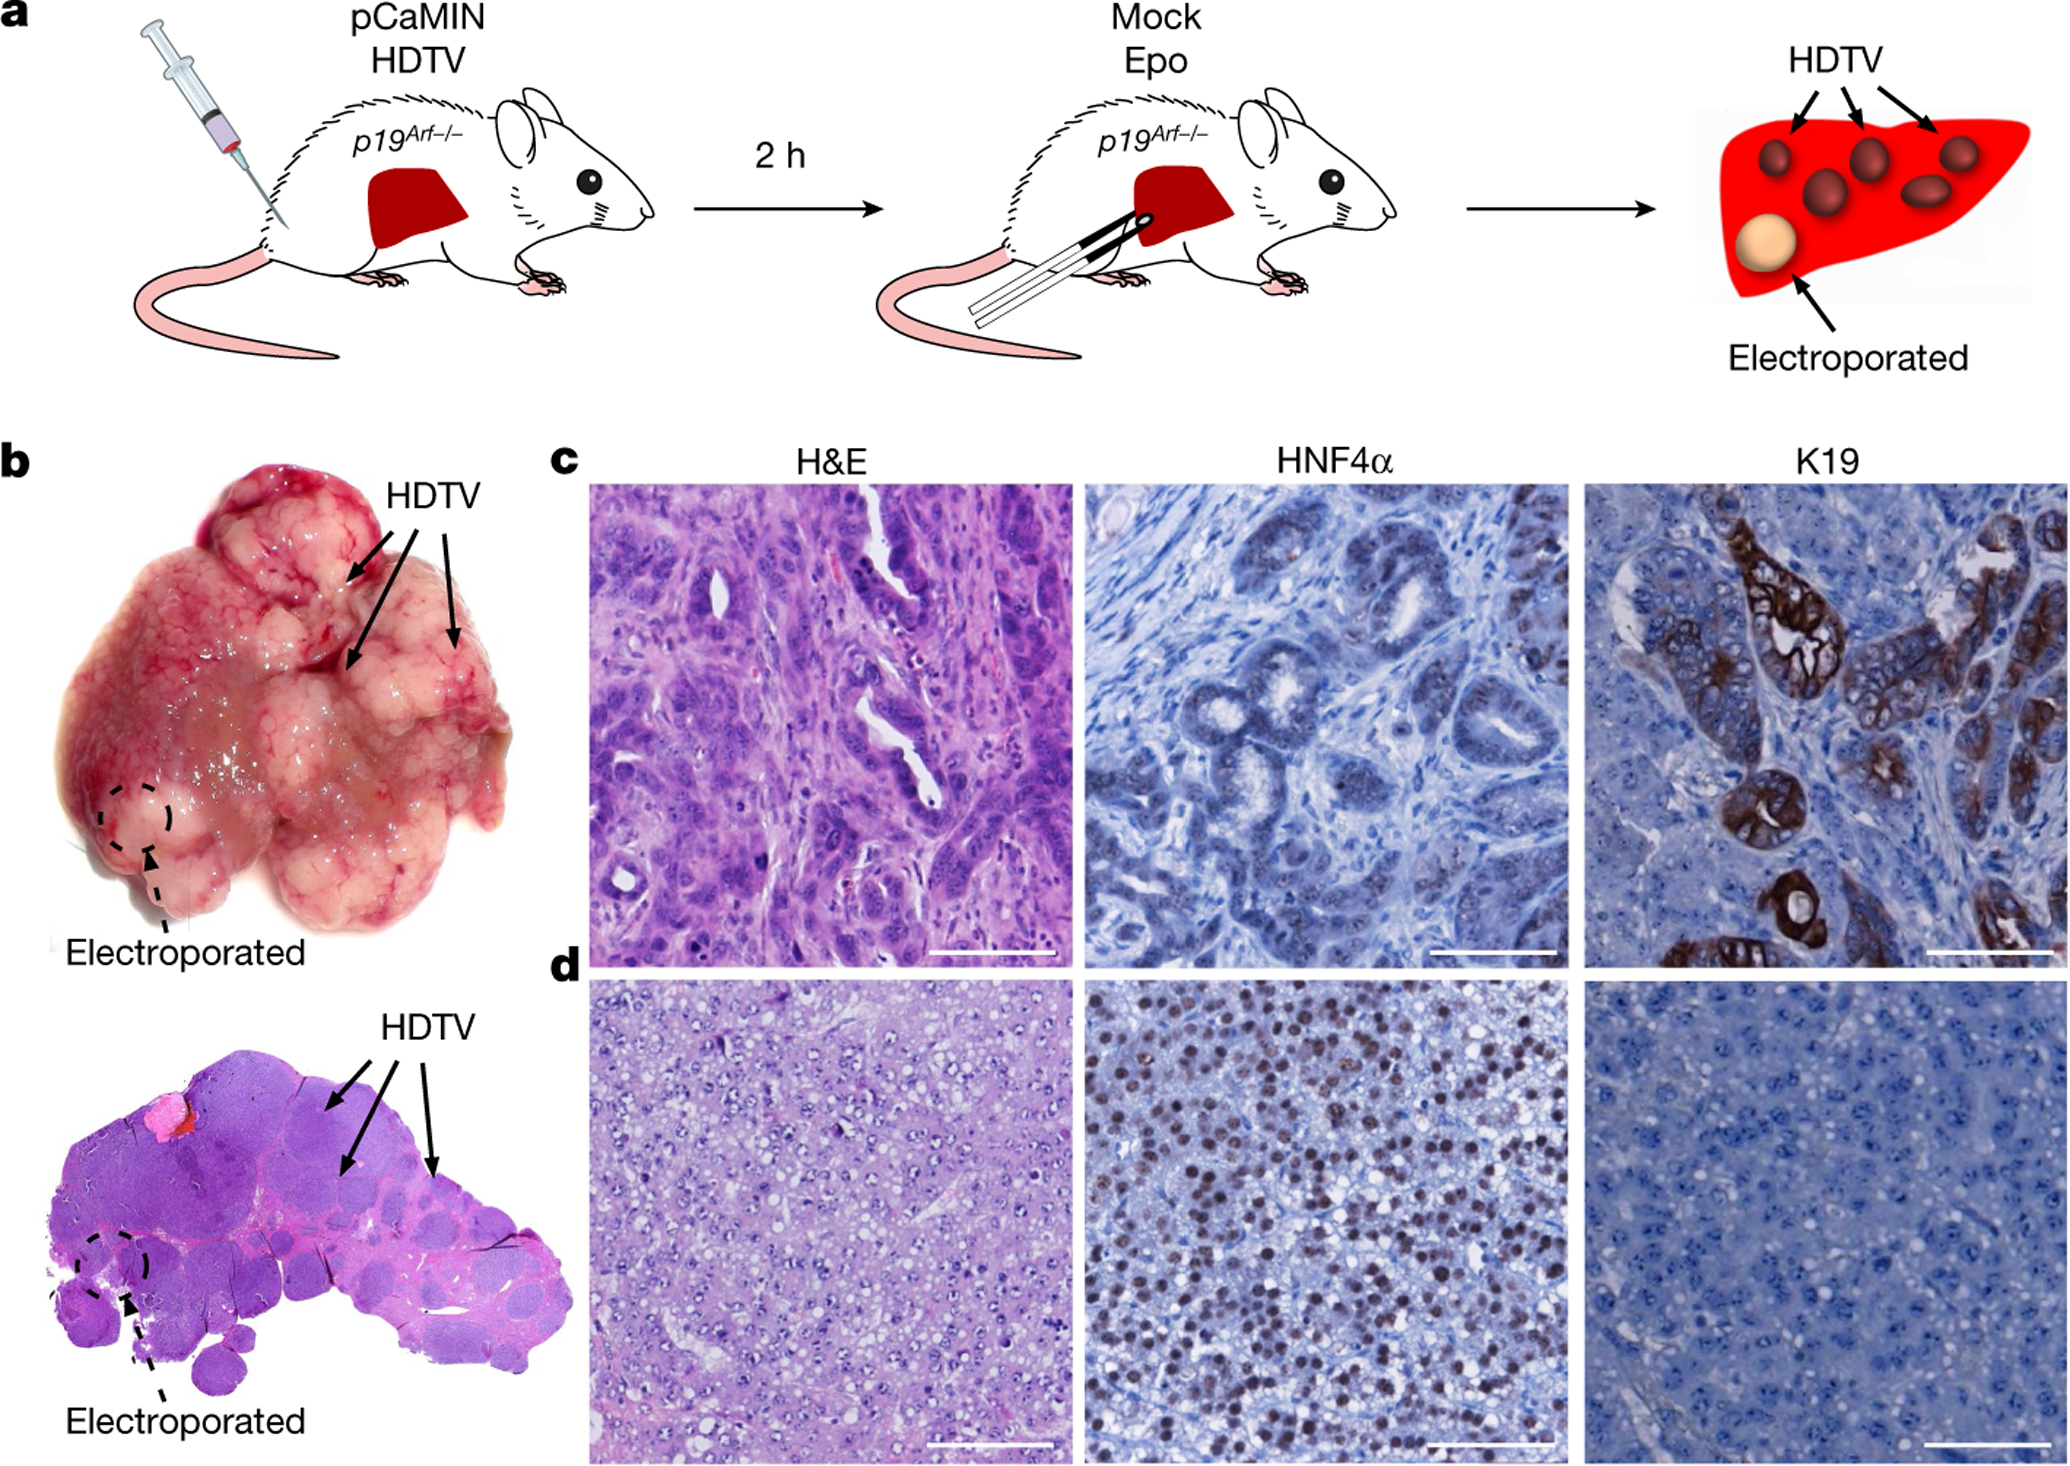
a, Schematic experimental outline. Livers of p19Arf−/− mice were first hydrodynamically injected with pCaMIN and SB13 vectors and subsequently mock electroporated at a defined liver region. b, Macroscopic photograph of mouse liver (top) and corresponding representative haematoxylin and eosin (H&E) staining (bottom) 3 weeks after HDTV and subsequent mock Epo treatment (n = 3). Scale bars, 500 μm. (c, d) Representative photographs of H&E-(left panel), HNF4α- (middle panel) and K19 stained (right panel) tumours in the mock electroporated area (scale bar, 100 μm) or (d) outside (n = 3) (scale bar, 100 μm).
We hypothesized that liver electroporation might cause genetic mutations that drive cholangiocytic lineage determination. Indeed, several genes and pathways have been reported to affect lineage commitment in liver tumorigenesis13. Therefore, we conducted laser capture microdissection and ‘purified’ HCC versus ICC tissues from mice containing pCaMIN Epo-induced mixed ICC–HCC tumours (Extended Data Fig. 2a). Apart from the engineered NrasG12V mutation we found 12 recurrent mutations (Extended Data Fig. 2b) including mutations in the hydrase function gene Car7 or the glycoprotein Dag1; however, both mutations were found in HCC and ICC samples. Notably, Fam72a mutations were exclusively found in two HCC samples, and Smc3 mutations were exclusively found in two ICC samples. Yet, interrogation of the COSMIC and cBioPortal databases did not reveal specificity of mutations for HCC and ICC, respectively, and functional testing of mutated Fam72a in our mouse model had no effect on lineage commitment (Extended Data Fig. 2c, d).
Necroptosis-dependent microenvironment leads to ICC
Next, we investigated whether HDTV and Epo treatment differentially shape specific hepatic microenvironments to determine HCC or ICC. We analysed pCaMIN-injected livers with HDTV or Epo within the first 5 days, a time in which lineage commitment can be distinguished in precursor lesions (HNF4α−, K19+ microcarcinomas after Epo and HNF4α+, K19− microcarcinomas after HDTV; Extended Data Fig. 3a).
Three days after HDTV or Epo treatment, both methods induce eosinophilic areas of damaged tissue with an associated inflammatory reaction (Extended Data Fig. 3b). Hepatic stellate cells are important cells that shape the hepatic microenvironment after liver damage15. However, immunostaining analysis of αSMA did not reveal differences between HDTV- and Epo-treated livers (Extended Data Fig. 4a). Similarly, the quantification of Kupffer cells did not reveal differences between the two groups (Extended Data Fig. 4b), and clodronate-mediated depletion of Kupffer cells did not affect tumour phenotype (Extended Data Fig. 4c).
Next, we performed immunohistochemistry for T cells (CD3), monocytes and (neutrophilic) granulocytes (Ly6G) as well as B cells (B220) and antigen-presenting cells (MHCII) to compare inflammatory infiltrates in HDTV- versus Epo-treated livers (Fig. 4a, b). Notably, no significant differences between HDTV- and Epo-treated mouse livers could be observed (Extended Data Fig. 4d). Further quantifications of immune cells via flow cytometry did not reveal changes in the numbers of T cells (helper or killer) or immature myeloid cells (monocytic or neutrophilic) or macrophages (Extended Data Fig. 4e, f).
Fig. 4 |. Necroptosis-dependent cytokine microenvironment determines cholangiocarcinoma development.
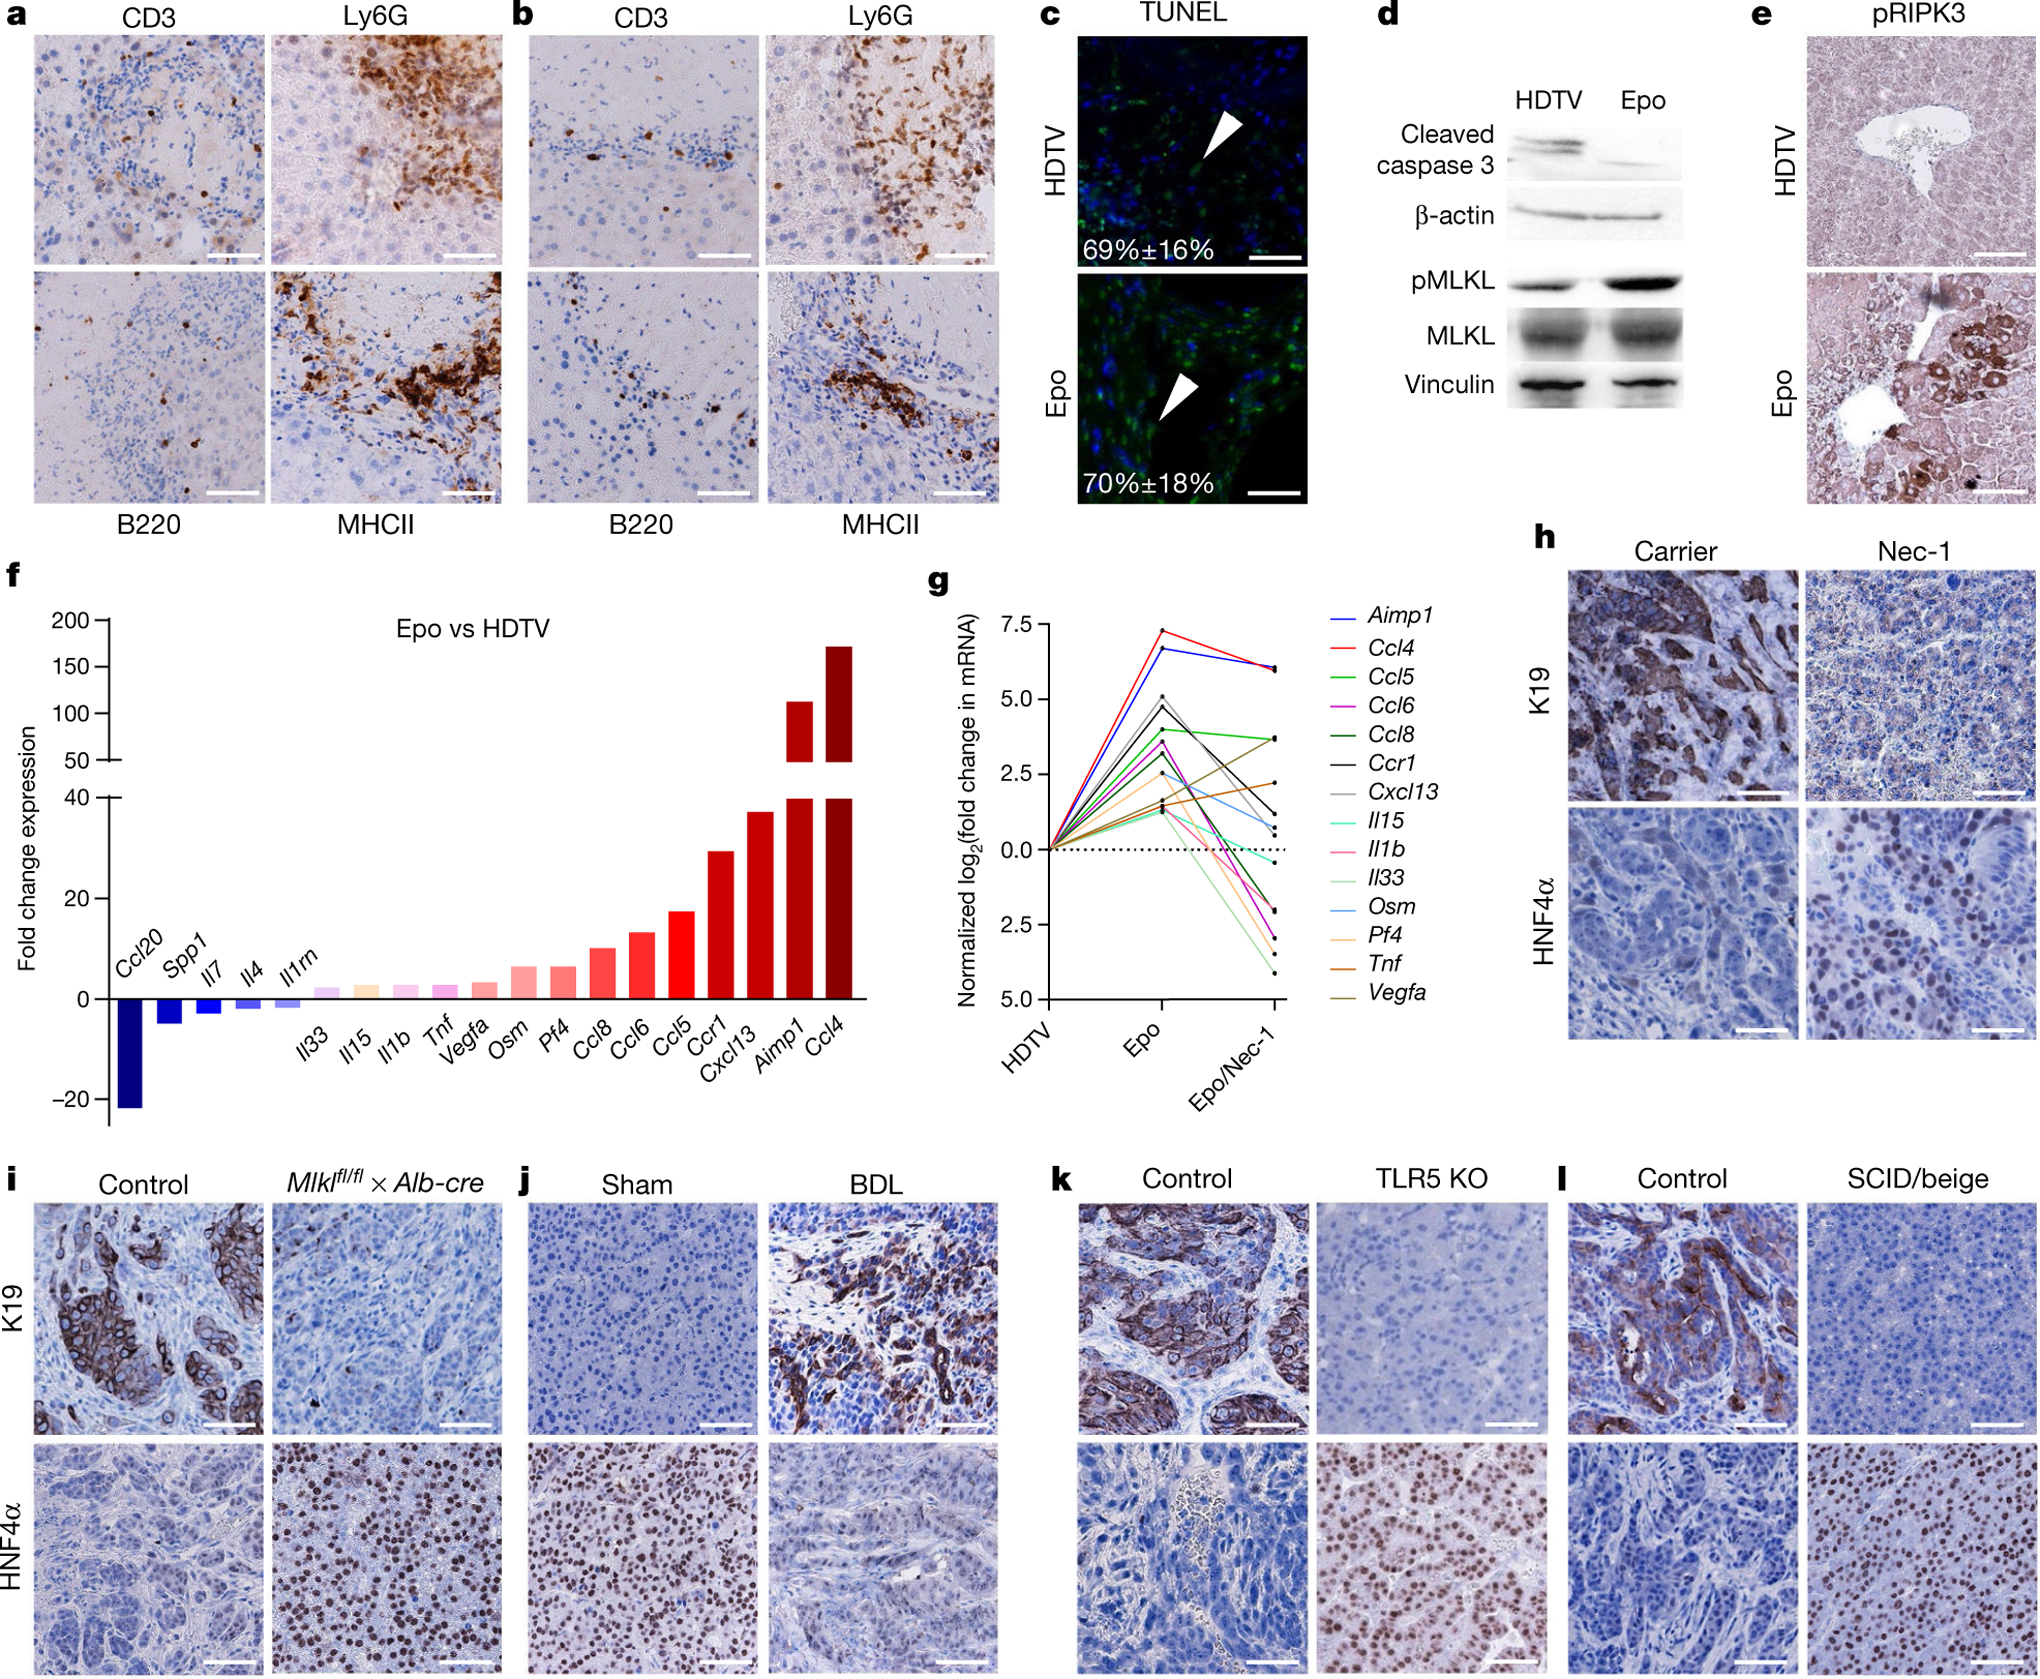
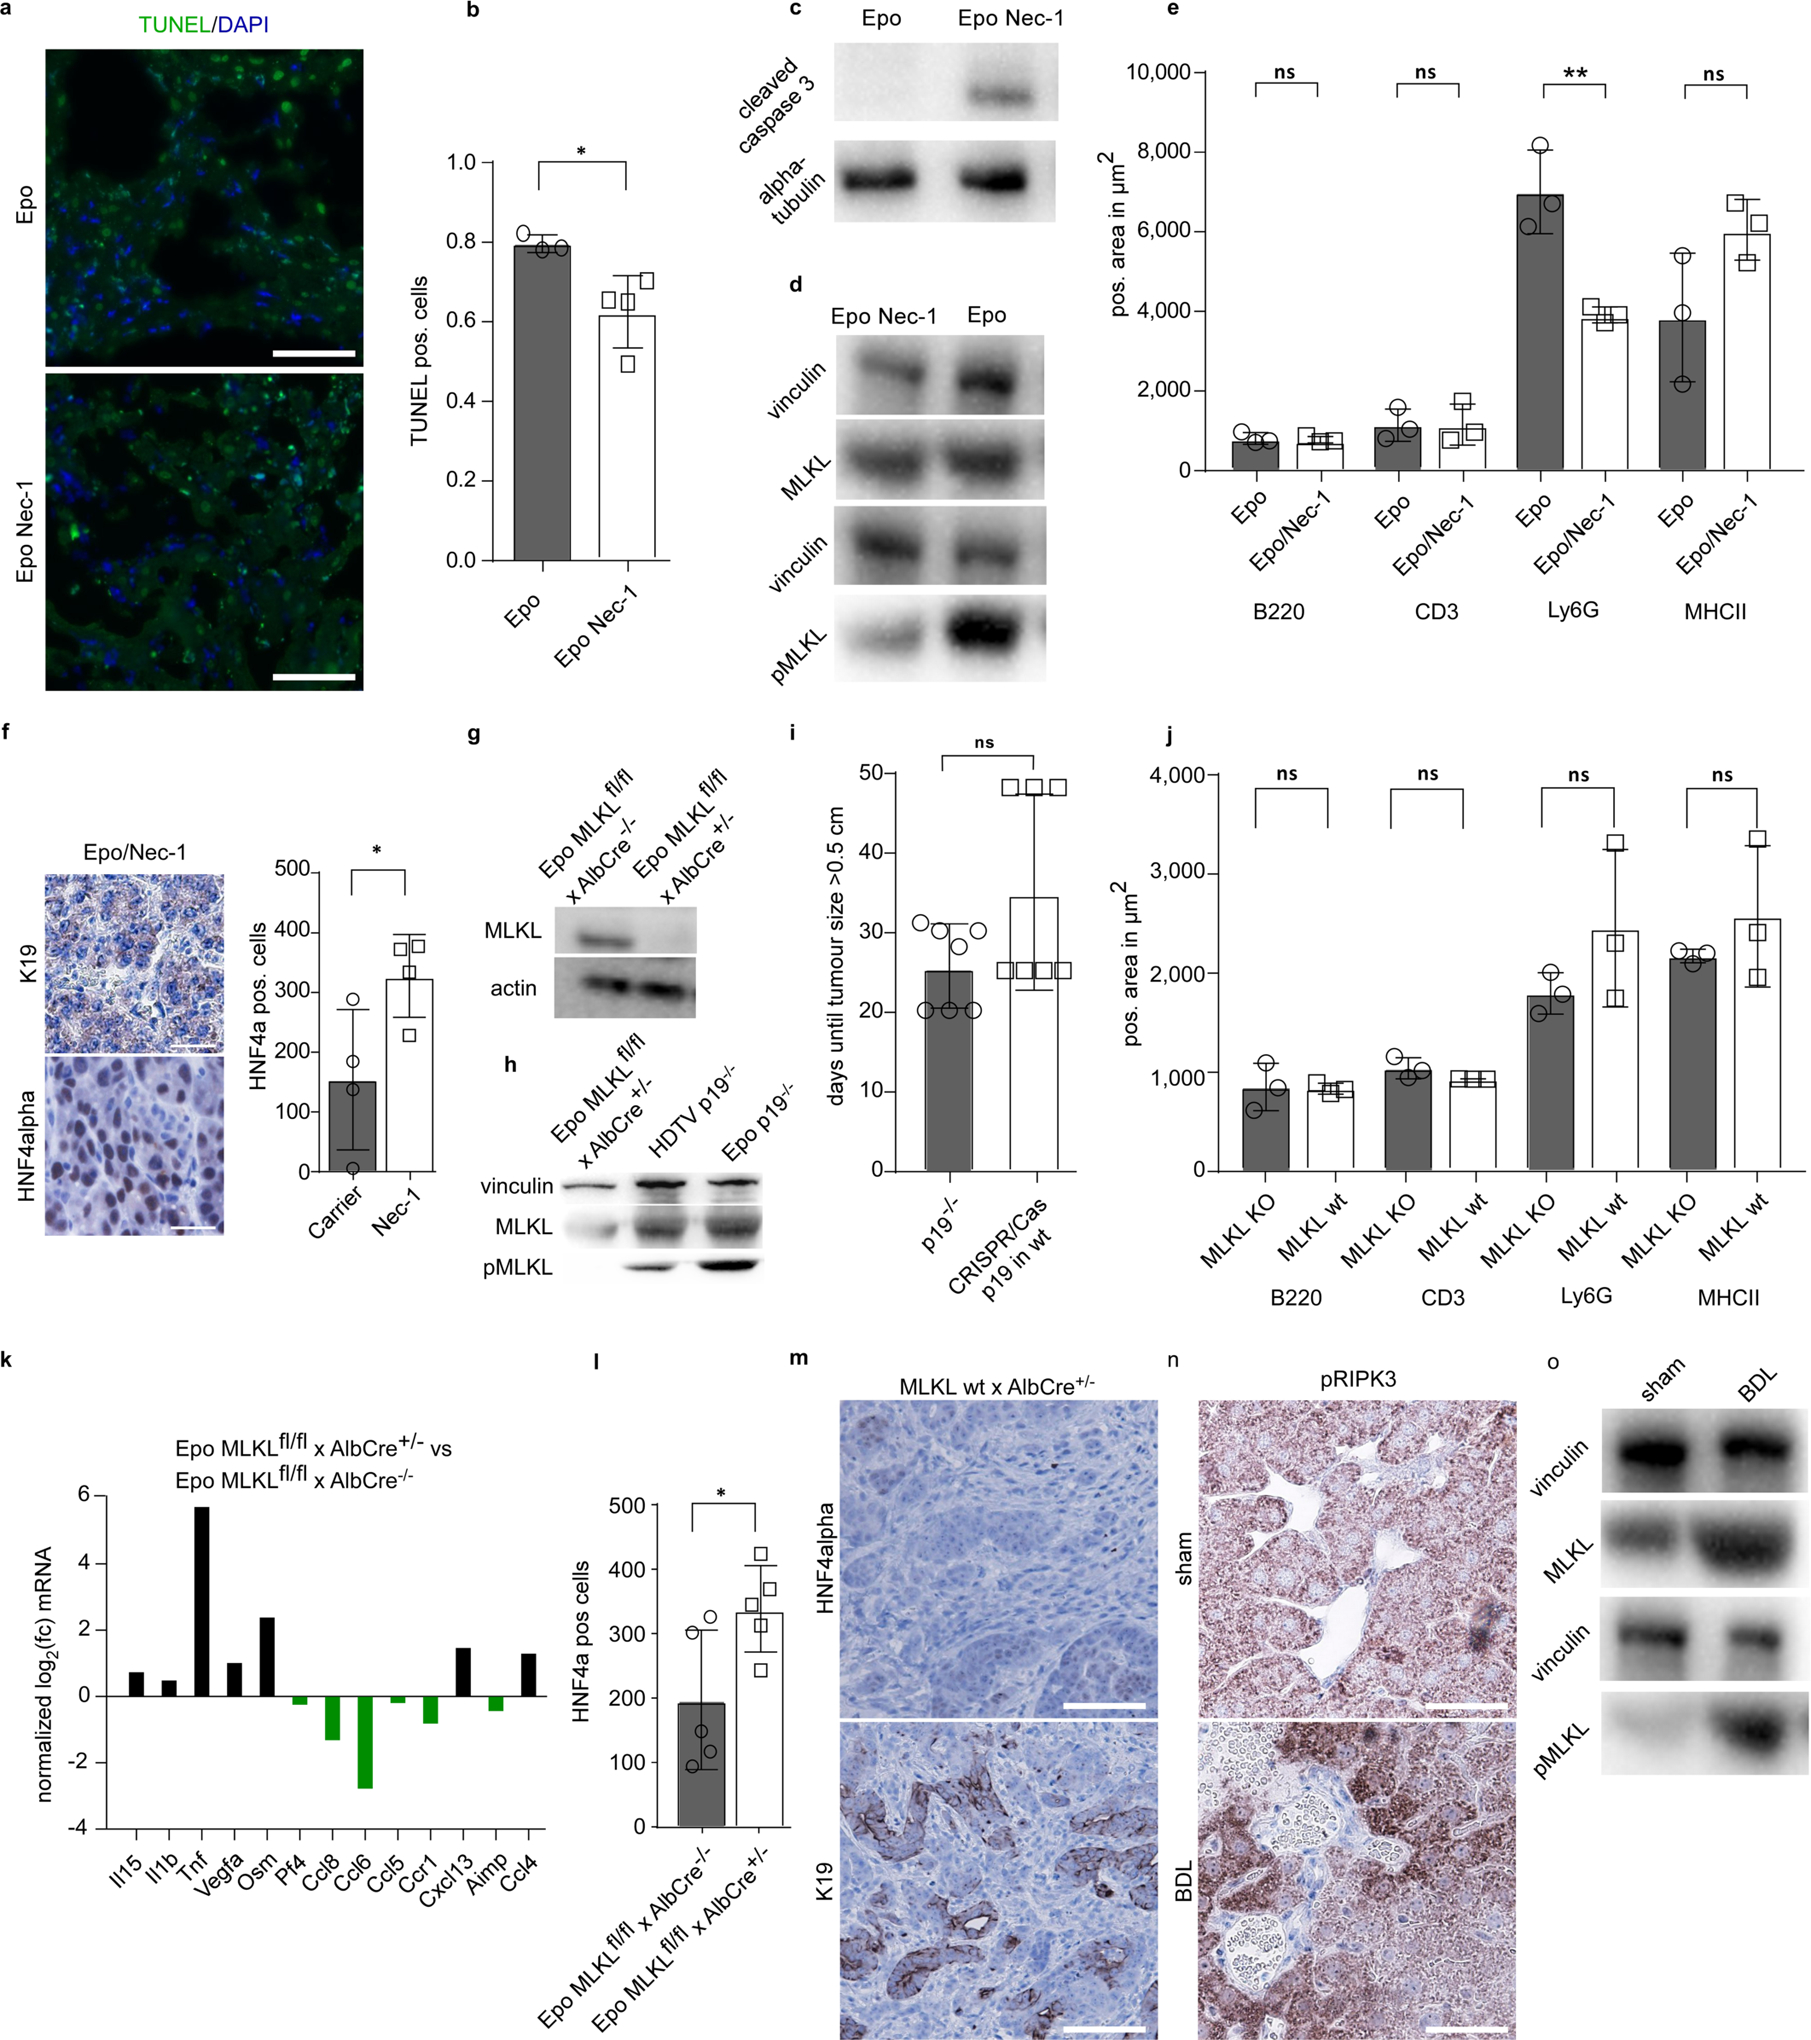
a, b, Immunohistochemistry for CD3, Ly6G, B220 and MHCII 3 days after HDTV (a) or Epo (b) transfection of pCaMIN and SB13 into p19Arf−/− mice (n = 4). Scale bars, 100 μm. c, TUNEL staining (green fluorescence, white arrowheads) and quantification on liver sections 3 days after pCaMIN transfection via HDTV (top) or Epo (bottom) (n = 3). Nuclei were counterstained blue with DAPI. Scale bars, 100 μm. d, Western blot for apoptosis marker cleaved caspase 3 (top) and total or phosphorylated MLKL (pMLKL) (bottom) in liver lysates after transfection via HDTV or Epo (n = 3). e, Immunohistochemistry for pRIPK3 3 days after transfection via Epo or HDTV (n = 3 each). Scale bars, 100 μm. f, Cytokine mRNA expression (fold change) in Epo- versus HDTV-treated liver after 3 days (n = 2). Data represent fold change of the mean from each group. g, Cytokine mRNA expression (fold induction) in Epo-treated versus HDTV-treated or Epo- and Nec-1-treated versus Epo-treated livers (n = 2). Data are log2 fold change of the mean from each group. h, Immunohistochemistry for K19 and HNF4α of mice pre-treated with carrier (left) or Nec-1 (right) before pCaMIN Epo transfection (n = 4). Scale bars, 100 μm. i, Immunohistochemistry for K19 and HNF4α on liver tumour sections of Mlklfl/fl × Alb-cre−/− (left) or Mlklfl/fl × Alb-cre+/− (right) mice after pCaMIN Epo transfection (n = 5). Scale bars, 100 μm. Compare to Extended data Fig. 6m. j, Immunohistochemistry for K19 and HNF4α. p19Arf−/− mice were subjected to HDTV and sham operation (control, left, n = 3), or bile duct ligation (BDL) and HDTV of pCaMIN (right, n = 5). Scale bars, 100 μm. k, Immunohistochemistry for K19 and HNF4α on liver sections from wild-type (n = 4) (left) or TLR knockout (KO; lacking TLR2, TLR3, TLR4, TLR7 and TLR9) (n = 3) mice (right) after pCaMIN Epo transfection. Scale bars, 100 μm. l, Immunohistochemistry for K19 and HNF4α on wild-type (n = 4) (left) or SCID/beige (n = 8) mice (right) after pCaMIN Epo transfection. Scale bars, 100 μm.
We then applied TUNEL staining, which detects several types of cell death including necrosis, apoptosis and necroptosis16. TUNEL staining did not reveal any differences in the overall number of dying cells in mouse livers transfected with HDTV (69% ± 16%; mean ± s.d.) or Epo (70% ± 18%) (Fig. 4c). Dying cells were found to be hepatocytes as the TUNEL signal (red fluorescence) co-localized with membrane-associated green fluorescent protein (GFP) of hepatocytes (ROSAmT/mG × Alb-cre × p19Arf−/− mouse) (Extended Data Fig. 5a).
Apoptosis and necroptosis are two relevant forms of cell death in the pathogenesis of human liver disease17. To discriminate between these two types of cell death, we performed western blot analyses, which revealed high levels of the apoptosis marker cleaved caspase 3 in HDTV-treated livers but only low levels in Epo-treated livers, indicating that HDTV predominantly induces apoptosis (Fig. 4d, top). Necroptosis was described to be involved in the pathogenesis of different liver diseases such as non-alcoholic steatohepatitis or drug-induced liver injury17–19. In these studies, necroptosis was mostly determined by quantification of RIPK3, a kinase that also has functions outside the necroptosis signalling cascade. Notably, Epo-treated livers showed high levels of phosphorylated MLKL and increased mRNA levels of Ripk3 (Fig. 4d, bottom, Extended Data Fig. 5b), both biomarkers for necroptosis, when compared to HDTV-treated mouse livers. In addition, immunohistochemistry staining of total RIPK3 and phosphorylated RIPK3 (pRIPK3) revealed positive signals in the electroporation area (Fig. 4e and Extended Data Fig. 5c).
Cells undergoing necroptosis release damage-associated molecular patterns that can shape the microenvironment via a pattern-recognition-receptor-dependent cytokine release in immune cells20. Therefore, we conducted cytokine expression profiling revealing a strong induction of different cytokines in Epo- versus HDTV-treated livers (Fig. 4f). The most differentially regulated factors we identified included Ccl4, Aimp1, Cxcl13, Ccl6, Ccl8, Pf4 and Osm.
To address whether these are causally linked to the high levels of necroptotic cell death in Epo-treated livers, we used necrostatin-1 (Nec-1), a very potent inhibitor of RIPK121 and suppressor of necroptosis. Pre-treatment (starting 3 days before Epo) with Nec-1 for 3 days significantly reduced Epo-induced cell death as detected by TUNEL assay (Extended Data Fig. 6a, b), and shifted cell death towards apoptosis, as shown by caspase 3 cleavage (Extended Data Fig. 6c). Nec-1 treatment efficiently dampened necroptosis as shown by a reduced pMLKL signal (Extended Data Fig. 6d). Immune cell profiling revealed that Nec-1 treatment did not affect the numbers of intrahepatic B220-positive cells, CD3-positive cells and MHCII-positive cells (Extended Data Fig. 6e). A significant reduction was found only for Ly6G-positive cells in the Nec-1-treated versus carrier-treated mice after Epo treatment (Extended Data Fig. 6e). Notably, Nec-1-attenuated the induction of most Epo-associated cytokines (Fig. 4g) and switched ICC development towards the outgrowth of solid or trabecular HNF4α-positive HCC tumours with no or only weak K19 expression (Fig. 4h and Extended Data Fig. 6f). By contrast, carrier-treated mice still revealed an ICC phenotype with K19-positive glandular structures and only microfocal HNF4α-positive areas (Fig. 4h). To confirm the decisive role of necroptosis in liver cancer lineage commitment, we generated hepatocyte-specific Mlkl knockout mice by intercrossing MLKLfl/fl mice22 with Alb-cre mice23, resulting in Alb-cre × Mlklfl/fl mice (MLKLΔHep). Western blot analysis of isolated hepatocytes confirmed hepatocyte-specific knock-out of Mlkl (Extended Data Fig. 6g). Further, hepatic MLKL deficiency completely abolished the pMLKL signal 3 days after Epo treatment (Extended Data Fig. 6h).
Next, we subjected Alb-cre+/− × Mlklfl/fl or Alb-cre−/− × Mlklfl/fl mice to Epo treatment with pCaMIN together with a plasmid encoding Cas9n and a single guide RNA (sgRNA) against p19Arf. CRISPR-induced p19 knockout robustly allowed for tumour development after pCaMIN delivery, and this was slightly delayed compared to the germline p19Arf knockout (Extended Data Fig. 6i). Hepatocyte-specific MLKL deficiency had no influence on the hepatic immune cell infiltrates (Extended Data Fig. 6j); however, in line with our Nec-1 experiments, we found a reduction of Epo-associated cytokines (Extended Data Fig. 6k).
When MLKLΔHep mice were followed up for tumour development after pCaMIN Epo treatment, we found outgrowth of solid, HNF4α-positive HCC, whereas control mice developed K19-positive ICC (Mlklfl/fl × Alb-cre−/– or Mlkl wild-type × Alb-cre+/−; Fig. 4i and Extended Data Fig. 6l, m). Collectively, our data suggest that a necroptosis-enriched liver microenvironment promotes ICC outgrowth from oncogenically transformed hepatocytes.
Our findings were further validated in a mouse model of bile duct ligation-mediated liver damage, in which necroptotic cell death is prominent19 (Extended Data Fig. 6n, o). Notably, pCaMIN HDTV treatment after bile duct ligation induced the outgrowth of K19-positive and mostly HNF4a-negative poorly differentiated liver carcinomas that morphologically resemble tumours with mixed hepatobiliary features (Fig. 4j).
To address whether the identified mechanism of lineage determination also holds true in primary human liver tumorigenesis, we investigated mRNA expression of apoptosis (n = 83) or necroptosis (n = 10) related genes (Supplementary Table 4) in a cohort comprising 199 cases of HCC and ICC24. Hierarchical clustering analysis revealed that a necroptosis signature is enriched in patients with ICC compared to those with HCC. By contrast, we found an ‘apoptosis signature’ in HCC (Extended Data Fig. 7a). Of note, RIPK3 expression was significantly increased in ICC compared to HCC samples (Extended Data Fig. 7b).
To address the role of Toll-like receptors (TLRs), which can induce cytokine release after activation by necroptotic damage-associated molecular patterns, we subjected mice deficient for numerous TLRs25 (TLR2, TLR3, TLR4, TLR7 and TLR9) to Epo-mediated pCaMIN and Cas9n–p19Arf sgRNA delivery. TLR deficiency did not prevent the induction of pMLKL 3 days after Epo treatment (Extended Data Fig. 7c). Similarly, TLR deficiency did not affect the numbers of liver-infiltrating immune cells (Extended Data Fig. 7d); however, TLR deficiency suppressed the induction of five of the six necroptosis-associated/MLKL-dependent (compare Extended Data Fig. 6k) cytokines or cytokine receptors (Extended Data Fig. 7e). Notably, TLR deficiency prevented ICC development but instead resulted in the outgrowth of HCC (Fig. 4k, Extended Data Fig. 7f). As the switch from ICC to HCC could also be observed in mice lacking only TLR2 and TLR4, our data suggest that these TLRs are the most crucial (Extended Data Fig. 7g)
We next electroporated pCaMIN together with Cas9n and sgRNA against p19Arf into severe combined immunodeficient (SCID)/beige mice (impaired adaptive and innate immunity) or syngeneic control mice. Whereas tumours arising in control mice represented K19-positive but HNF4α-negative ICC, immunocompromised SCID/beige mice developed HCC (Fig. 4l), suggesting that the crucial function of TLR signalling must be ascribed to TLR on immune cells.
Unique epigenetic signatures define HCC and ICC
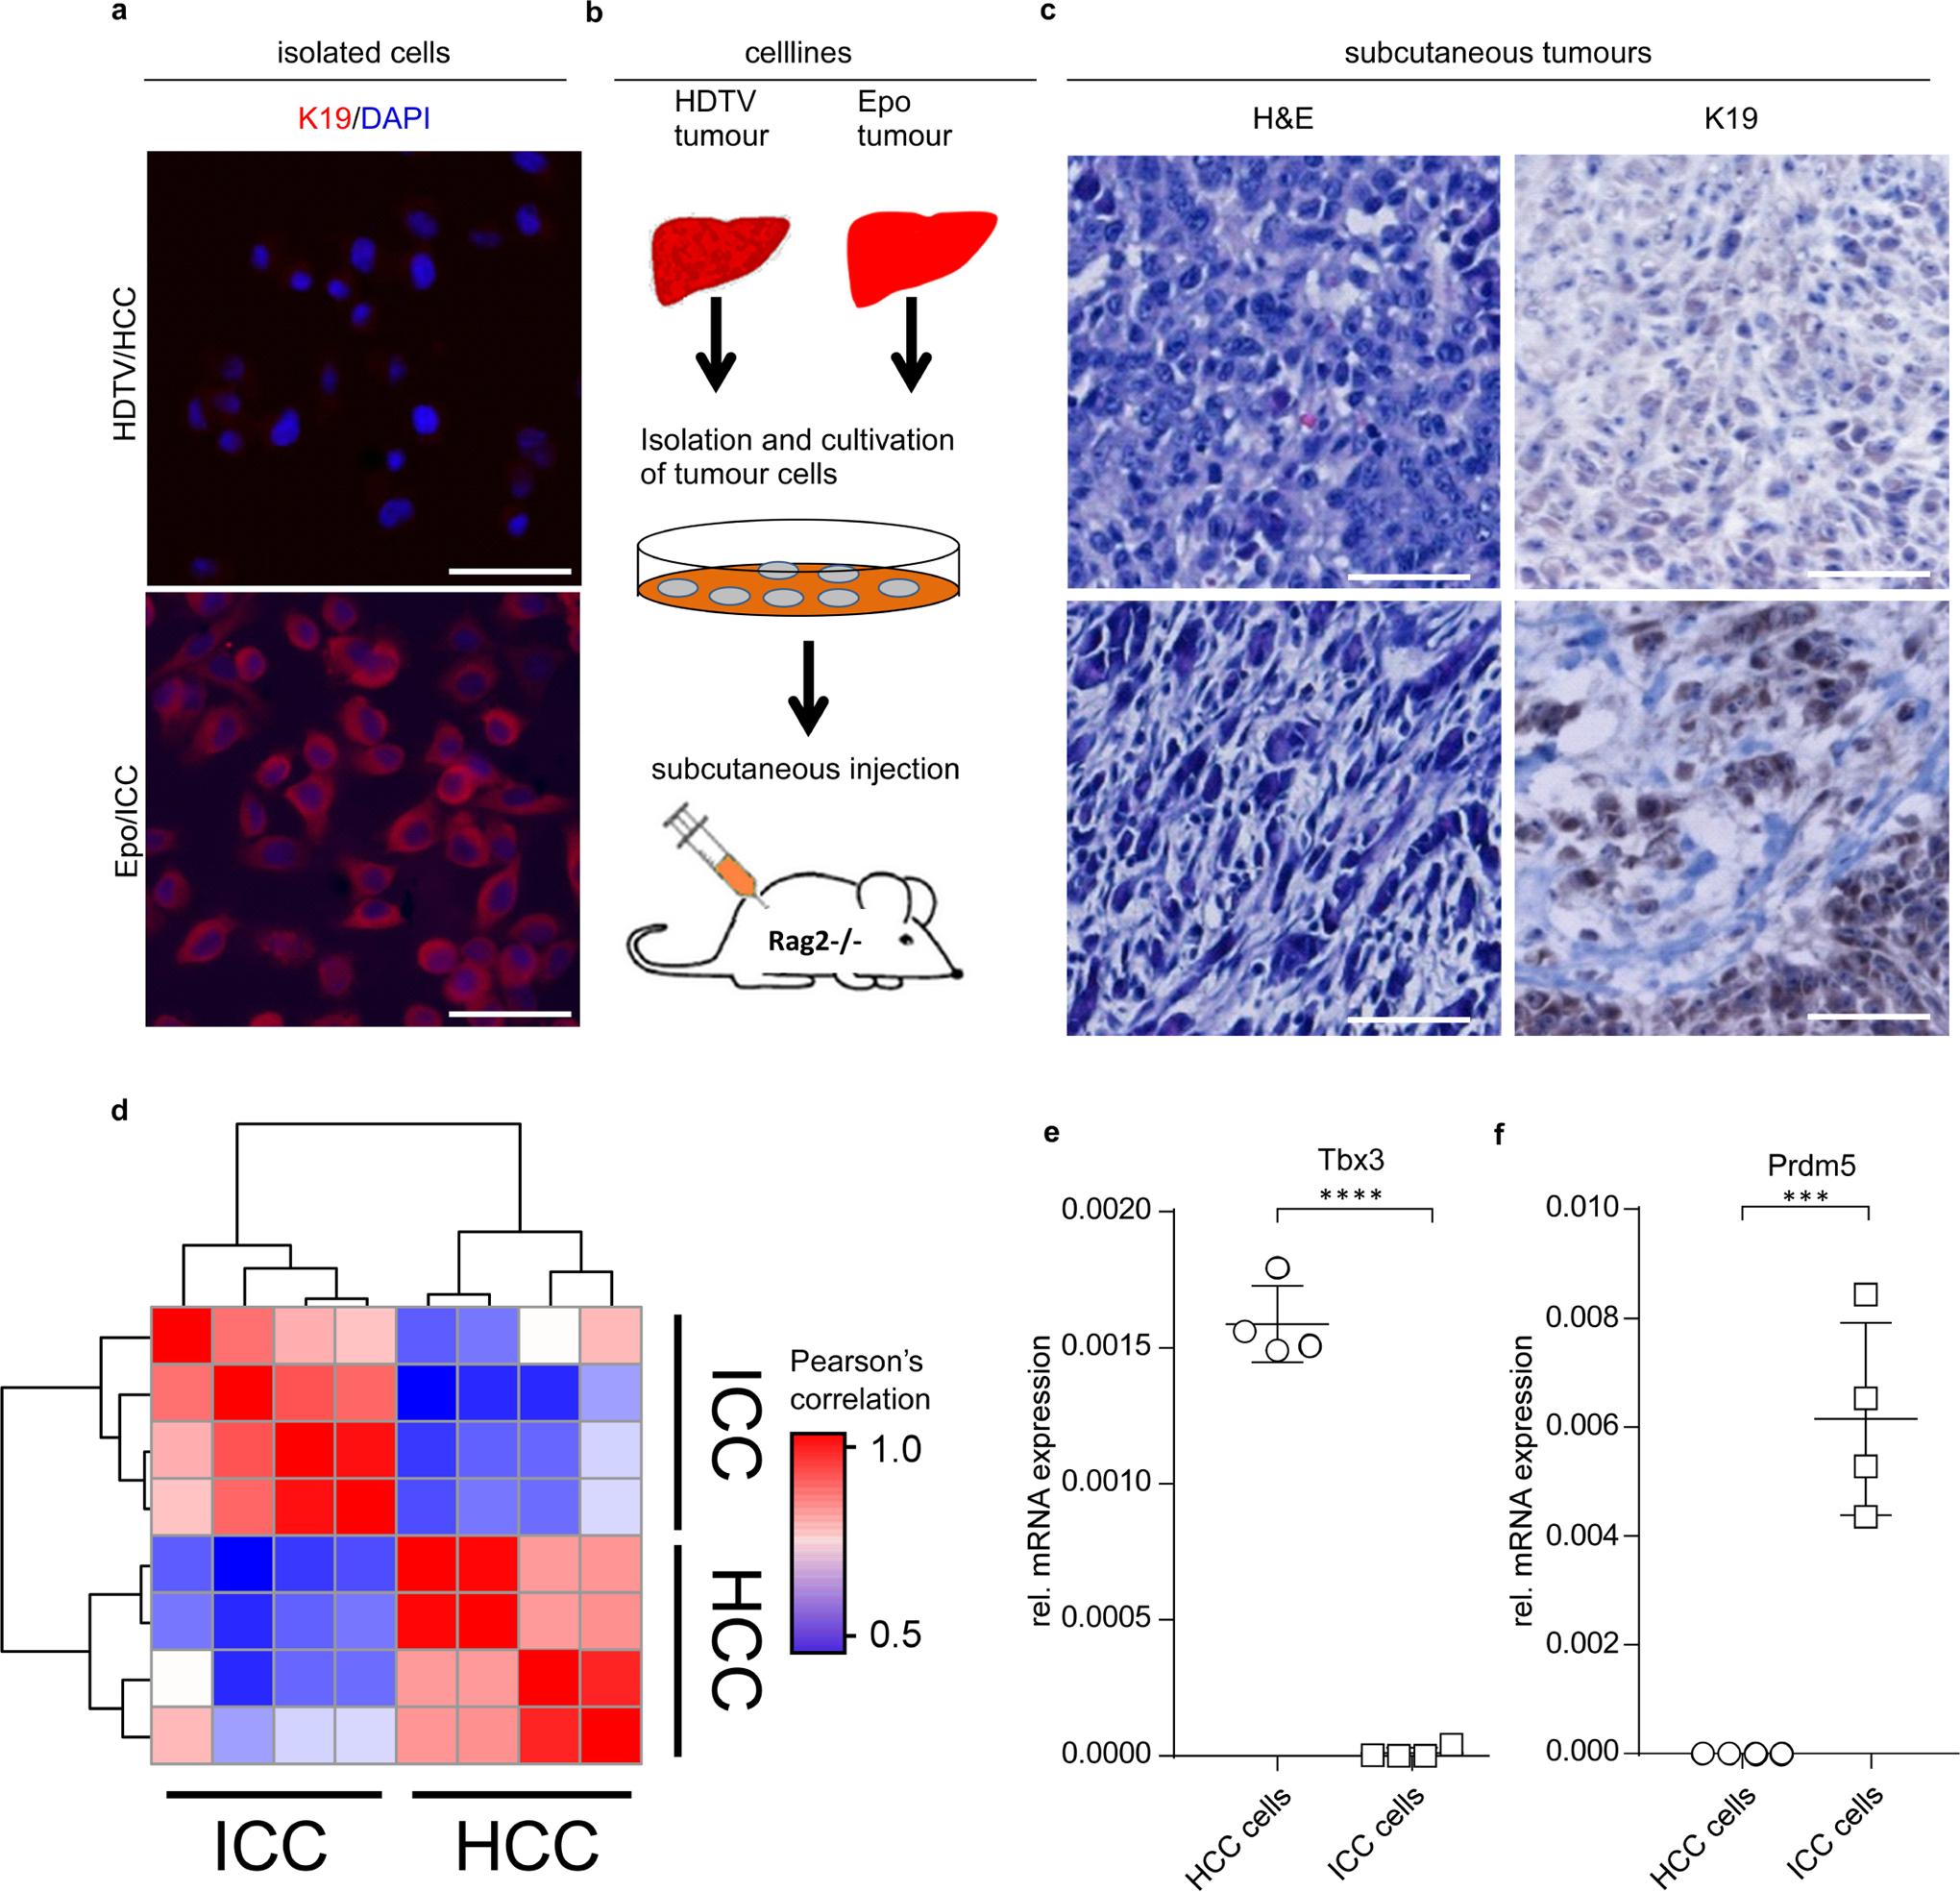
Because we were unable to identify spontaneously acquired mutations that could account for ICC versus HCC outgrowth, we reasoned that lineage commitment might be epigenetically regulated. We established clonal cell lines from pCaMIN Epo-derived ICC and pCaMIN HDTV-derived HCC (Extended Data Fig. 8a). Cultured ICC and HCC gave rise to ICC or HCC after subcutaneous injection of tumour cells in immunodeficient Rag2−/− mice, suggesting a stable maintenance of the tumour genotype during in vitro cultivation (Extended Data Fig. 8b, c).
We then profiled the chromatin accessibility landscape via assay for transposase-accessible chromatin using sequencing (ATAC-seq) in our cultured HCC and ICC cells. We generated fragment density heat maps ranked according to the signal fold change in ICC versus HCC to focus on differentially accessible chromatin regions (Fig. 5a). This allowed us to identify a total number of 108 chromatin regions that showed significant changes in chromatin accessibility, between HCC and ICC. k-means clustering analysis clearly separated ICC from HCC cell lines (Extended Data Fig. 8d). Next, we integrated our ATAC-seq data with transcriptome data that we generated from the same cell lines (Fig. 5b). These analyses pinpointed two genes, Tbx3 and Prdm5, both transcription factors with described roles in carcinogenesis26,27. Although a transcription start site (TSS)-proximal, intronic Tbx3 chromatin region was mostly accessible in mouse HCC, it was inaccessible in ICC (Fig. 5c). The observed reciprocal patterns positively correlated with increased Tbx3 mRNA expression in HCC when compared to ICC, a result we confirmed independently by quantitative PCR with reverse transcription (qRT–PCR) (Extended Data Fig. 8e).
Fig. 5 |. HCC and ICC derived from oncogenically transformed hepatocytes are defined by unique epigenetic signatures.
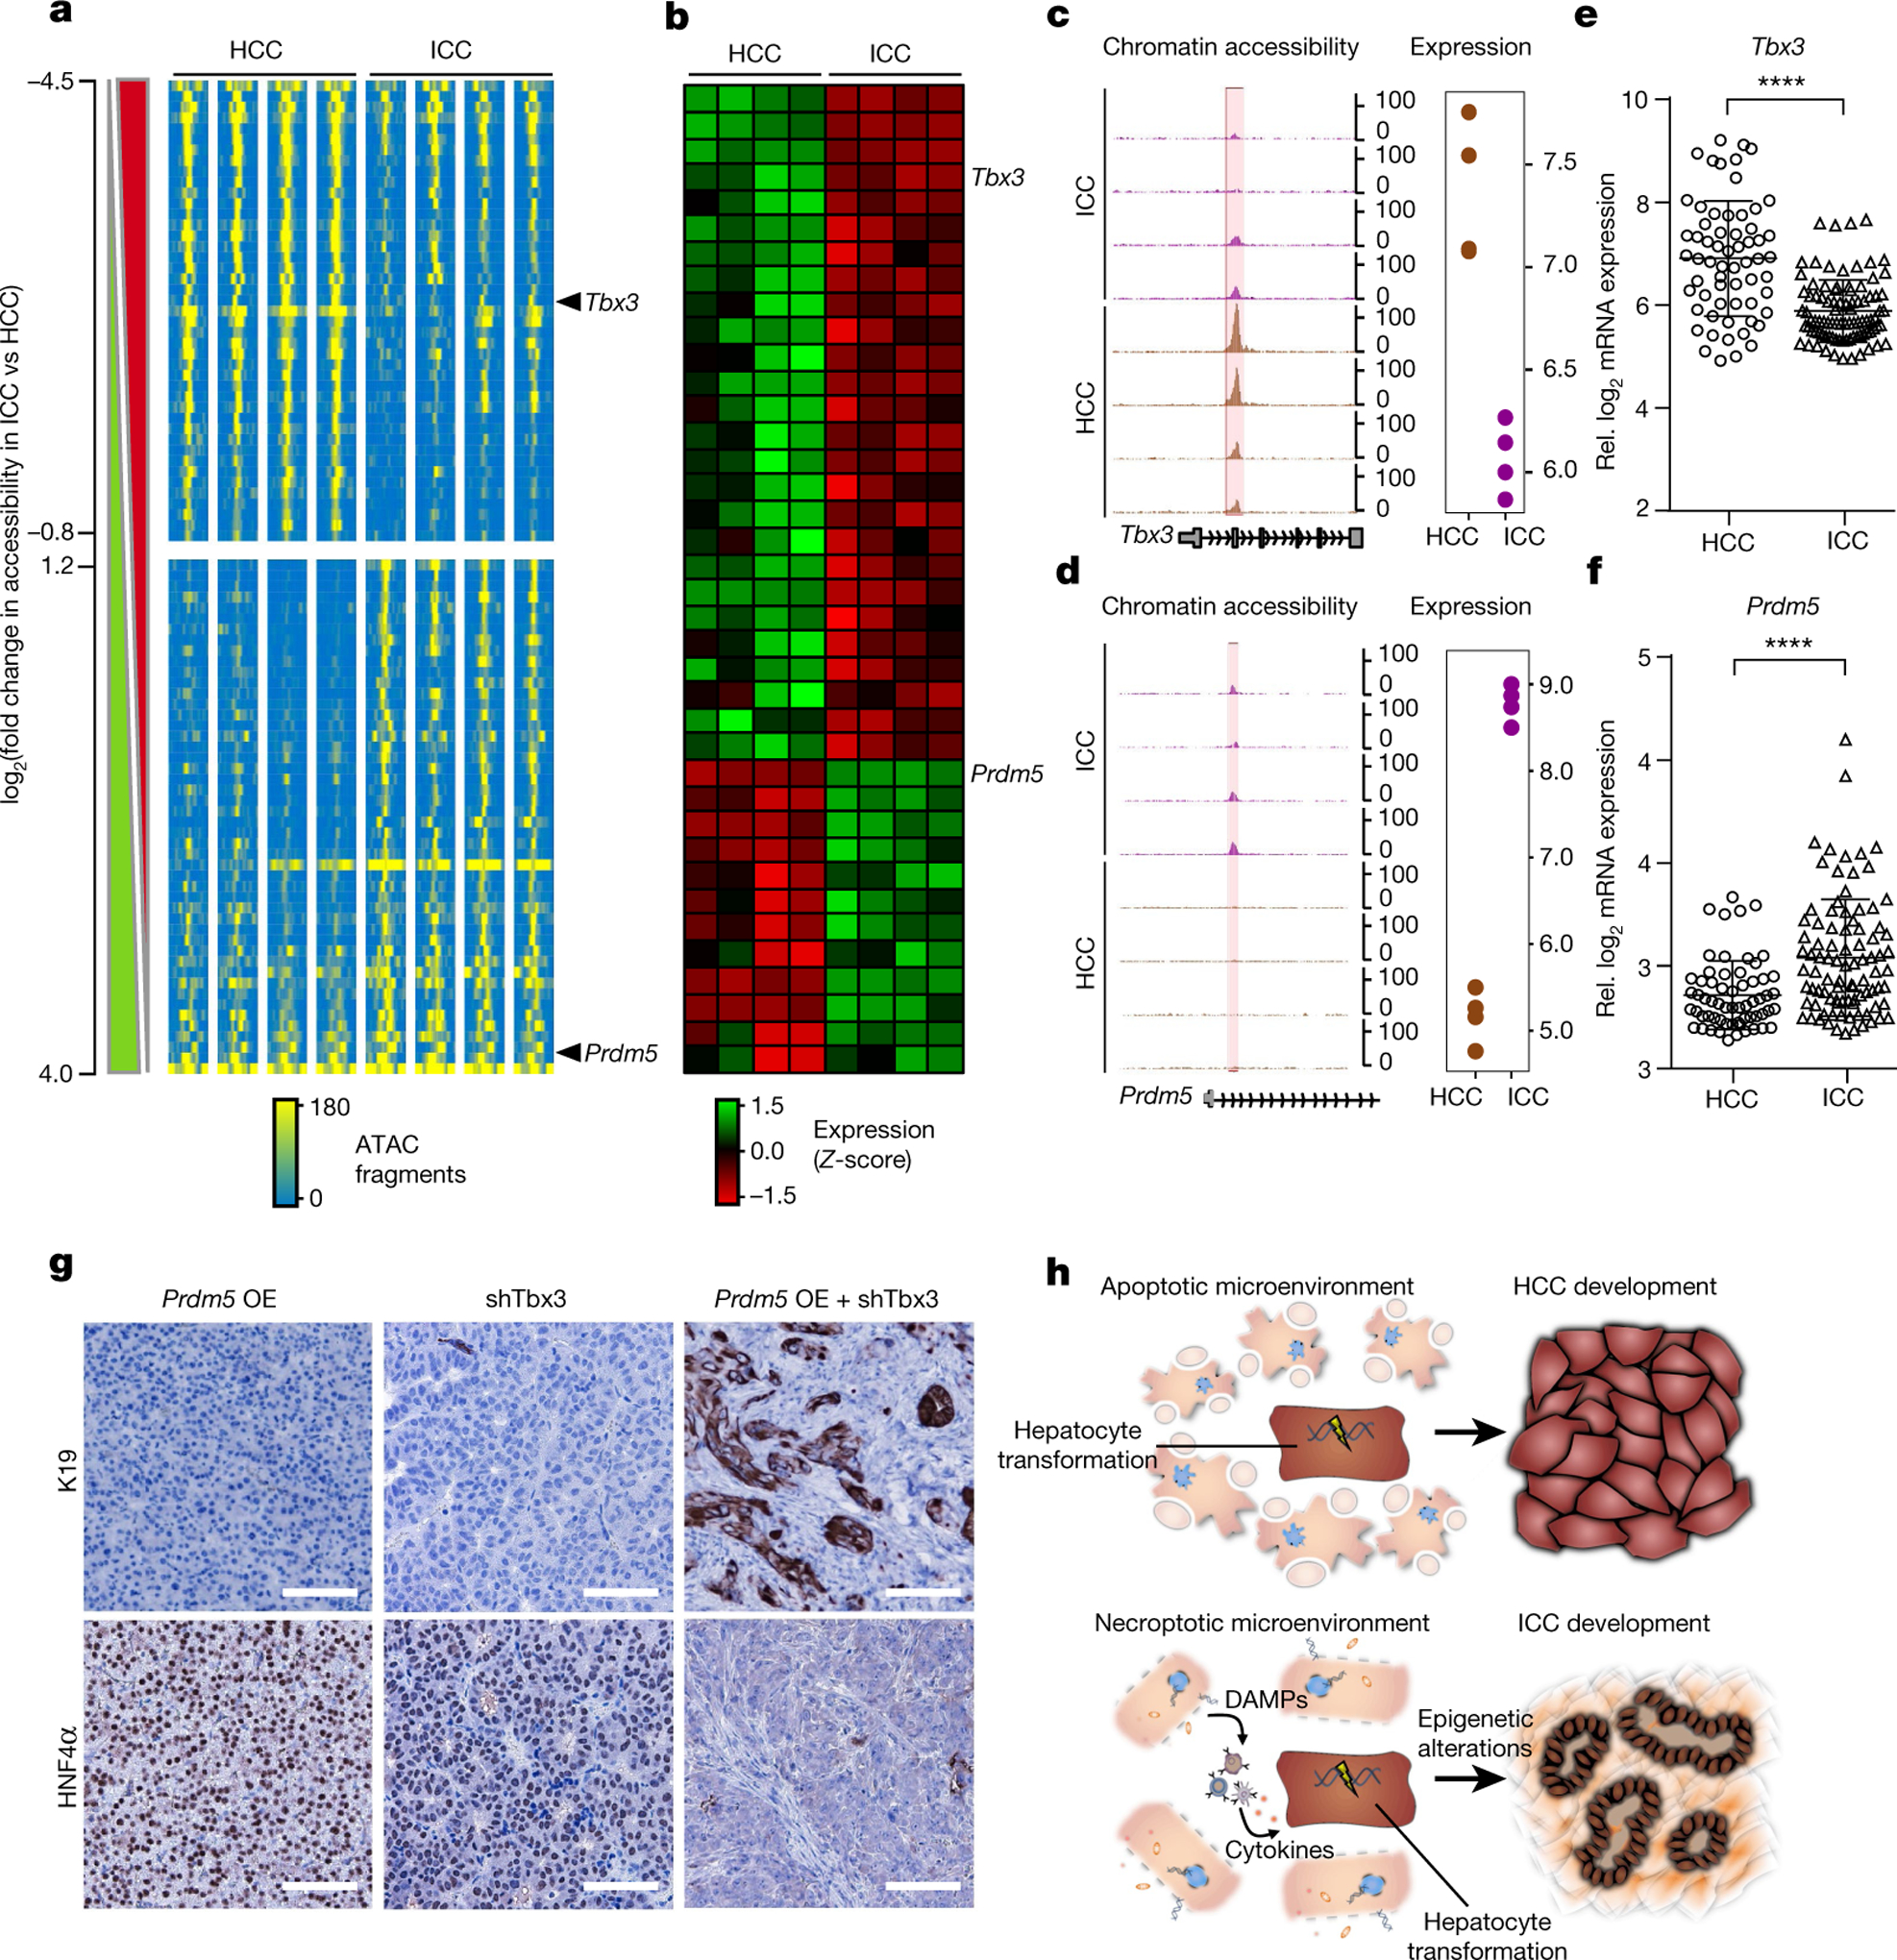
a, ATAC-seq density heat map of chromatin regions that are differentially accessible between HCC and ICC. Peaks are ranked according to the fold-change in signal in normalized ATAC fragment counts in ICC versus HCC. The data are expressed as smoothed normalized fragment pseudocounts in 25-base-pair (bp) windows ± 1 kb around the centre of peaks. The lateral bars on the left depict whether the ATAC signal is significantly increased (green) or decreased (red) in ICC compared to HCC as assessed with EdgeR. Tbx3- and Prdm5-associated regulatory elements are indicated. For each transcription factor (TBX3 or PRDM5), n = 4 cases, two-sided moderated t-statistics. b, Heat map of transcriptome data comparing HCC and ICC showing differentially expressed probes. Probes matching Tbx3 and Prdm5 are indicated by arrows. For each transcription factor (TBX3 or PRDM5), n = 4 cases, two-sided moderated t-statistics. c, d, Integrative analysis of chromatin accessibility (left) and transcriptome data (right) around Tbx3 (c) and Prdm5 (d) genes comparing HCC and ICC. Chromatin accessibility is expressed as smoothed, normalized fragment pseudo-counts in 100-bp windows. Absolute gene expression is represented in log scale. e, f, Gene expression in 199 human HCC and ICC of TBX3 (e) and PRDM5 (f). ****P < 0.0001, Student’s two-sided t-test. Data are mean ± s.d. g, Immunohistochemistry staining for K19 and HNF4α of HDTV-derived tumours after co- delivery of pCaMIN and a Prdm5-overexpression transposon (Prdm5 OE) (n = 4), pCaMIN plus Tbx3 shRNA (shTbx3) (n = 5), or pCaMIN plus shTbx3 and Prdm5 OE (n = 3) in p19Arf−/− mice. Scale bars, 100 μm. h, Schematic representation of the proposed model. DAMPs, damage-associated molecular patterns.
As for Prdm5, we found the opposite regulation of chromatin accessibility when compared to Tbx3 (Fig. 5d, Extended Data Fig. 8f). Notably, Tbx3 and Prdm5 gene expression levels in human HCC and ICC revealed the same patterns (Fig. 5e, f).
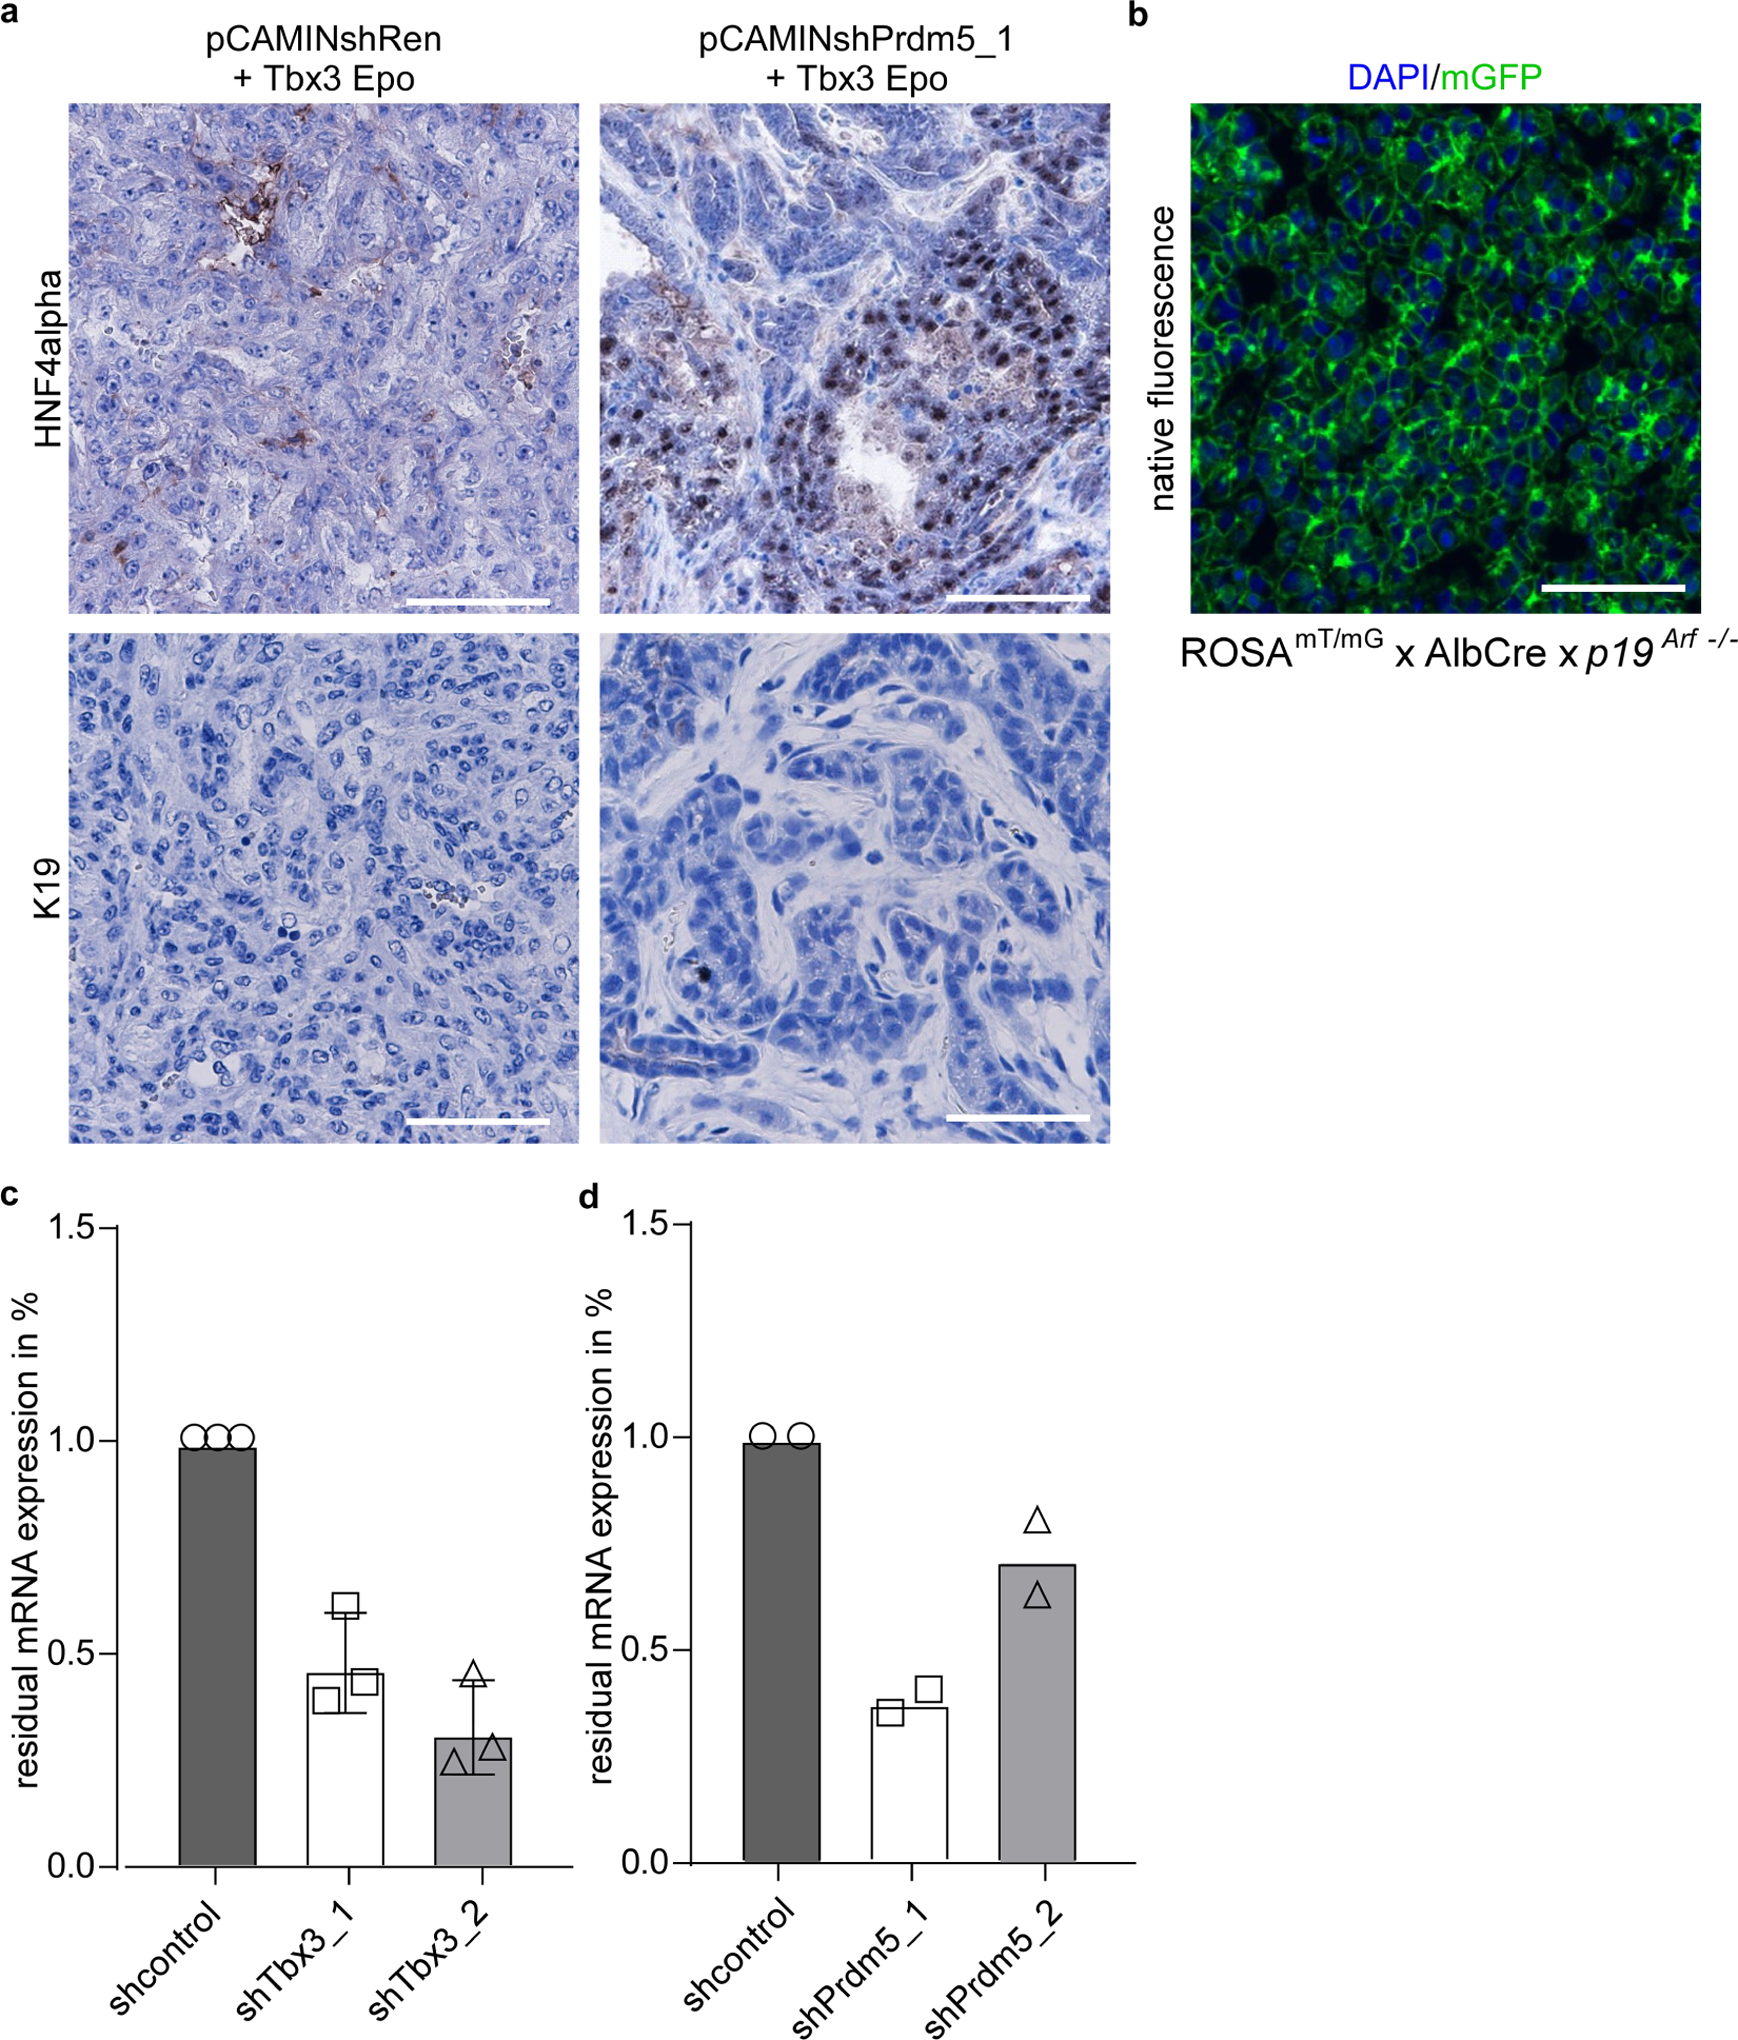
We hypothesized that lineage commitment in liver tumorigenesis is regulated by the expression of Tbx3 and Prdm5. To consolidate this, we conducted functional genetic experiments. First, CaMIN transposon vectors also encoding a control short hairpin RNA (shRNA) were stably co-delivered via Epo with a transposon vector encoding full-length Tbx3. Outgrowing tumours revealed a partial shift from ICC to HCC, as they grew in a solid growth pattern of undifferentiated cells without glandular structures and completely lost tumour stroma and K19 positivity, but lacked HNF4α expression (Extended Data Fig. 9a, left). Of note, these tumours are of hepatocytic origin as shown in our lineage-tracing model (Extended Data Fig. 9b). Notably, if in addition to Tbx3 overexpression, Prdm5 was suppressed by stable RNA interference (Extended Data Fig. 9c, shPrdm5_1), tumours gained differentiation and showed increased HNF4α expression (Extended Data Fig. 9a, right). To corroborate the role of Tbx3 and Prdm5 further, we conducted the reverse experiment. We performed HDTV with pCaMIN co-expressing a control shRNA (pCaMIN-shRen) or a Tbx3 shRNA (pCaMIN-shTbx3) together with a transposon overexpressing full-length Prdm5.
Although, Prdm5 overexpression or shRNA-mediated knockdown of Tbx3 alone were not able to induce a switch from HCC to ICC, simultaneous Prdm5 overexpression and Tbx3 knockdown resulted in the outgrowth of HNF4α-negative, K19-positive ICC (Fig. 5g). Together, these data strongly support the idea that TBX3 and PRDM5 act synergistically to determine lineage commitment in primary liver cancer.
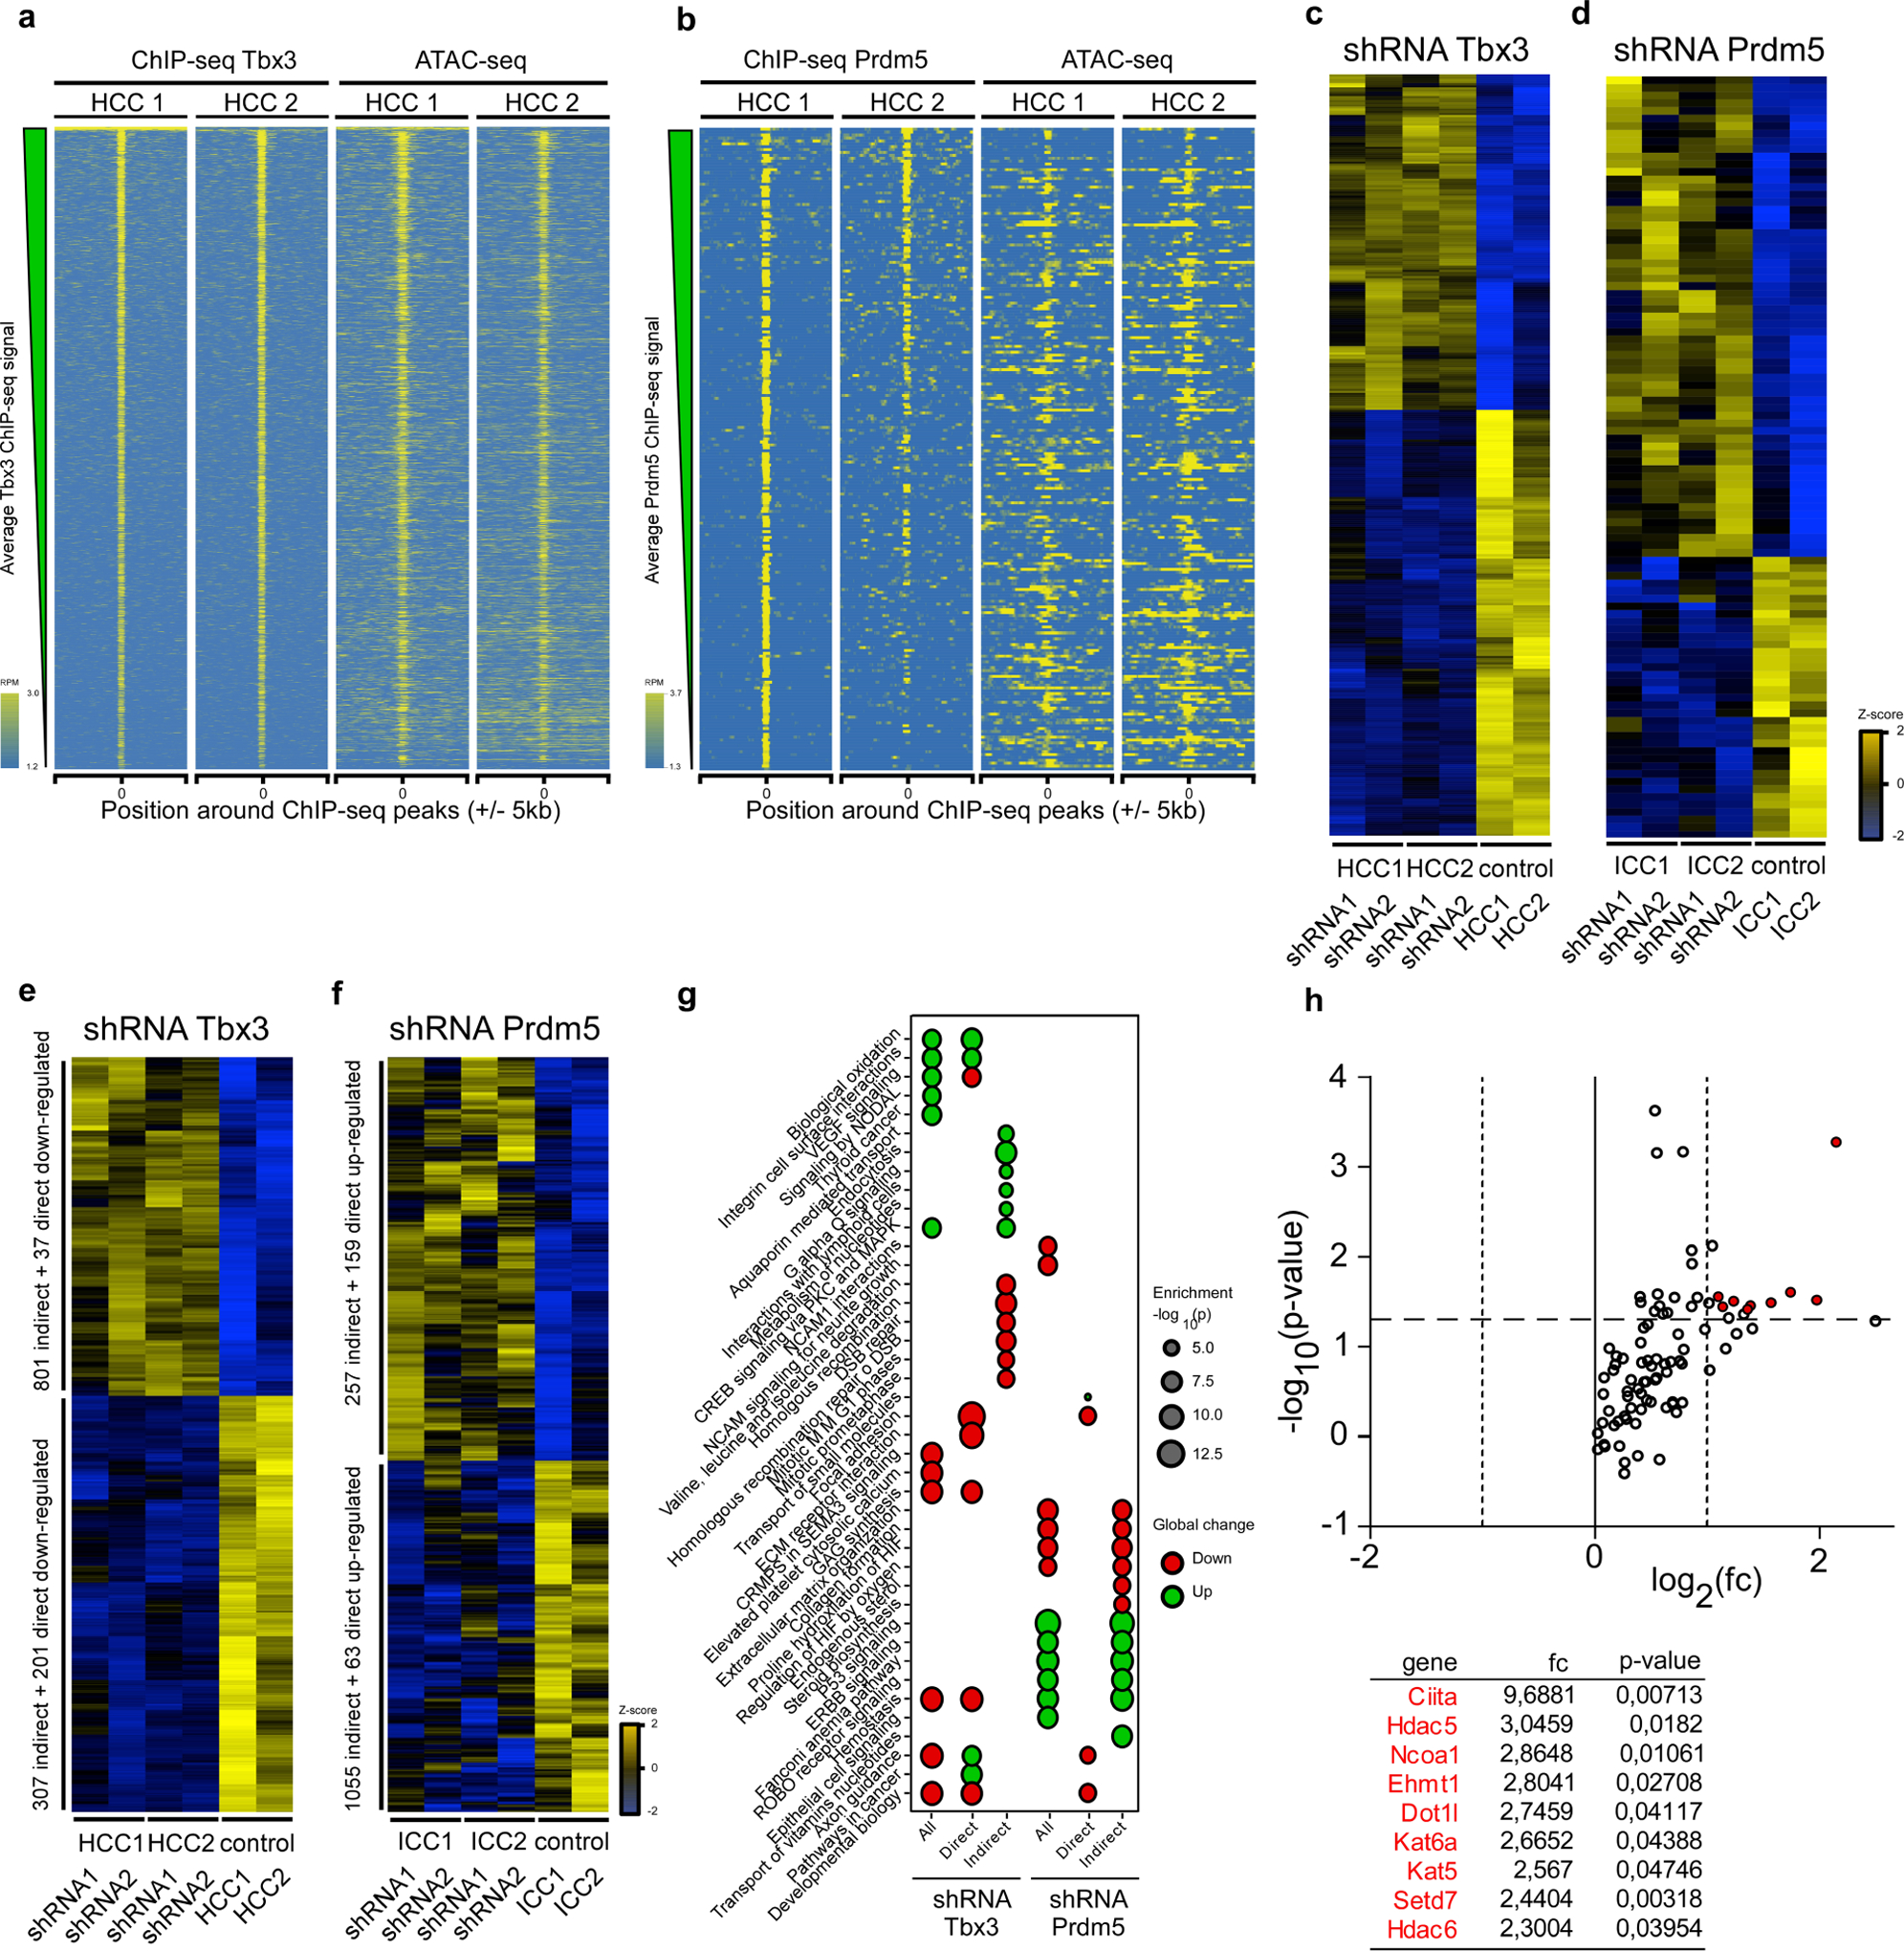
To gain further mechanistic insights, we performed Tbx3 and Prdm5 chromatin-immunoprecipitation followed by sequencing (ChIP–seq) analysis in our HCC and ICC cell lines. There was a high concordance between ATAC-seq and Tbx3 and Prdm5 ChIP–seq signals in HCC and ICC (Extended Data Fig. 10a, b). The integration of ChIP–seq datasets with gene expression profiles obtained from HCC with stable Tbx3 knockdown (Extended Data Figs. 9d, 10c) or ICC with stable Prdm5 knockdown (Extended Data Figs. 9c, 10d) identified both direct transcriptional targets, such as Tgfb2 or Thbs1 for Tbx3, and Col3a1 or Ephb2 for Prdm5, and indirect targets, thus allowing us to delineate comprehensive downstream regulatory networks (Extended Data Fig. 10e–g, Supplementary Table 1).
Finally, to determine how Tbx3 and Prdm5 might be regulated, we conducted gene expression analysis of chromatin remodelling enzymes after Epo or HDTV treatment. Notably, in the Epo-treated livers we found upregulation of several chromatin remodellers (such as Ciita, Hdac5 or Ncoa1) (Extended Data Fig. 10h), suggesting involvement in the epigenetic regulation of Tbx3 and Prdm5.
In conclusion, our study describes a mechanism of lineage determination in the development of primary liver cancer. Primary human liver carcinomas almost inevitably develop in chronically damaged livers in which different types of cell death such as necrosis, apoptosis or necroptosis occur. Our data suggest that hepatocytes with aberrantly activated oncogenes give rise to cholangiocarcinoma, when embedded in a necroptosis-dominated hepatic microenvironment. However, a hepatocyte that harbours the same oncogenic driver will give rise to HCC if it is not adjacent to necropotically dying hepatocytes (Fig. 5h).
The necroptosis microenvironment is characterized by specific cytokines and our functional experiments suggest that these cytokines are secreted from immune cells that are activated by damage-associated molecular patterns released from necroptotically dying hepatocytes. Future work is needed to determine which cytokines act on oncogenically transforming hepatocytes and which intracellular signalling cascades in hepatocytes mediate the epigenetic regulation of Tbx3 and Prdm5 expression in ICC and HCC.
METHODS
No statistical methods were used to predetermine sample size. The experiments were not randomized, and investigators were not blinded to allocation during experiments and outcome assessment.
Vector design.
Sleeping beauty transposase (SB13), NrasG12V and Myc transposon plasmids have been described recently18–20. The human myristoylated AKT1 cDNA was provided by S. W. Lowe. The Myc and AKT1 transposon plasmid (pCaMIA) was generated by PCR cloning of AKT1 cDNA, introducing NcoI and SalI restriction sites, and subcloning into an MSCV vector. Then IRES-AKT1 sequence was PCR amplified with primers introducing BspEI and AgeI and cloned into the pCaggs c-Myc transposon via AgeI. The NrasG12V cDNA was subcloned from pCaggs NrasG12V into an MSCV plasmid with BspHI and SalI restriction sites. IRES-NRASG12V was shuttled from MSCV into pCaggs c-Myc transposon plasmid via PCR cloning using primers with NotI and AgeI restriction sites to obtain pCaMIN. The full-length cDNA of Tbx3 or Prdm5 was purchased from Biocat (clone BC096551-TCM1004-GVO-TRI and BC138901-TCM1004-GVO-TRI) and shuttled via PCR cloning using primers with AscI/AgeI or AscI/NheI restrictions sites into an empty pCaggs transposon plasmid to obtain pCaggs-Tbx3 or pCaggs-Prdm5, respectively.
Animal strains.
Mice were maintained in a specific-pathogen-free environment according to the University Hospital of Tuebingen guidelines and fed with a standard diet. p19Arf−/− mice have been generated by C. Sherr. They were obtained in a C57BL/6 background from S. W. Lowe. Wild-type mice (C57BL/6, CB17 and C3H/HeN) and immunodeficient SCID/beige as well as Rag2−/− knockout mice were purchased from Charles River or the Jackson Laboratory. Alb-cre × Mlklfl/fl mice22,23 (C57BL/6 background) were provided by M. Vucur and T. Luedde. For establishment of the lineage-tracing mouse model, Alb-cre mice were purchased from The Jackson Laboratory and crossed with the ROSAmT/mG mouse strain that was generated by L. Luo and obtained from J. Zuber. Alb-cre × ROSAmT/mG mice14 were intercrossed with p19Arf−/− mice. Knockout mice lacking TLR2, TLR3, TLR4, TLR7 and TLR9 (C57BL/6 background)25 were provided by T. Buch. TLR2 and TLR4 knockout (C3H/HeN background) mice were obtained from A. Weber. Animal experiments were approved by the local authorities (Regierungspräsidium Tuebingen, Baden-Wuerttemberg, Germany). No tumours exceeded the approved tumour size of 0.5 cm.
Hydrodynamic tail vein injection and in vivo electroporation.
Vectors for HDTV injection and Epo were prepared using the QIAGEN EndoFree Maxi Kit (QIAGEN). For transposon-mediated gene transfer, animals received a 25 μg:5 μg ratio of transposon to transposase-encoding plasmid. For HDTV, DNA was suspended in 0.9% saline solution at a final volume of 10% of the animal’s body weight and injected via the tail vein within 5–10 s.
For the electroporation of the left lateral liver lobe, mice were anaesthetized using ketamine (100 mg kg−1 body weight) and xylazin (10 mg kg−1 body weight) via intraperitoneal injection. A small midline laparotomy was done and the liver was atraumatically luxated. The left liver lobe was injected with DNA solution in a total volume of 50 μl TE buffer with a 27G needle. Electroporation was performed with the Square Wave Electroporator (CUY21SC, Nepa Gene) using an electric pulse via a tweezer-type electrode (CUY650P5, 5 mm diameter). Electric pulses were applied twice with a duration of 75 ms, an interval of 500 ms and a voltage of 75 V.
Bile duct ligation.
For the ligation of the common bile duct, mice were anaesthetized using ketamine (100 mg kg−1 body weight) and xylazin (10 mg kg−1 body weight) via intraperitoneal injection. A small midline laparotomy was made and the liver lobes were atraumatically luxated and fixed with a fleece compress moistened with sterile PBS. The bile ducts were carefully separated from the portal vein and hepatic artery using a micro-serrations forceps. The common bile duct was ligated with two surgical knots.
Liver perfusion.
Mouse hepatocytes were isolated via liver perfusion through the vena cava with liver perfusion medium (Invitrogen) for 15 min and then with collagenase (Serva) and Ca2+-supplemented medium for the next 15 min.
In vivo treatments.
Mice were treated with Nec-1 (Cayman Chemical) at a dose of 10 μg per 100 μl in 0.9% NaCl three times per week intraperitoneally, starting 3 days before electroporation.
Subcutaneous tumour model.
Cells were cultured with 10% fetal calf serum (FCS) in DMEM medium at 37 °C and 7% CO2. For isolation and cultivation of primary tumour cells the tumour was dissected under sterile conditions and minced with a scalpel in DMEM, 1× HBS, dispase (1,000 U ml−1) and collagenase (0.1 U ml−1) (Roche). Cells were incubated at 37 °C for 30 min and filtrated through a 100 μm nylon mesh. Cells were washed twice with PBS and seeded on gelatine (1%)-coated plates. For immunofluorescence of K19 and HNF4α, cells were plated on chambers and incubated at 37 °C and 7% CO2 overnight. Cells were washed twice with PBS, fixed for 10 min with 4% paraformaldehyde (PFA) and subsequently stained using standard protocols with primary antibodies K19 (1:100, TROMAIII, DSHB) and the secondary antibodies (1:1,000, Invitrogen A11032) and mounted with H-1500 Vectashield Hardset with DAPI mounting medium. For subcutaneous injections, cultured tumour cells were washed twice with sterile PBS, trypsinized, resuspended in DMEM and filtrated through a 100 μm nylon mesh. Cells were counted and 2 × 10⁶ cells in 100 μl PBS were injected in the left or right rear flank of immunodeficient Rag2−/− mice.
Generation of stable knockdown cell lines.
Phoenix-AMPHO cells were transfected via standard calcium phosphate method with doxycycline-inducible retro-virus plasmids harbouring shRNA cassettes, puromycin selection cassettes and GFP marker gene. After 2 days, viral supernatant was collected and filtered with 0.45 μm sterile filters. Target cells were treated with polybrene (10 μg ml−1) and infected with 100 μl viral supernatant. Efficiently infected cells were selected with Puromycin (4–6 μg ml−1). Successful selection was checked after induction of the GFP and shRNA cassette with doxycycline (15 μg ml−1) with a fluorescence microscope (Olympus CKx41).
Western blot.
Whole-cell extracts were prepared using RIPA buffer and protein concentration was measured with the BioRad DC assay. 25 μg of protein were subjected to 15% SDS–PAGE and blotted on a PVDF membrane (Millipore) with a semi-dry blot or wet blot system. The following antibodies were used: cleaved caspase 3 (Cell Signal, 1:1,000), pMLKL (S345) (abcam, 1:1,000), vinculin (Thermo Fischer 1:10,000)), tubulin (Cell Signal, 1:10,000) and β-actin (Sigma, 1:10,000). Blots were visualized using Super Signal West Kit (Thermo Scientific) and the ChemiDocTM MP Imaging System. Freshly isolated hepatocytes were used to show absence of MLKL in Alb-cre × Mlklfl/fl mice. Primary hepatocytes were homogenized in NP-40 lysis buffer (50 mM Tris-HCL (pH 7.5), 150 mM NaCl, 0.5% NP-40 supplemented with PhosSTOP phosphatase inhibitor (Roche), cOmplete protease inhibitor (Roche), 1 mM Pefabloc (Roche) and 1 mM 1,4-dithiothreitol (DTT, Roth)) buffer to gain protein lysates. MLKL (Biorbyt orb32399, 1:2,000) antibody was used to detect MLKL in samples. If necessary, stripping has been performed with Restore Western Blot Stripping Buffer (Biorad).
RNA isolation and qRT–PCR.
Total RNA was isolated from liver tissue and freshly cultured cells using the TRIZOL RNA isolation protocol from Invitrogen and the RNeasy Kit (Qiagen). qPCR was performed with an ABI 7300 Real-Time PCR System (Applied Biosystems) in duplicates or triplicates. The TaqMan Reverse Transcription Reagents Kit (Invitrogen) was used for cDNA synthesis from total RNA. Supplementary Table 2 depicts primer sets for the detection of single genes. The qPCR analysis was carried out using the SYBR Green Master Mix from Applied Biosciences. Values were normalized towards Actb quantification. Cytokine profiling for pathway-focused gene expression analysis was performed using the mouse Inflammatory Cytokines and Receptors RT2 Profiler PCR Array from Qiagen. Gene expression analysis for epigenetic chromatin modification enzymes was performed with the mouse RT2 Profiler PCR Array Mouse Epigenetic Chromatin Modification Enzymes Array from Qiagen. RNA isolation and cDNA synthesis was performed as described above. The RT2 Profiler PCR Array was used according to the manufacturer’s protocol.
Flow cytometry analysis.
The liver was chopped into small ~1 mm3 pieces and then enzymatically digested in a medium composed of equal volume of DMEM and HBS supplemented with 0.5 mg ml−1 Collagenase (Serva Collagenase NB 4G) for 30 min at 37 °C. The enzymatic reaction was stopped using cold medium and the liver suspension was meshed through a 70 μm nylon mesh (Falcon). After centrifugation erythrocytes were lysed using an ACK buffer (150 mM NH4Cl, 10 mM KHCO3 and 0.1 mM EDTA). 1 million of cells were resuspended in blocking solution (2% BSA in PBS) and stained with antibodies (Supplementary Table 3) on ice for 30 min. Samples were immediately acquired using a FACSCanto flow cytometer (BD Biosciences) from the flow cytometry core facility Tuebingen. Doublets were excluded using height versus area dot plots and samples were additionally gated on viable leukocytes by DAPI exclusion in Extended Data Fig. 7b. Detailed gating strategies are provided in the flow cytometry Reporting Summary. Data analysis was performed using FlowJo software (Tree Star).
Histopathology, immunohistochemistry and immunofluorescence of paraffin samples.
Histopathological evaluation of mouse livers was performed by experienced board-certified pathologists (T.L. and B.S.) with H&E, HNF4α- and K19-stained paraffin-embedded liver tumour sections. For H&E, liver samples were fixed overnight in 4% PFA, paraffin-embedded, sectioned to 4-μm thickness, and subsequently used for haematoxylin and eosin following standard protocols. For RIPK3, pRIPK3, K19 and HNF4α staining of deparaffinized and hydrated sections, a heat-induced antigen retrieval method was performed for 10 min using sodium citrate buffer. Either liquid DAB plus substrate reagent (Zytomed) or the Metal Enhanced DAB Substrate Kit (Thermo Fischer) was used to perform direct chromogenic visualization. Primary antibodies used include K19 (1:100, TROMAIII, DSHB), pRIPKI3 (5 μg ml−1, Genentech), RIPK3 (0.5 μg μl−1, Genentech) and HNF4α (1:100, Santa Cruz, sc-6556). Secondary antibodies used were biotinylated anti-rat (1:100, Vector Laboratories), biotinylated anti polyvalent (Thermo Scientific), biotinylated anti-goat (1:100, Santa Cruz) or Alexa-Fluor 594 labelled anti-rat (1:1,000, Invitrogen). Counting of HNF4α-positive cells was performed via an ImageJ script.
Immunostaining analysis of Ly6G, MHCII, B220 and CD3 and αSMA was performed on a BOND-MAX immunohistochemistry robot (Leica Biosystems) using BOND polymer refine detection solution for DAB with the following antibodies: Ly6G (1:600, BD Pharmingen, 1A8), MHCII (1:500, Novus Biologicals, M5/114.15.2), B220 (1:3,000, BD Pharmingen, RA3–6B2), CD3 (1:250, Zytomed Systems, SP7) and αSMA (Sigma A2547 1:5,000) Image acquisition was performed with a Leica SCN400 slide scanner or Olympus BX63 microscope and a DP80 camera (Olympus). Quantification of immune cells was performed via calculating DAB positive pixels per area and counted via an ImageJ script.
Native fluorescence detection.
For the detection of native fluorescence, liver tissue was fixed for 4 h in 4% PFA at 4 °C. The fixative solution was replaced by 30% sucrose (Roth) in PBS for overnight incubation at 4 °C. Afterwards, the tissue was embedded in Tissue-Tec OCT compound (Sakura), frozen at −80 °C, cut in 6-μm thick tissue sections with an HM 560 cryostat and mounted with H-1500 Vectashield Hardset with DAPI mounting medium for native fluorescence expression analysis. Microscopic analysis was performed with the Olympus BX63 microscope and a DP80 camera (Olympus).
Cell death detection.
For TUNEL testing (TdT-mediated dUTP nick end labelling) In situ Cell Death Detection Kit Fluorescein from Roche Diagnostics was used according to the manufacturer’s instructions. For co-staining of TUNEL and native GFP in ROSAmT/mG × Alb-cre × p19Arf−/− mice, the In situ Cell Death Detection Kit TMR-Red was used. The protocol was modified to preserve GFP signal but destroy the tomato signal. The fixation step was reduced to 5 min, the permeabilization step was reduced to 2 min, and incubation duration was reduced to 15 min. Sections were analysed with an Olympus BX63 and DP80.
Laser capture microdissection.
Cryosections (6 μm) on MembraneSlide 1.0 PEN (Zeiss) were stained with the Arcturus HistoGene LCM Frozen Section Staining Kit (Thermo Scientific) according to the manufacturer’s protocol. Laser capture microdissection was performed with a Zeiss PALM MicroBeam and PALMRobo Software.
Isolation of genomic DNA.
Tumour tissues were mixed with 300 μl solution A (20 mM Tris-HCl, pH 8, 100 mM EDTA, 100 mM NaCl, 1% SDS and 0.5 mg ml−1 proteinase K) minced with a homogenizer and incubated at 56 °C overnight. Proteinase K was inactivated at 95 °C for 5 min, 50 μl 5 M NaCl was added and incubated again at 95 °C for 5 min. Samples were centrifuged and supernatant was mixed with two-third volumes of isopropanol. After another centrifugation, the DNA pellet was washed with 70% ethanol and the dried pellet was resuspended in water.
Mutagenesis.
For subcloning of Fam72a cDNA into the pCaggs transposon plasmid, cDNA (Fam72a MR201041, Mouse cDNA ORF Clone) was purchased from Biocat and subcloned using AscI/AgeI restricition sites into pCaggs to obtain pCaggs-Fam72a. Site-directed mutagenesis of Fam72a in transposon vector was performed using Q5 Site-Directed Mutagenesis Kit (NEB). Specific primers were designed to generate specific mutation at position 259 and obtain G>T mutation. The protocol was performed according to the manufactor’s manual.
Whole-exome sequencing.
Whole DNA purification out of laser capture microdissection samples was performed with the QIAamp MicroKit (Qiagen) according to manufacturer’s protocol. DNA concentration was measured with Qubit dsDNA HS Assay Kit (Thermo Scientific). After fragmentation with an ultrasonicator (Covaris), library preparation was performed via EndRepair and A-Tailing with KAPA Hyper Library Prep Kit (PeqLab), followed by Adaptor Ligation with Agilent SureSelect Oligo-Mix and purification with AMPureXP according to the protocol. PreCapPCR was performed according to the KAPA Hyper Library Prep Kit and purified with AMPureXP. Enrichment was done with the SureSelect Mouse AllExon XT Target Enrichment Kit (Agilent). Sequencing was done with a RapidRun on a HiSeq2500. Filtering of data was performed using SeqPurge, mapping was done with the BWA mem algorithm. Quality filtering was performed with MarkDuplicates from Picard tools. Alignment was done with BamLeftAlign and local realignment was performed as described elsewhere28. Variant calling was done with Freebays and SnpEff and SnpSift were used for annotation and filtering of variant data.
ATAC-seq library preparation.
ATAC was performed as described previously29. In brief, 50,000 cells were harvested and centrifuged (500g, 5 min, 4 °C). Cells were washed in cold PBS and centrifuged (500g, 5 min, 4 °C). Nuclei were isolated by resuspension of the cell pellet in lysis buffer (10 mM Tris-HCl, pH 7.4, 10 mM NaCl, 3 mM MgCl2, 0.1% IGEPAL CA-630) and centrifugation (500g, 5 min, 4 °C). Nuclei were subjected to tagmentation in 50 μl reactions containing 1× TD buffer and 2.5 μl T5 transposase followed by incubation at 37 °C for 30 min. Tagmented DNA was recovered using a QIAGEN MinElute kit and eluted in 10 μl elution buffer (10 mM Tris-HCl, pH 8.0). Libraries were amplified for 14 cycles, purified using a QIAGEN PCR Cleanup kit and eluted in 20 μl elution buffer. Size distribution of libraries was determined on a Bioanalyzer 2100 instrument.
Microarray gene expression profiling.
Total RNA was preprocessed for hybridization to Mouse Gene 2.0 ST Array (Affymetrix) using the GeneChip WT PLUS Reagent Kit (Affymetrix) following the manufacturer’s protocol. In brief, 100 ng of total RNA was used to generate first strand cDNA using reverse transcriptase and primers containing a T7 promoter sequence. Single-stranded cDNA was then converted to double-stranded cDNA by using DNA polymerase and RNase H to simultaneously degrade the RNA and synthesize second-stranded cDNA. Complimentary RNA (cRNA) was synthesized and amplified by in vitro transcription (IVT) of the second-stranded cDNA template using T7 RNA polymerase. Subsequently, single-stranded cDNA was synthesized by the reverse transcription of cRNA with incorporated deoxyuridine triphosphate (dUTP). Purified, single-strand cDNA was fragmented by uracil-DNA glycosylase (UDG) and apurinic/apyrimidinic endonuclease 1 (APE 1) at the unnatural dUTP residues and labelled by terminal deoxynucleotidyl transferase (TdT) using the Affymetrix proprietary DNA Labelling Reagent that is covalently linked to biotin. Subsequent hybridization, wash, and staining were carried out using the Affymetrix GeneChip Hybridization, Wash, and Stain Kit following the the manufacturer’s protocols. In brief, each fragmented and labelled single-strand cDNA target sample (approximately 3.5 μg) was individually hybridized to a GeneChip Mouse Gene 2.0 ST Array at 45 °C for 16 h in Affymetrix GeneChip Hybridization Oven 640. After hybridization, the array chips were stained and washed using an Affymetrix Fluidics Station 450. The chips were then scanned on Affymetrix GeneChip Scanner 3000 7G.
ATAC-seq data processing.
Paired-ends reads were cropped to 100 bp with trimmomatic v0.3630 and cleaned using cutadapt v1.8.3 to remove Nextera adapters, low quality bases and reads, and discard reads shorter than 25 bp after trimming. Fragments were then aligned to the mouse reference genome (mm10) with bowtie2 v2.2.331 discarding inconsistent pairs and considering a maximum insert size of 2kb (bowtie2 -N 0–no-mixed–no-discordant–minins 30–maxins 2000). Alignment files were further processed with samtools v1.2 and PicardTools v1.130 to flag PCR and optical duplicates and remove alignments located in Encode blacklisted regions. Accessible regions were identified using MACS2 v2.1.0 in paired-end mode without control using default parameters. After assessing library saturation using preseqR, alignment and peak data were imported and pre-processed in R using the DiffBind32 package. We first defined the global peak set as the union of all eight peak sets defined previously. We then counted the number of reads mapping inside each of these intervals for each sample. The raw count matrix was then normalized for sequencing depth using a nonlinear full quantile normalization as implemented in the EDASeq33 package. To remove sources of unwanted variation and consider batch effects, data were finally corrected with the RUVSeq34 package considering one surrogate variable. Differential analyses for count data was performed using edgeR35 considering the tumour type and surrogate variable in the design matrix, by fitting a negative binomial generalized log-linear model to the read counts for each peak. Peaks were finally annotated using ChIPpeakAnno considering annotations provided by Ensembl v86. Reads assigned per million map reads (RPM) normalized visualization tracks were generated using deepTools36.
ChIP–seq library preparation.
HCC (H1 and H4), and ICC (E9 and E10) cell lines were grown in DMEM high glucose glutamax (GIBCO) media in 600 cm2 tissue culture dishes to 80% confluence. Approximately 50 million cells were collected in 10 million cell aliquots in 15 ml media. Each aliquot was cross-linked in 1% paraformaldehyde for 10 min at room temperature. Cross-linking was quenched with the addition of 1 m of 2 M glycine, and incubated at room temperature for 5 min. Chromatin was isolated and digested with 1.2 μl of micrococcal nuclease using the Cell Signalling SimpleChIP kit (9002). Approximately 40 million cell equivalents of pre-cleared chromatin were used to perform immunoprecipitation following the cell signalling protocol. Immunoprecipitations for TBX3 with HCC H1 and H4 chromatin were performed with an anti-TBX3 antibody (Santa Cruz, sc-17871, 5 μg), and the immunoprecipitations for PRDM5 with ICC E9 and E10 chromatin were performed with anti-PRDM5 antibody (Millipore, MABE972, 5 μg). Inputs were derived from 500,000 cell equivalents of chromatin.
ChIP–seq libraries were produced using a modified protocol from the Accel-NGS 2S Plus DNA Library Kit (21024), in which we performed DNA extraction using 25:24:1 phenol:chloroform:isoamyl alcohol followed by overnight ethanol precipitation of DNA at each step of the protocol. In addition, we followed an enrichment protocol for small DNA fragments outlined in the X-ChIP protocol37. ChIP–seq libraries underwent quality control using the Agilent Technologies 4200 Tapestation (G2991–90001) and quantified using the Invitrogen Qbit DS DNA HS Assay kit (Q32854). Libraries were sequenced in single-end 65-bp on an Illumina HiSeq 2500, generating 262 million reads (33 million on average per sample).
ChIP–seq data processing.
Single-ends 65-bp reads were cleaned using fastq-mcf v1.04.803 from the ea-utils suite38 to remove Illumina adapters, low quality bases and reads, and discard reads shorter than 25 bp after trimming. Fragments were then aligned to the mouse reference genome (mm10) with bowtie v1.1.139 using best matches parameters (bowtie -v 2 -m 1–best–strata). Alignment files were further processed with samtools v1.240 and PicardTools v1.130 to flag PCR and optical duplicates and remove alignments located in Encode blacklisted regions. For the follow-up analyses, we ended up with 214 million ready-to-analyse alignments (27 million on average per sample). Fragment size was estimated in silico for each library using spp. v1.10.1. Genome-wide consistency between replicates was checked using custom R scripts. Enriched regions were identified for each replicate independently with MACS v2.1.041 with non-immunoprecipitated genomic DNA as a control (macs2 callpeak–nomodel–shiftsize–shift-control–gsize mm -p 1e-1). These relaxed peak lists were then processed through the irreproducible discovery rate pipeline42 to generate an optimal and reproducible set of peaks for each transcription factor. Peaks were finally annotated using ChIPpeakAnno considering annotations provided by Ensembl v.86.
Normalized ATAC-seq and ChIP–seq signal tracks.
The genome was binned in 200-bp non-overlapping windows and we generated genome-wide read count matrices for each assay or sample independently. Counts were finally transformed to reads per million mapped reads (RPM) and data were quantile normalized with custom R script to generate scaled and normalized signal tracks. These data were further used to build genome browser views and density heat maps.
Mouse microarray analyses.
Raw Affymetrix Mouse Gene 2.0 ST array intensity data were analysed using open-source Bioconductor packages on R. The data were normalized all together (4 HCC and 4 ICC) using the robust multi-array average normalization approach implemented in the oligo package43. Internal control probe sets were removed and average expression deciles over conditions were then defined. Probes in which the average expression was lower than the fourth expression decile were removed for subsequent analyses. To remove sources of unwanted variation and consider batch effects, data were finally corrected with the sva package. To get as much information as possible, we combined Affymetrix Mouse Gene 2.0 ST annotations provided by Affymetrix and Ensembl through the packages pd.mogene.2.0.st and biomaRt44. Principal component analysis and bi-clustering based on Pearson’s correlation and Ward’s aggregation criterion were used to check for consistency between biological replicates and experimental conditions at each step of the pre-processing. Normalized log-scaled and filtered expression data were further considered for differential analysis with limma45. In brief, a nested general linear model considering tumour type (HCC or ICC), gender (male or female) and their interaction was fitted to the data. Moderated F-statistics that combine the empirical Bayes moderated t-statistics for all contrasts into an overall test of significance for each probe were used to assess the significance of the observed expression changes when comparing HCC and ICC. P values were corrected for multiple testing using the false discovery rate (FDR) approach for a significance level of 0.1. A cut-off in fold-change at 1.5 was finally applied.
Mouse microarray analyses, shRNA experiments.
Raw Affymetrix Mouse Gene 2.0 ST array intensity data were preprocessed altogether for the two shRNA experiments (2 shRNAs against Prdm5 in ICC, 2 shRNAs against Tbx3 in HCC, each with biological duplicates, and two biological duplicates for the shRNA control in each cell type, that is, 12 arrays), following the same procedure as described above. After differential analysis with limma to test for the effect of the two shRNAs independently, we split deregulated genes as either direct or indirect Prdm5 or Tbx3 targets according to the presence or absence of proximal ChIP–seq peaks (<100 kb from the TSS or inside the gene body of deregulated genes). We finally performed gene set over-representation analyses on global, direct and indirect up- and downregulated genes after Tbx3 or Prdm5 knockout, considering the MSigDB canonical gene sets using a right-tail modified Fisher’s exact test and the hypergeometric distribution to provide P value.
Microarray analysis of human cohorts.
The microarray data from the 199 Thailand Initiative in Genomics and Expression Research for Liver Cancer (TIGER-LC) cohort of HCC and ICC can be found on Gene Expression Omnibus (GEO) accession GSE76297 (http://www.ncbi.nlm.nih.gov/geo). In brief, log2 gene expression values of specified genes from tumour samples only were extracted for comparative analyses between HCC and ICC. Non-parametric statistical analyses using Mann–Whitney test were performed to test for differences amongst two groups using GraphPad Prism (v.7.01).
Statistics.
GraphPad Prism (Version 6) was used for statistical analyses. Unpaired Student’s t-test was used to calculate P values, unless stated otherwise in the figure legends.
Reporting summary.
Further information on research design is available in the Nature Research Reporting Summary linked to this paper.
Data availability.
The data and code that support the findings of this study are available from the corresponding author on reasonable request. Source data for graphs showed in Figs. 4, 5 and Extended Data Figs. 1, 4–10 are available in the online version of this paper. Data from ChIP–seq experiments are available at the Sequence Read Archive (SRA) under the accession number SRP136997. Whole scans of western blots are depicted in Supplementary Fig. 1, and the gating strategy for flow cytometry is depicted in Supplementary Fig. 2.
Extended Data
Extended Data Fig. 1 |. Tumour phenotype depends on the delivery method of oncogene encoding transposons.
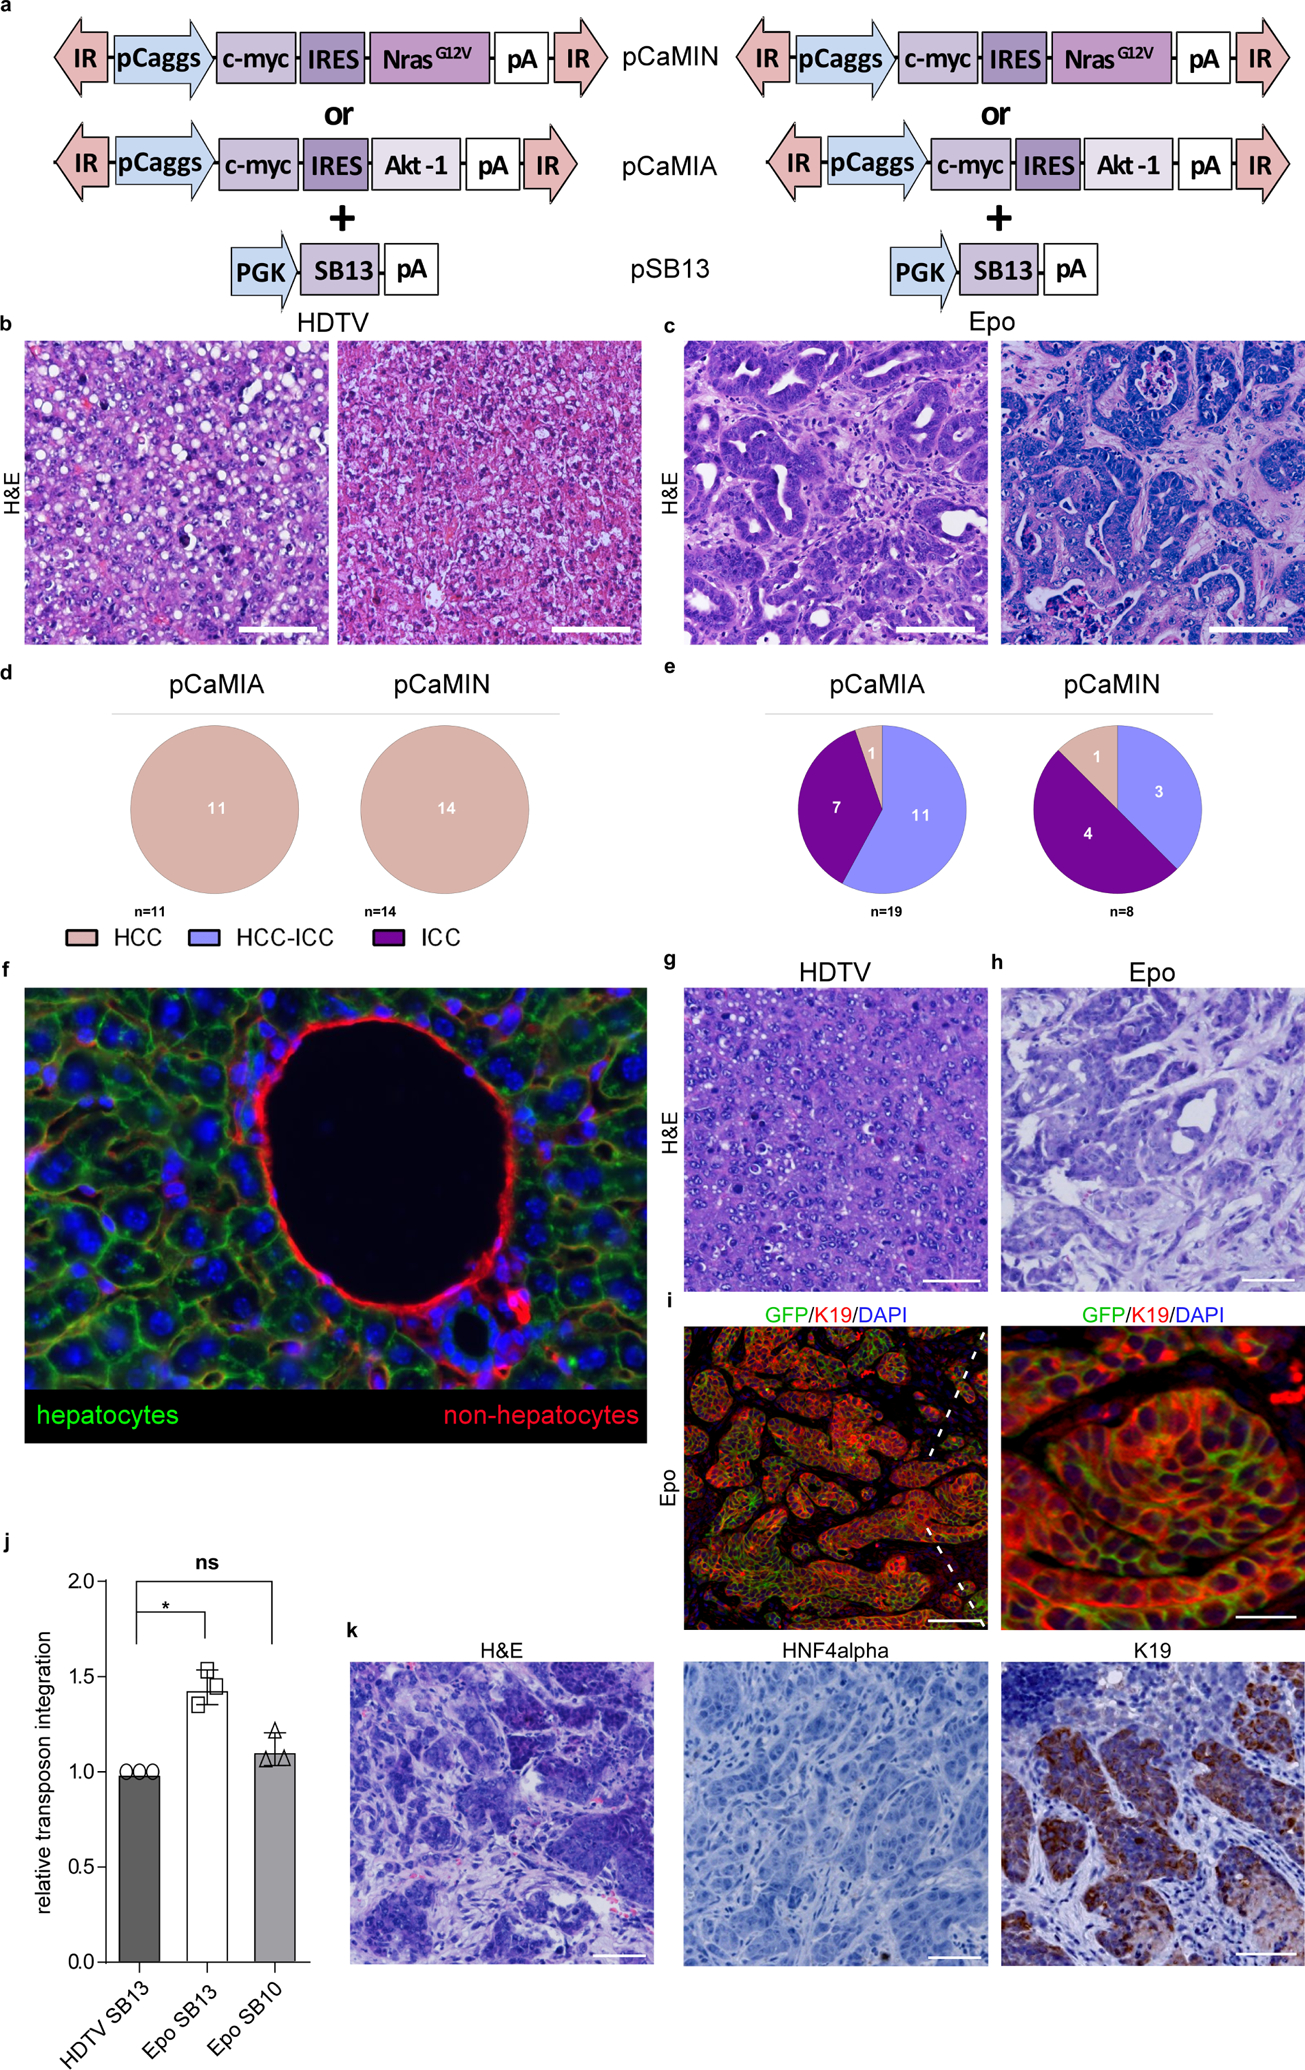
a, Schematic representation of transposon vectors encoding Myc and NrasG12V (pCaMIN) or Myc and AKT1 (pCaMIA) and a plasmid encoding the SB13 transposase. b, c, Representative micrographs of H&E staining of HDTV- or Epo-derived tumours. Scale bars, 100 μm. d, Histopathological scoring and quantification of tumours developed after hydrodynamic delivery of oncogene encoding transposons. e, Histopathological scoring and quantification of tumours developed after transposon delivery via in vivo electroporation. f, Representative image of native fluorescence microscopy of liver cryosections from ROSAmT/mG × Alb-cre × p19Arf−/− mice. In such mice, activation of the albumin promoter induces excision of a red fluorescence marker gene (mTomato) together with a stop codon flanked by loxP sites, thus resulting in a colour switch from red to green fluorescence (membrane-bound GFP). In this model, only fully differentiated hepatocytes (with high albumin promoter activity and therefore high levels of Cre expression) were able to induce the switch from red to green fluorescence, whereas liver cells with low albumin promoter activity such as embryonic hepatocytes or oval cells or liver progenitor cells were unable to accomplish such a colour change. Shown is mGFP expression in hepatocytes (green) and mTomato expression in bile duct cells or endothelial cells (red) (n = 3). Scale bar, 100 μm. g, h, Representative H&E staining images of tumours 4 weeks after HDTV (g) or Epo (h) transfection of the pCaMIN vector in ROSAmT/mG × Alb-cre × p19Arf−/− mice (n = 4). Scale bars, 100 μm. i, Representative images of DAPI-positive (blue), K19-positive (red) and native GFP-positive (green) hepatocytes in ICC derived from pCaMIN electroporated ROSAmT/mG × Alb-cre × p19Arf−/− mice (n = 6, left). Scale bars, 100 μm (left) and 20 μm (right). Data are from one experiment. j, qPCR analysis with transposon-specific primers on DNA isolated from HDTV- or Epo-induced tumours using (SB13) showed an approximately 1.5-fold increased transposon integration compared to tumours triggered by hydrodynamic delivery (HDTV). Epo-induced tumours using the SB10 transposase show equal transposon integration levels compared to HDTV-derived tumours with SB13 (n = 3). NS, not significant (P = 0.074); *P = 0.0011, Student’s two-sided t-test. Data are mean ± s.d. k, Representative images of H&E, K19 or HNF4α staining of Epo-induced tumours transfected using pCaMIN and SB10 (n = 3). Scale bars, 100 μm.
Extended Data Fig. 2 |. Exome sequencing reveals recurrent mutations in HCC and ICC.
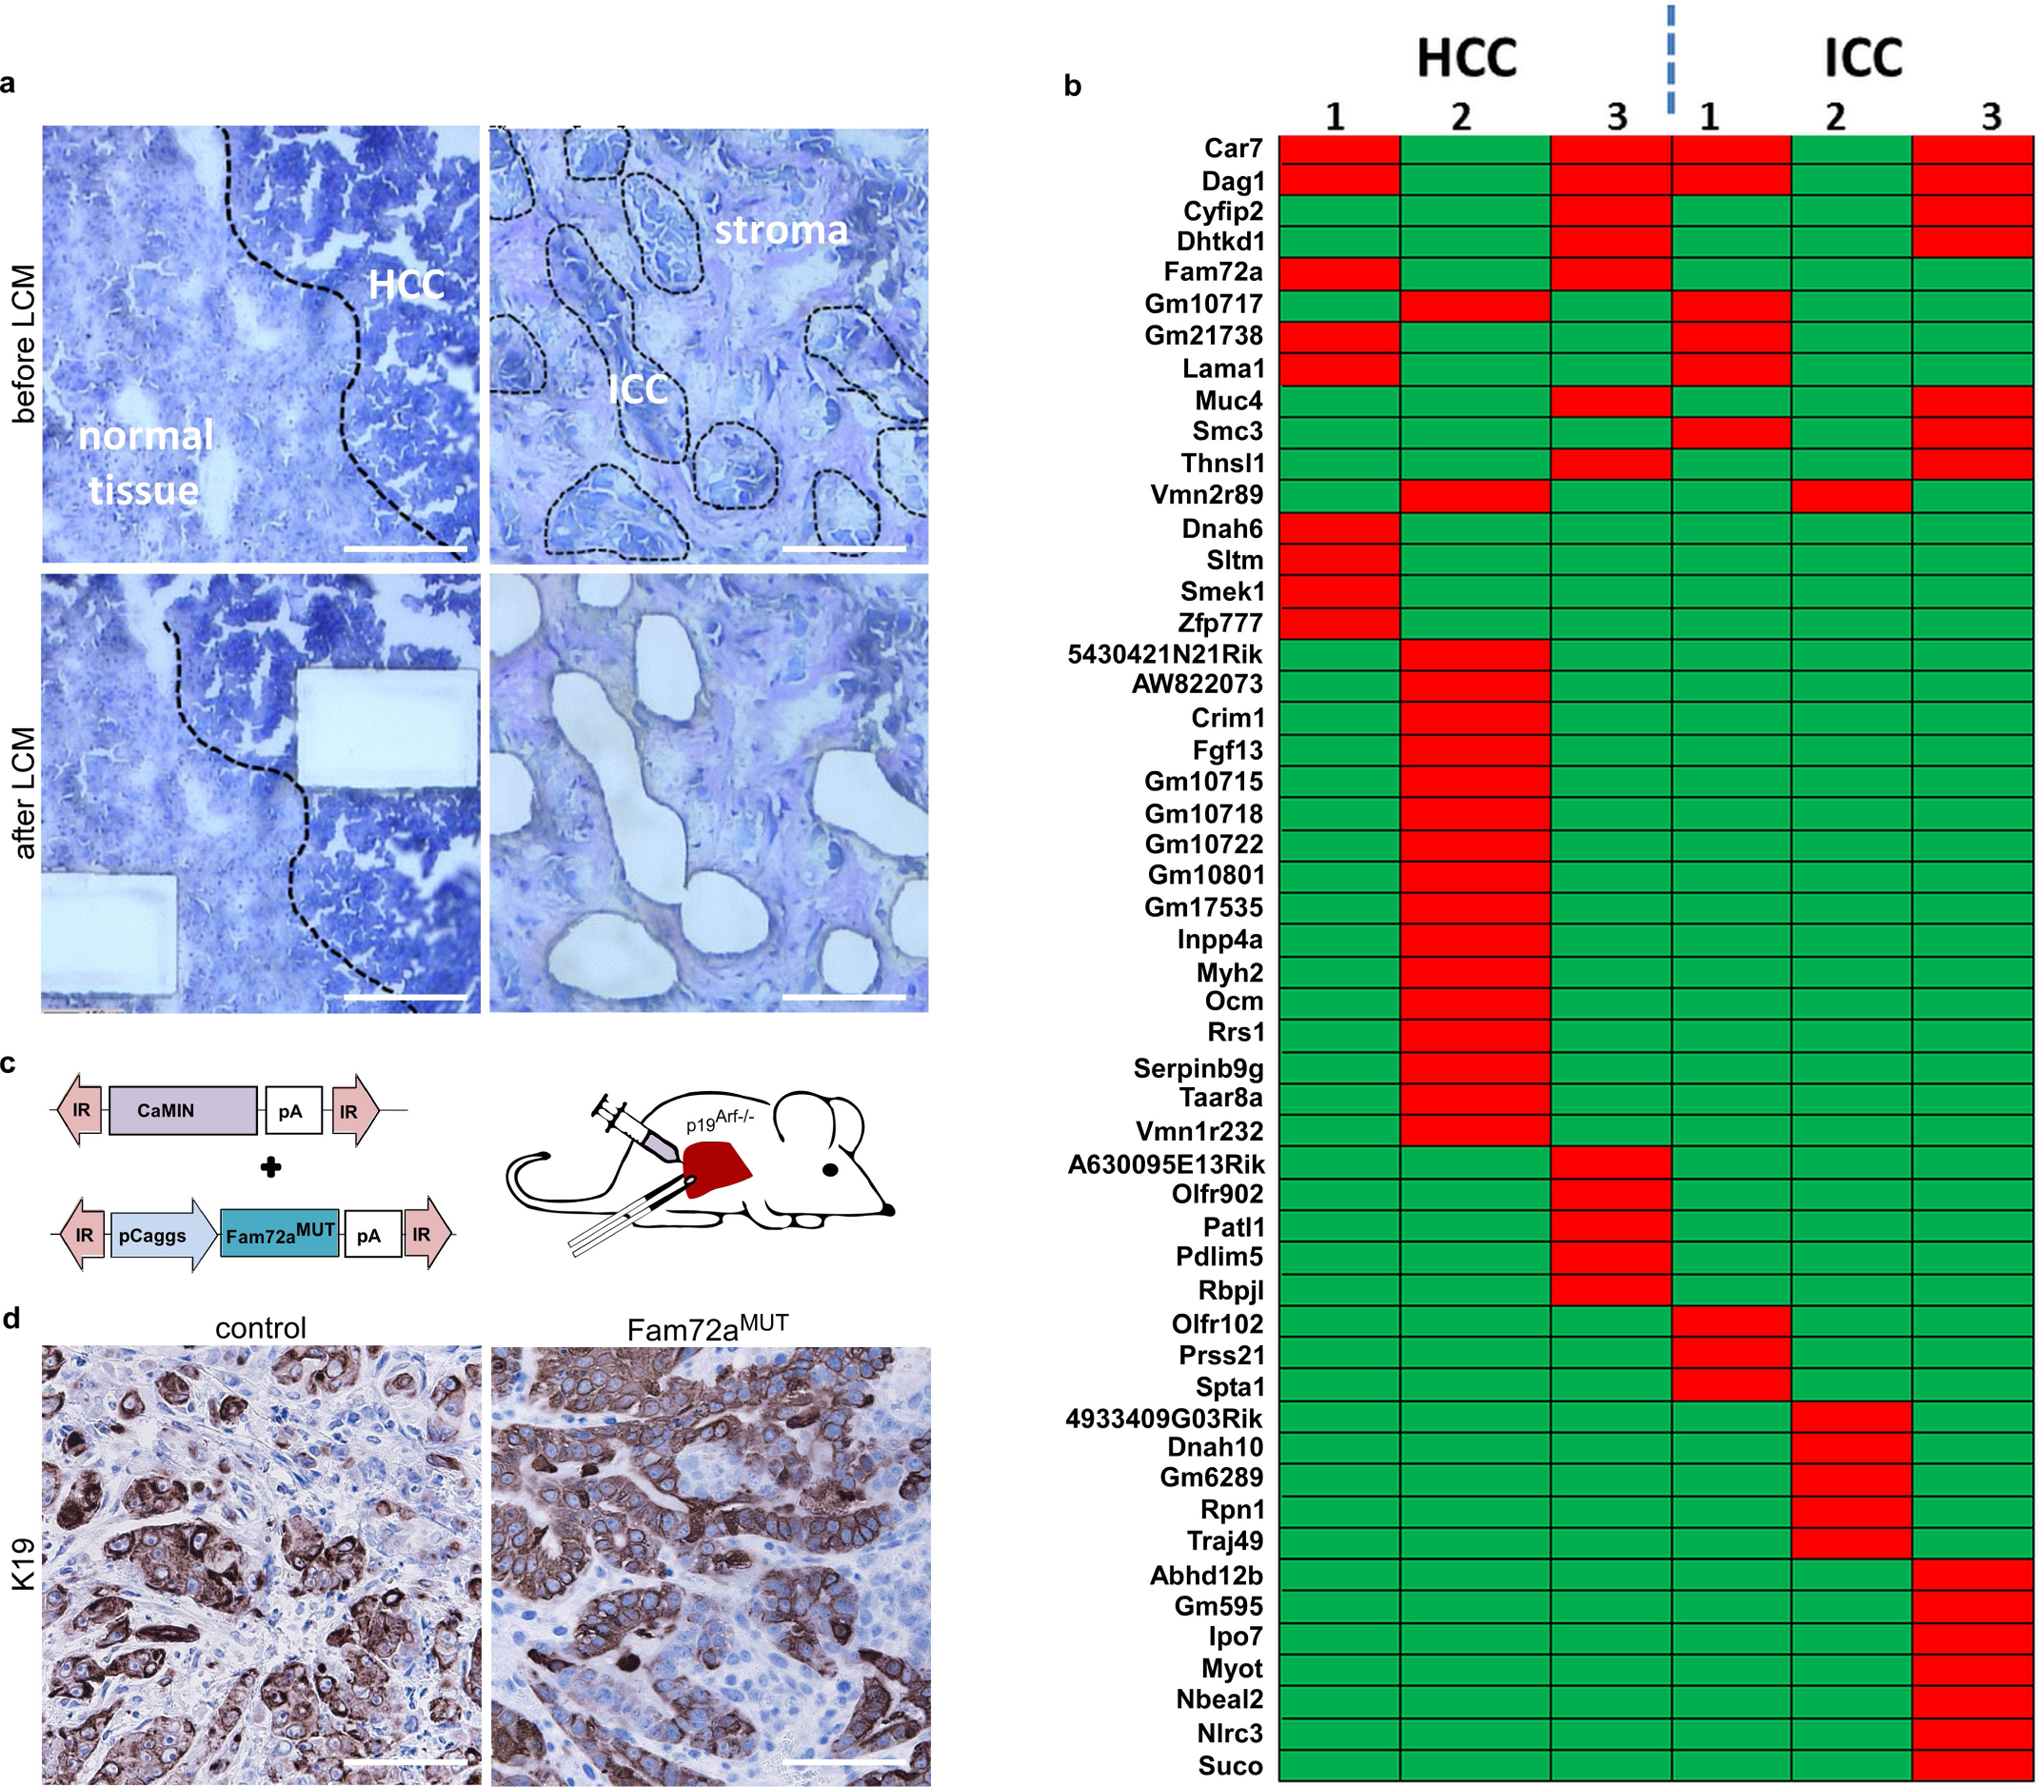
a, Purification of epithelial components from HCC or ICC derived from pCaMIN electroporated p19Arf−/− mice and normal liver tissue as a control using laser capture microdissection (LCM) (n = 3 per group). Scale bars, 100 μm. b, Exome sequencing revealed recurrent mutations (in red), in which 12 mutations were found in at least 2 samples in 3 analysed HCC (left) and 3 ICC (right) tissues. c, Schematic outline of transposon vectors expressing Myc and NrasG12V (pCaMIN) and mutated (259G>T) Fam72a cDNA (bottom), which were co-delivered into p19Arf−/− mice. d, Immunohistochemical analysis of tumour tissue for K19 expression (n = 3 per group). Scale bar, 100 μm.
Extended Data Fig. 3 |. Characterization of early and pre-tumorigenic phase after Epo- or HDTV-mediated oncogene delivery.
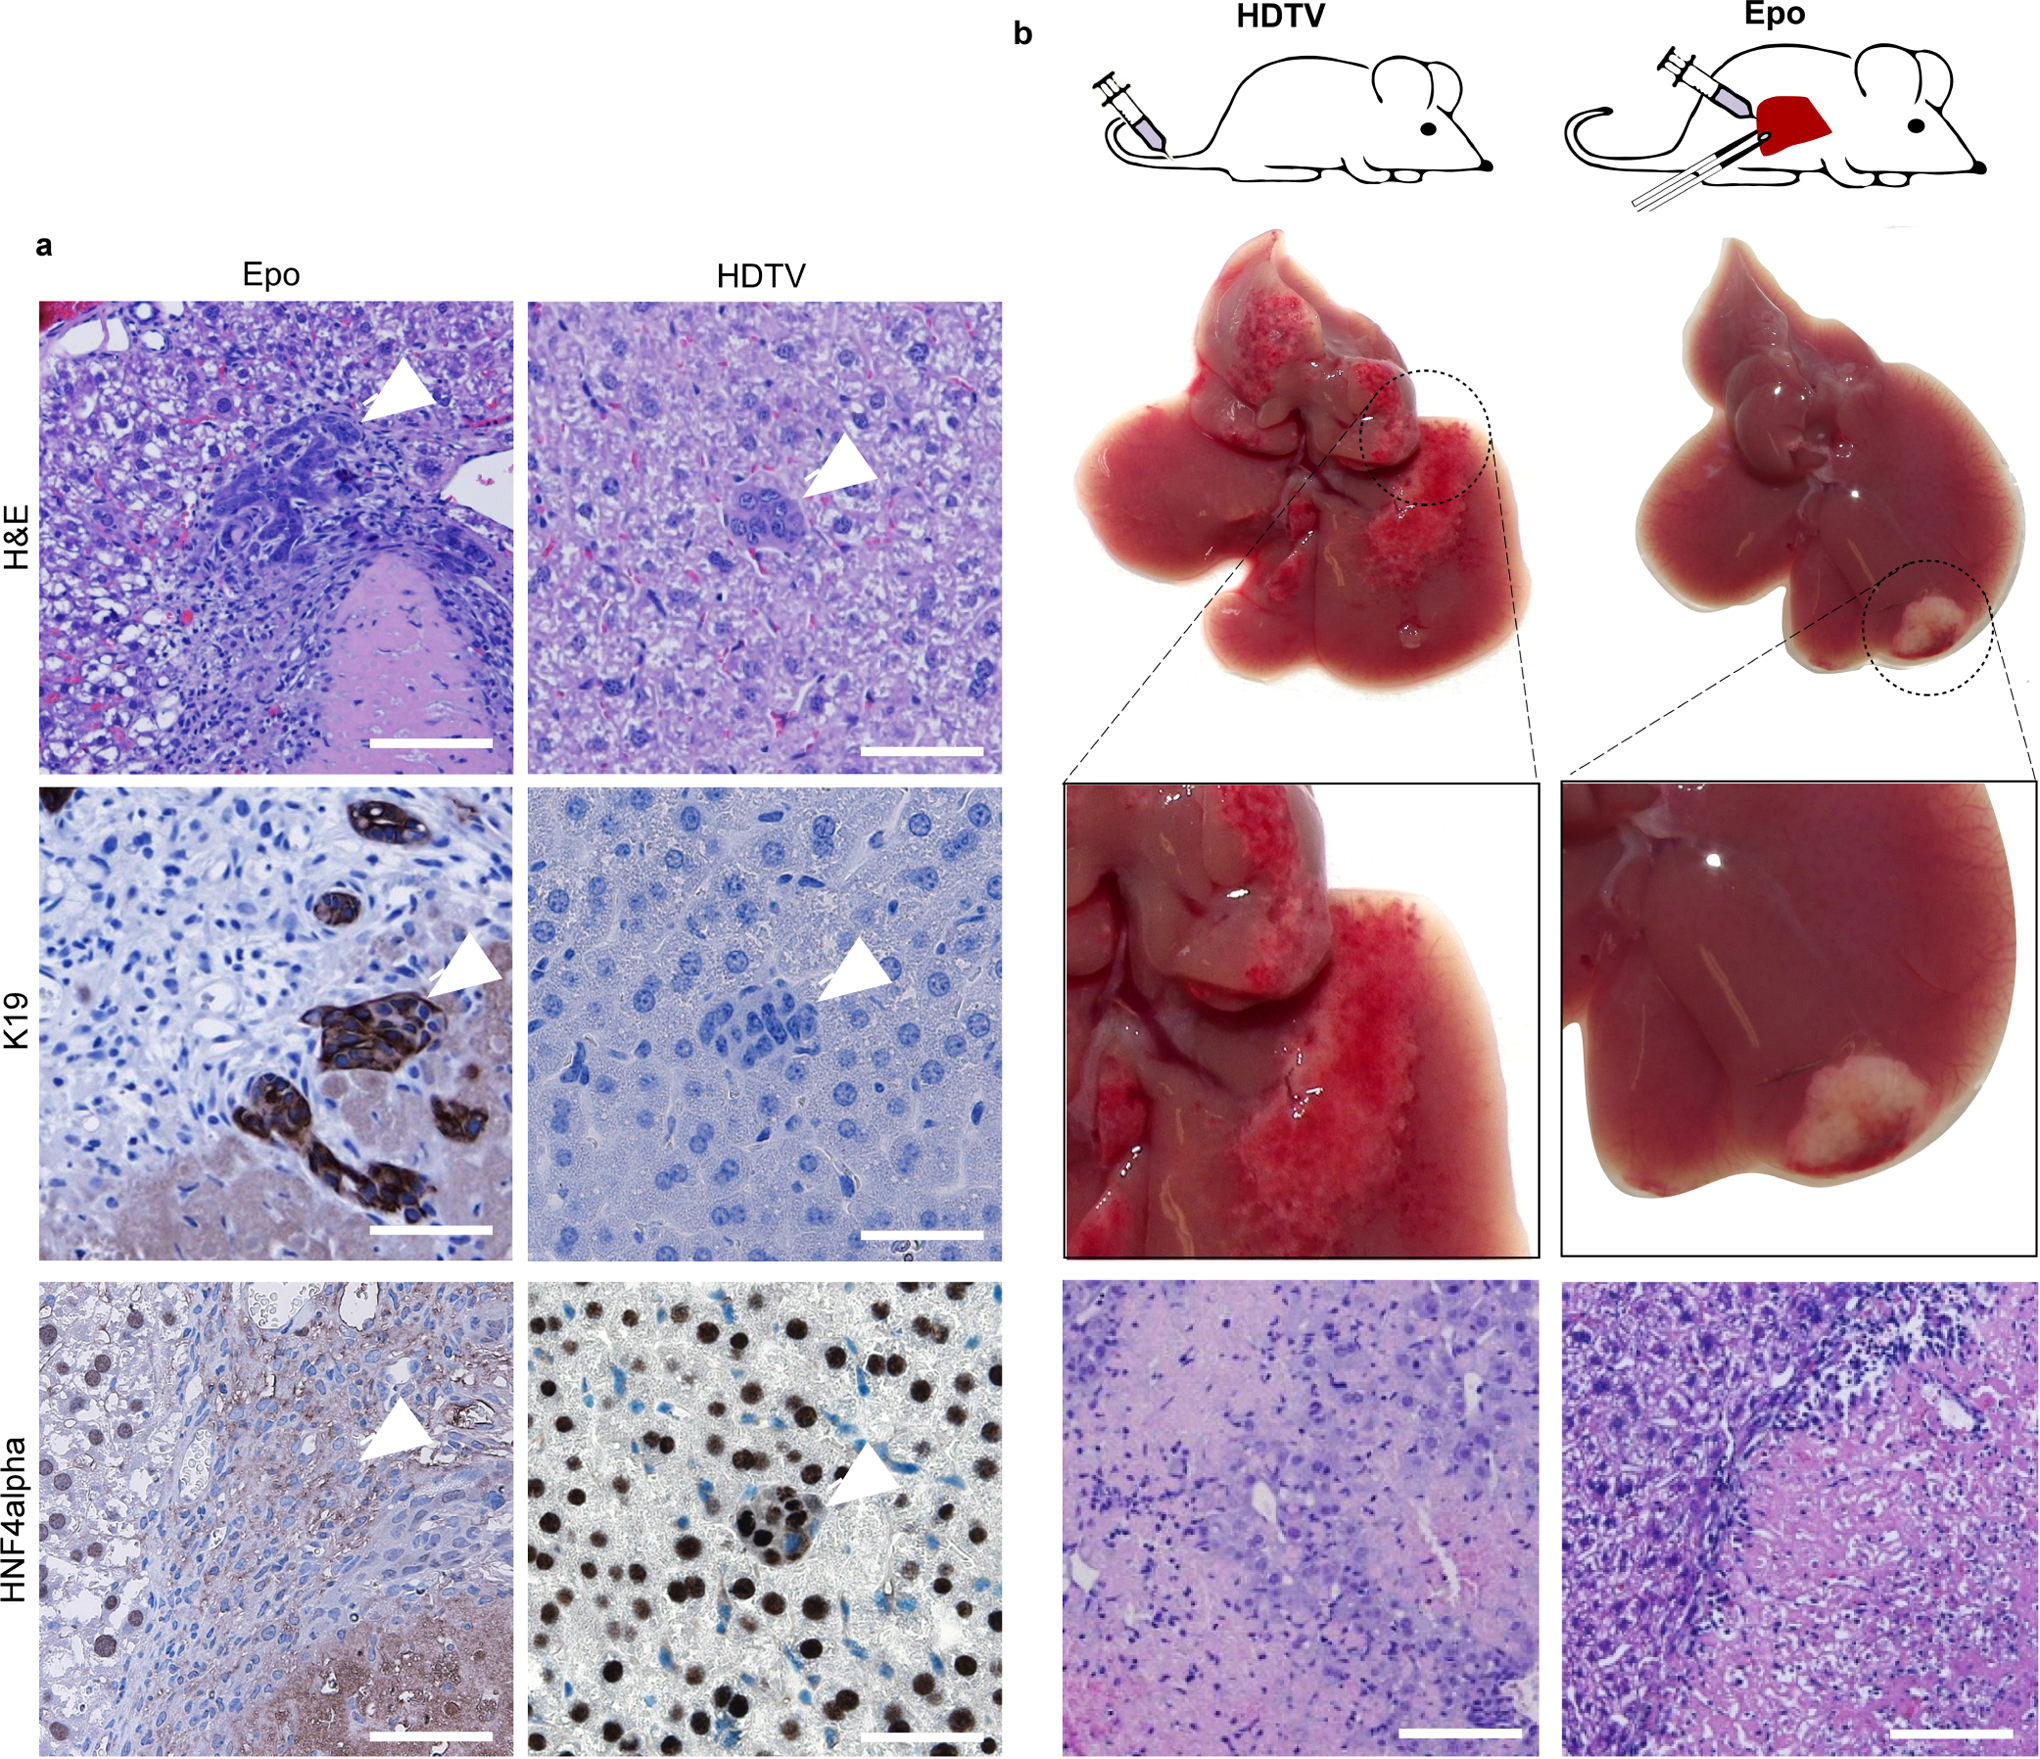
a, Immunohistochemical analysis of p19Arf−/− deficient liver sections 5 days after Epo- or HDTV-mediated transposon delivery, showing microtumours in H&E (top) and Epo-derived K19-positive, HNF4α-negative ICCs (middle and bottom left panel) as well as HDTV-derived HNF4α-positive, K19-negative HCCs (middle and bottom right panel, indicated by white arrowheads) (n = 3). Scale bars, 100 μm. b, Schematic outline of the experimental approach (left) and representative macroscopic liver photographs 3 days after hydrodynamic (HDTV) or Epo delivery of the pCaMIN and SB13 vectors into p19Arf−/− mouse livers. Macroscopically visible liver damage (left) as well as eosinonophilic areas indicating microscopic liver damage (right) are shown on H&E-stained liver sections (n = 4). Original magnification, ×200.
Extended Data Fig. 4 |. Immune composition does not contribute to lineage commitment in liver cancer.
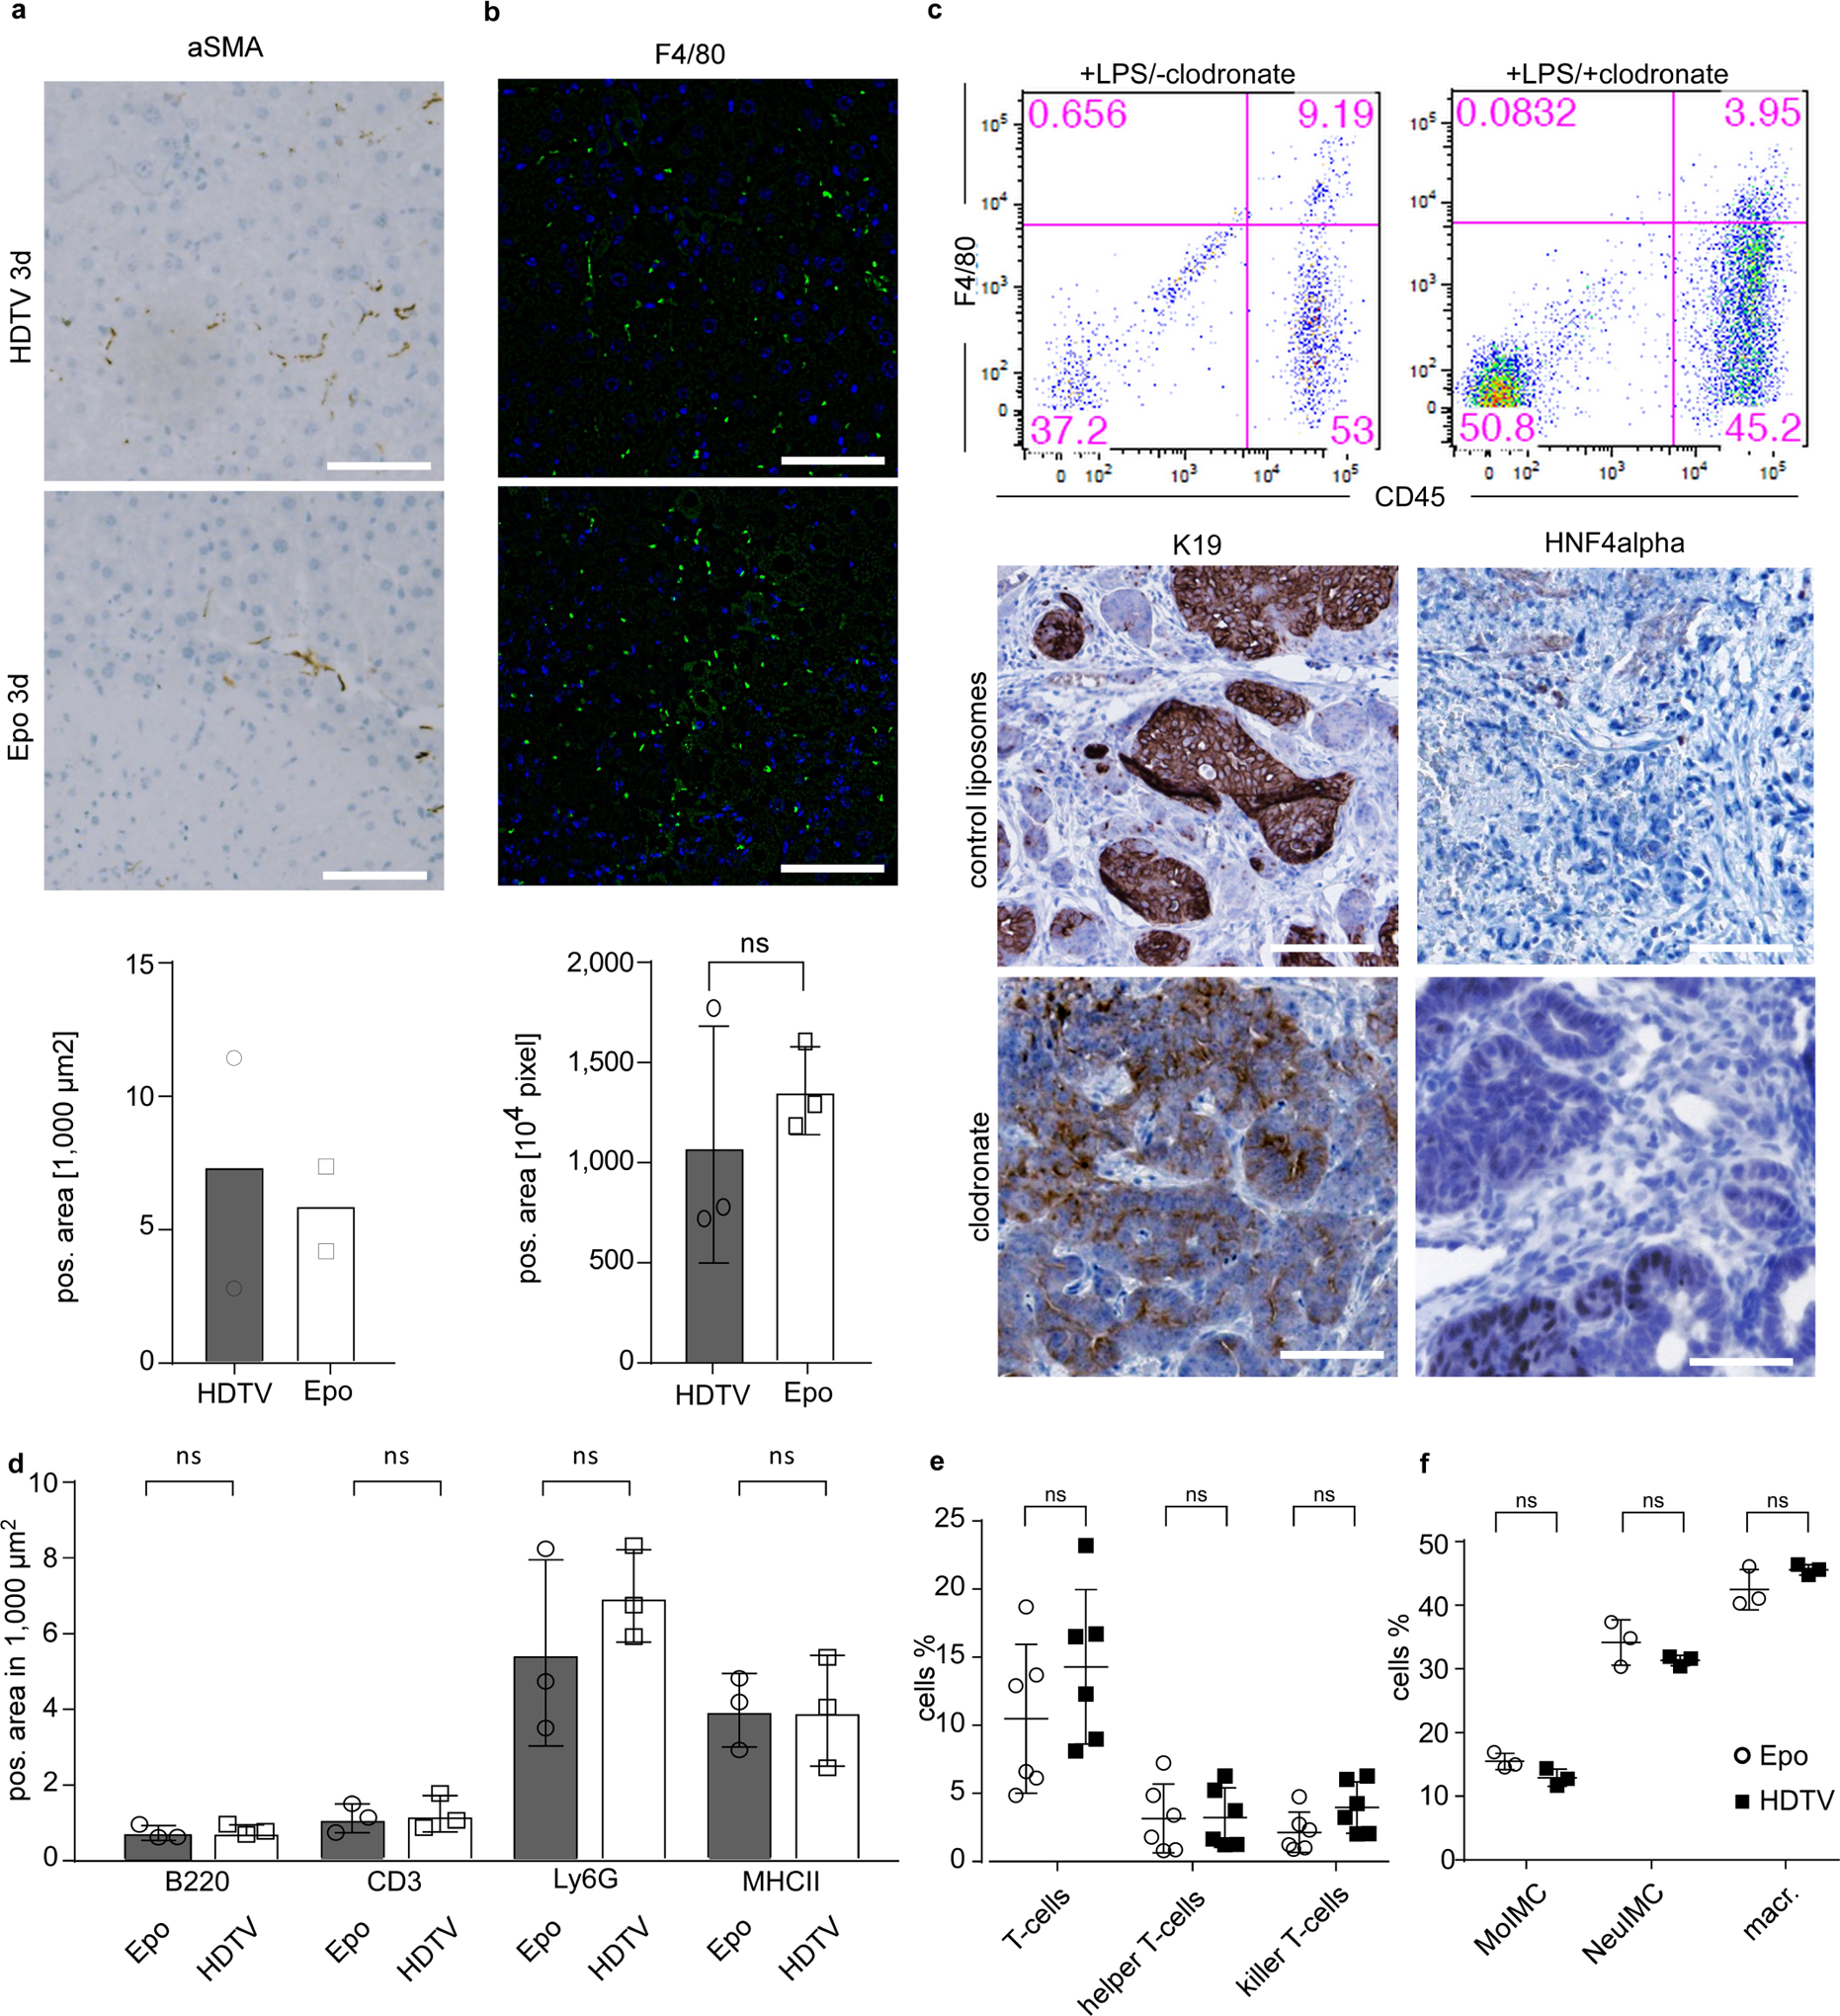
a, Representative micrographs of αSMA immunohistochemistry (top) and quantification (bottom) 3 days after Epo and HDTV treatment in p19Arf−/− livers and quantification (n = 2). Scale bars, 100 μm. Data are mean ± s.d. b, Representative micrographs of F4/80 immunofluorescence (top) and quantification (bottom) 3 days after Epo and HDTV treatment in p19Arf−/− livers (n = 3). Scale bar, 100 μm. NS, P = 0.500, Student’s two-sided t-test. Data are mean ± s.d. c, Flow cytometry analysis showing the efficiency of clodronate in depleting Kupffer cells (CD45+F4/80+) after lipopolysaccharide (LPS) treatment (n = 3). Bottom, representative micrographs of HNF4α and K19 immunostaining analysis of Epo-induced tumours with and without Kupffer cell depletion (n = 3). Scale bar, 100 μm. d, Quantifications of liver-infiltrating immune cells from Fig. 4a, b. B220 P = 0.6255, CD3 P = 0.7649, Ly6G P = 0.3966, MHCII P = 0.9889, Student’s two-sided t-test. Data are mean ± s.d. e, Quantification of T cells (CD45+CD3+, P = 0.2622), T-helper cells (CD45+CD3+CD8−CD4+, P = 0.960) and killer T cells (CD45+CD3+CD8+CD4−, P = 0.0914) (n = 6). P values determined by Student’s two-sided t-test. Data are mean ± s.d. f, Quantification of monocytic immature myeloid cells (moIMC; CD11b+Gr1−lowLy6c+F4/80−, P = 0.0750), neutrophilic immature myeloid cells (NeuIMC; CD11b+Gr1+Ly6c−F480−, P = 0.2483) and macrophages (CD11b+Gr1−Ly6c−F4/80+, P = 0.1744) (n = 3). P values determined by Student’s two-sided t-test. Data are mean ± s.d.
Extended Data Fig. 5 |. Induction of hepatocyte cell death after HDTV or Epo.
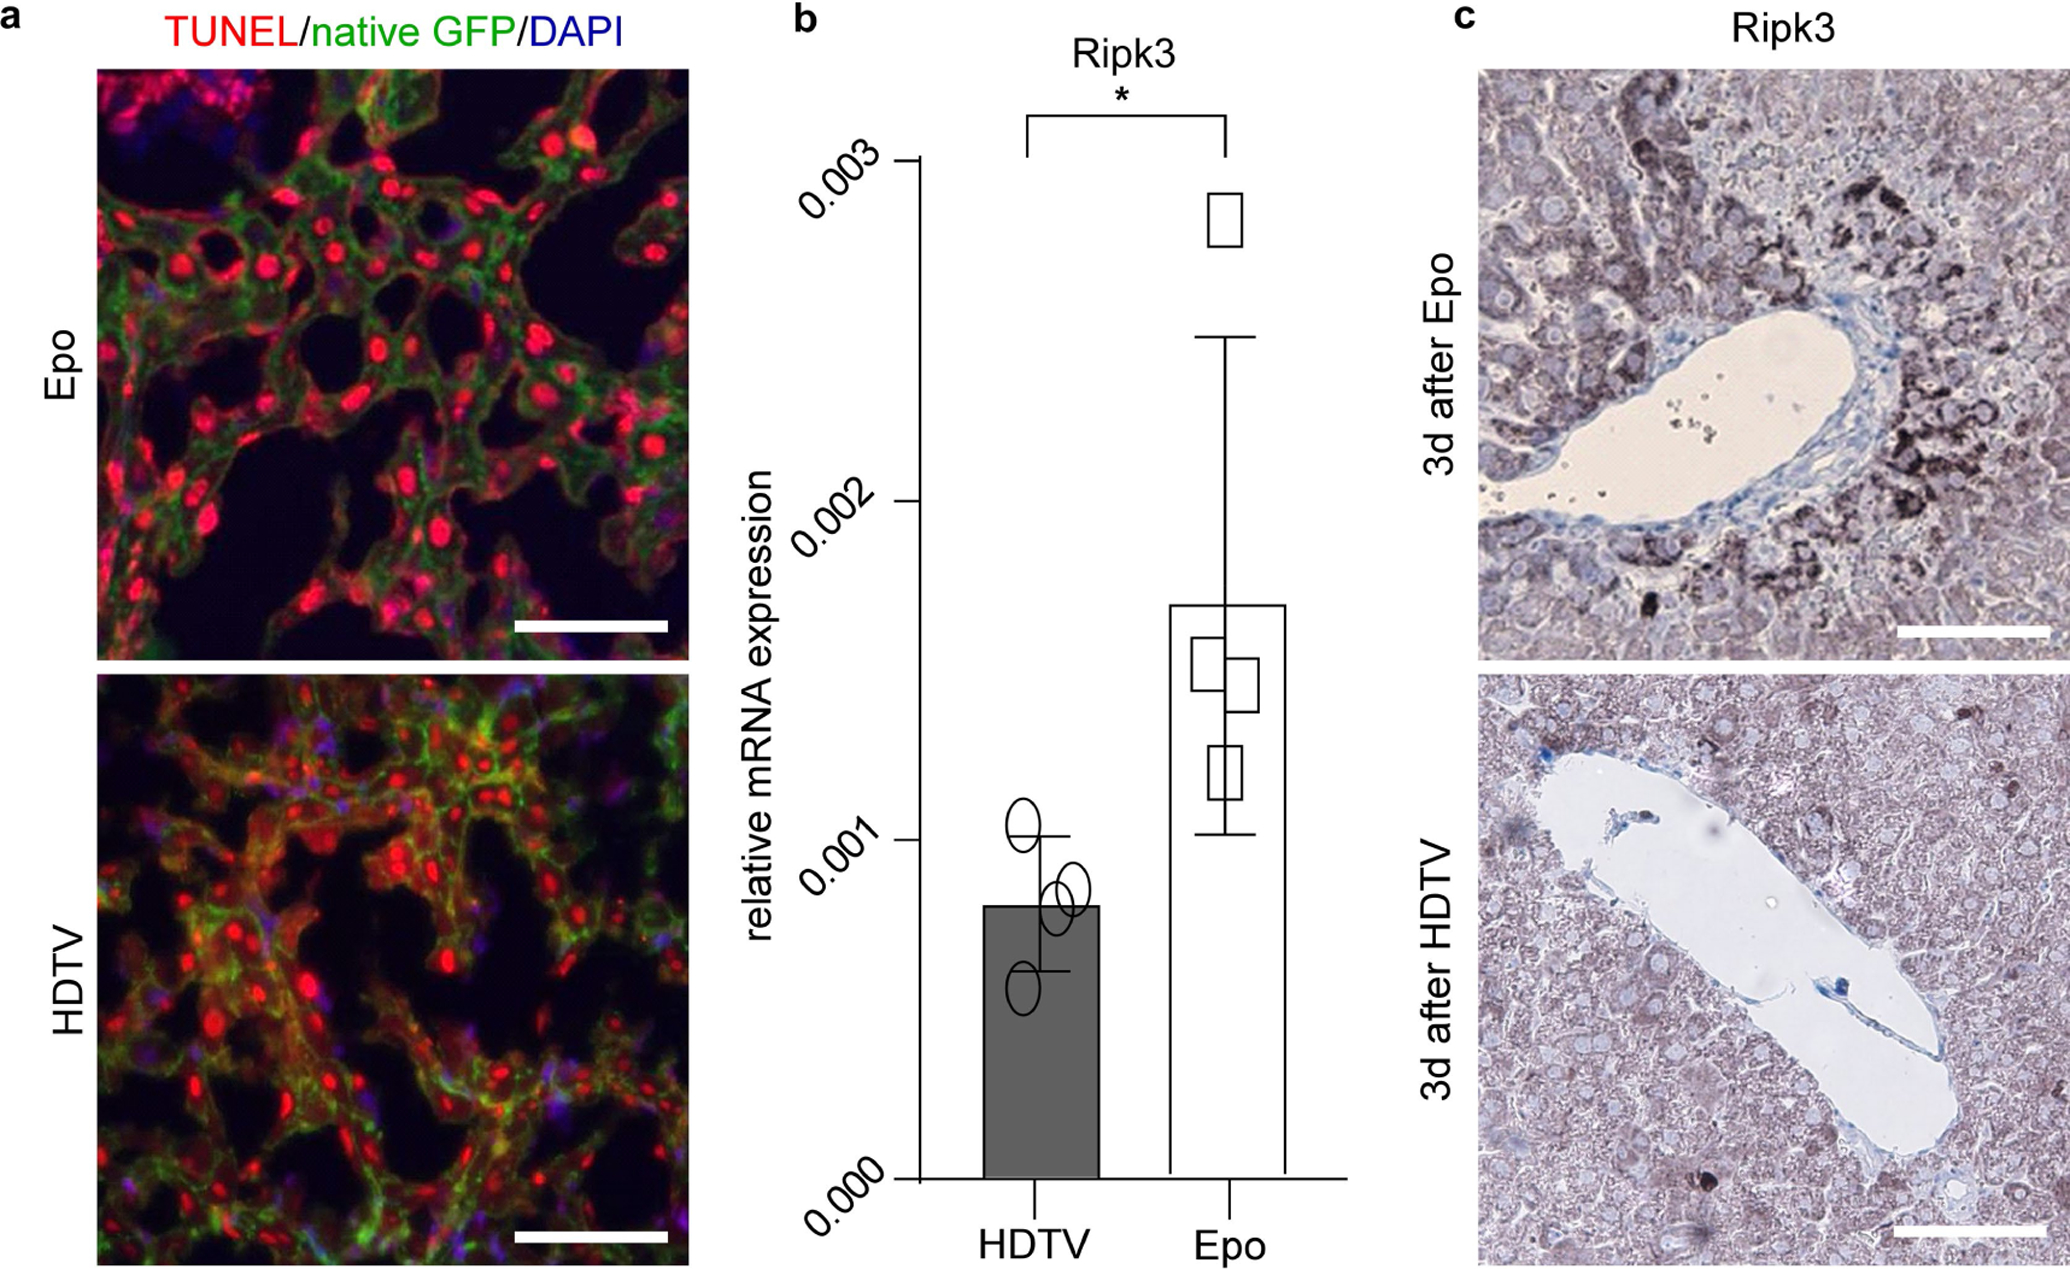
a, Representative micrographs of TUNEL (red) and DAPI (blue) staining in livers of ROSAmT/mG × Alb-cre × p19Arf−/− mice with native membrane GFP (green) in hepatocytes 3 days after Epo or HDTV transfection (n = 3). Scale bars, 100 μm. b, Ripk3 mRNA expression in p19Arf−/− livers 3 days after HDTV delivery of pCaMIN compared to Epo delivery of pCaMIN, determined by qRT–PCR (n = 4). *P = 0.0485, Student’s two-sided t-test. Data are mean ± s.d. c, Representative immunhistochemistry of RIPK3 in livers 3 days after Epo or HDTV treatment (n = 3). Scale bars, 100 μm.
Extended Data Fig. 6 |. Necroptotic cell death affects the hepatic microenvironment and tumorigenesis.
a, Representative TUNEL (green) and DAPI (blue) staining in liver sections from mice with (n = 4) or without (n = 3) Nec-1 pre-treatment 3 days after Epo transfection. Scale bar, 100 μm. b, Quantification of TUNEL-positive cells from mice with (n = 4) or without (n = 3) Nec-1 pre-treatment 3 days after Epo transfection. *P = 0.0264, Student’s two-sided t-test. Data are mean ± s.d. c, Western blot analysis for the apoptosis marker cleaved caspase 3 in liver lysates from livers with (n = 4) or without (n = 3) Nec-1 pre-treatment 3 days after Epo transfection. d, Western blot analysis for MLKL and pMLKL in liver lysates from livers with (n = 4) or without (n = 3) Nec-1 pre-treatment 3 days after Epo transfection. e, Immunohistochemistry quantification of B220 (P = 0.7745), CD3 (P = 0.9809), Ly6G (P = 0.0075) or MHCII (P = 0.0994) in livers with or without Nec-1 pre-treatment 3 days after Epo transfection (n = 3). P values determined by Student’s two-sided t-test. Data are mean ± s.d. f, Magnification of photographs depicted in Fig. 4k, right. Quantification of HNF4α-positive cells in Epo-induced tumours with or without Nec-1 pre-treatment (n = 4). *P = 0.0407, Student’s two-sided t-test. Data are mean ± s.d. g, Western blot analysis of MLKL on lysates from hepatocytes isolated via perfusion from Mlklfl/fl × Alb-cre−/− or Mlklfl/fl × Alb-cre+/− mice. The experiment was done once with two independent Mlklfl/fl × Alb-cre+/− mice and one Mlklfl/fl × Alb-cre−/− mouse). h, Western blot analyses for MLKL, pMLKL and vinculin on lysates from Mlklfl/fl × Alb-cre+/− mice 3 days after Epo treatment. Depicted blot is as shown in Fig. 4d (bottom), with an additional lane showing the pMLKL signal obtained in Mlklfl/fl × Alb-cre−/− mice 3 days after Epo treatment. The experiment was performed twice with similar results. i, Quantification of the duration until tumour size exceeds 0.5 cm after Epo delivery of pCaMIN in p19Arf−/− mice or pCaMIN plus Cas9n and sgRNA against p19Arf in wild-type mice (n = 7). NS, P = 0.0913, Student’s two-sided t-test. Data are mean ± s.d. j, Immunohistochemistry quantification of B220 (P = 0.9220), CD3 (P = 0.1577), Ly6G (P = 0.2375) or MHCII (P = 0.3870) in liver sections from Mlklfl/fl × Alb-cre−/− or Mlklfl/fl × Alb-cre+/− mice 3 days after Epo treatment (n = 3). P values determined by Student’s two-sided t-test. Data are mean ± s.d. k, qPCR-based necroptosis-associated cytokine profile measured on mRNA isolated from livers of Mlklfl/fl × Alb-cre−/− or Mlklfl/fl × Alb-cre+/− mice 3 days after Epo treatment. Overlapping downregulated cytokines with Nec-1-treated mice are indicated in green (compare to Fig. 4g). From the 11 cytokines that were found to be suppressible by Nec-1 treatment (Fig. 4g), the expression of 6 was found to be attenuated in Epo-treated MLKL-deficient livers as compared to wild-type livers. This difference might be explained by Nec-1-mediated inhibition of RIPK1-dependent signalling in cells other than hepatocytes. This could also explain why Nec-1 treatment reduced the Ly6G-positive cells in Epo livers (compare to Extended Data Fig. 6e), whereas MLKL deficiency had no effect on the numbers of Ly6G-positive cells after Epo treatment (compare to Extended Data Fig. 6j) (n = 2). Data are fold change of the mean from each group. l, Quantification of HNF4α-positive cells in liver sections of Epo-induced tumours in Mlklfl/fl × Alb-cre−/− or Mlklfl/fl × Alb-cre+/− mice (n = 5). *P = 0.0381, Student’s two-sided t-test. Data are mean ± s.d. m, Representative photograph of HNF4α and K19 staining of pCaMIN Epo-derived tumours in Mlkl wild-type × Alb-cre+/− mice (n = 2). n, Representative micrographs of pRIPK3 immunohistochemistry in tissue sections from sham-operated or bile duct ligated livers of Arfp19−/− mice (n = 3 each). Scale bars, 100 μm. o, Western blot analyses for MLKL and pMLKL on liver lysates from sham-operated or bile duct ligated Arfp19−/−mice (n = 3 each).
Extended Data Fig. 7 |. Necroptosis signatures are found in primary human liver carcinomas.
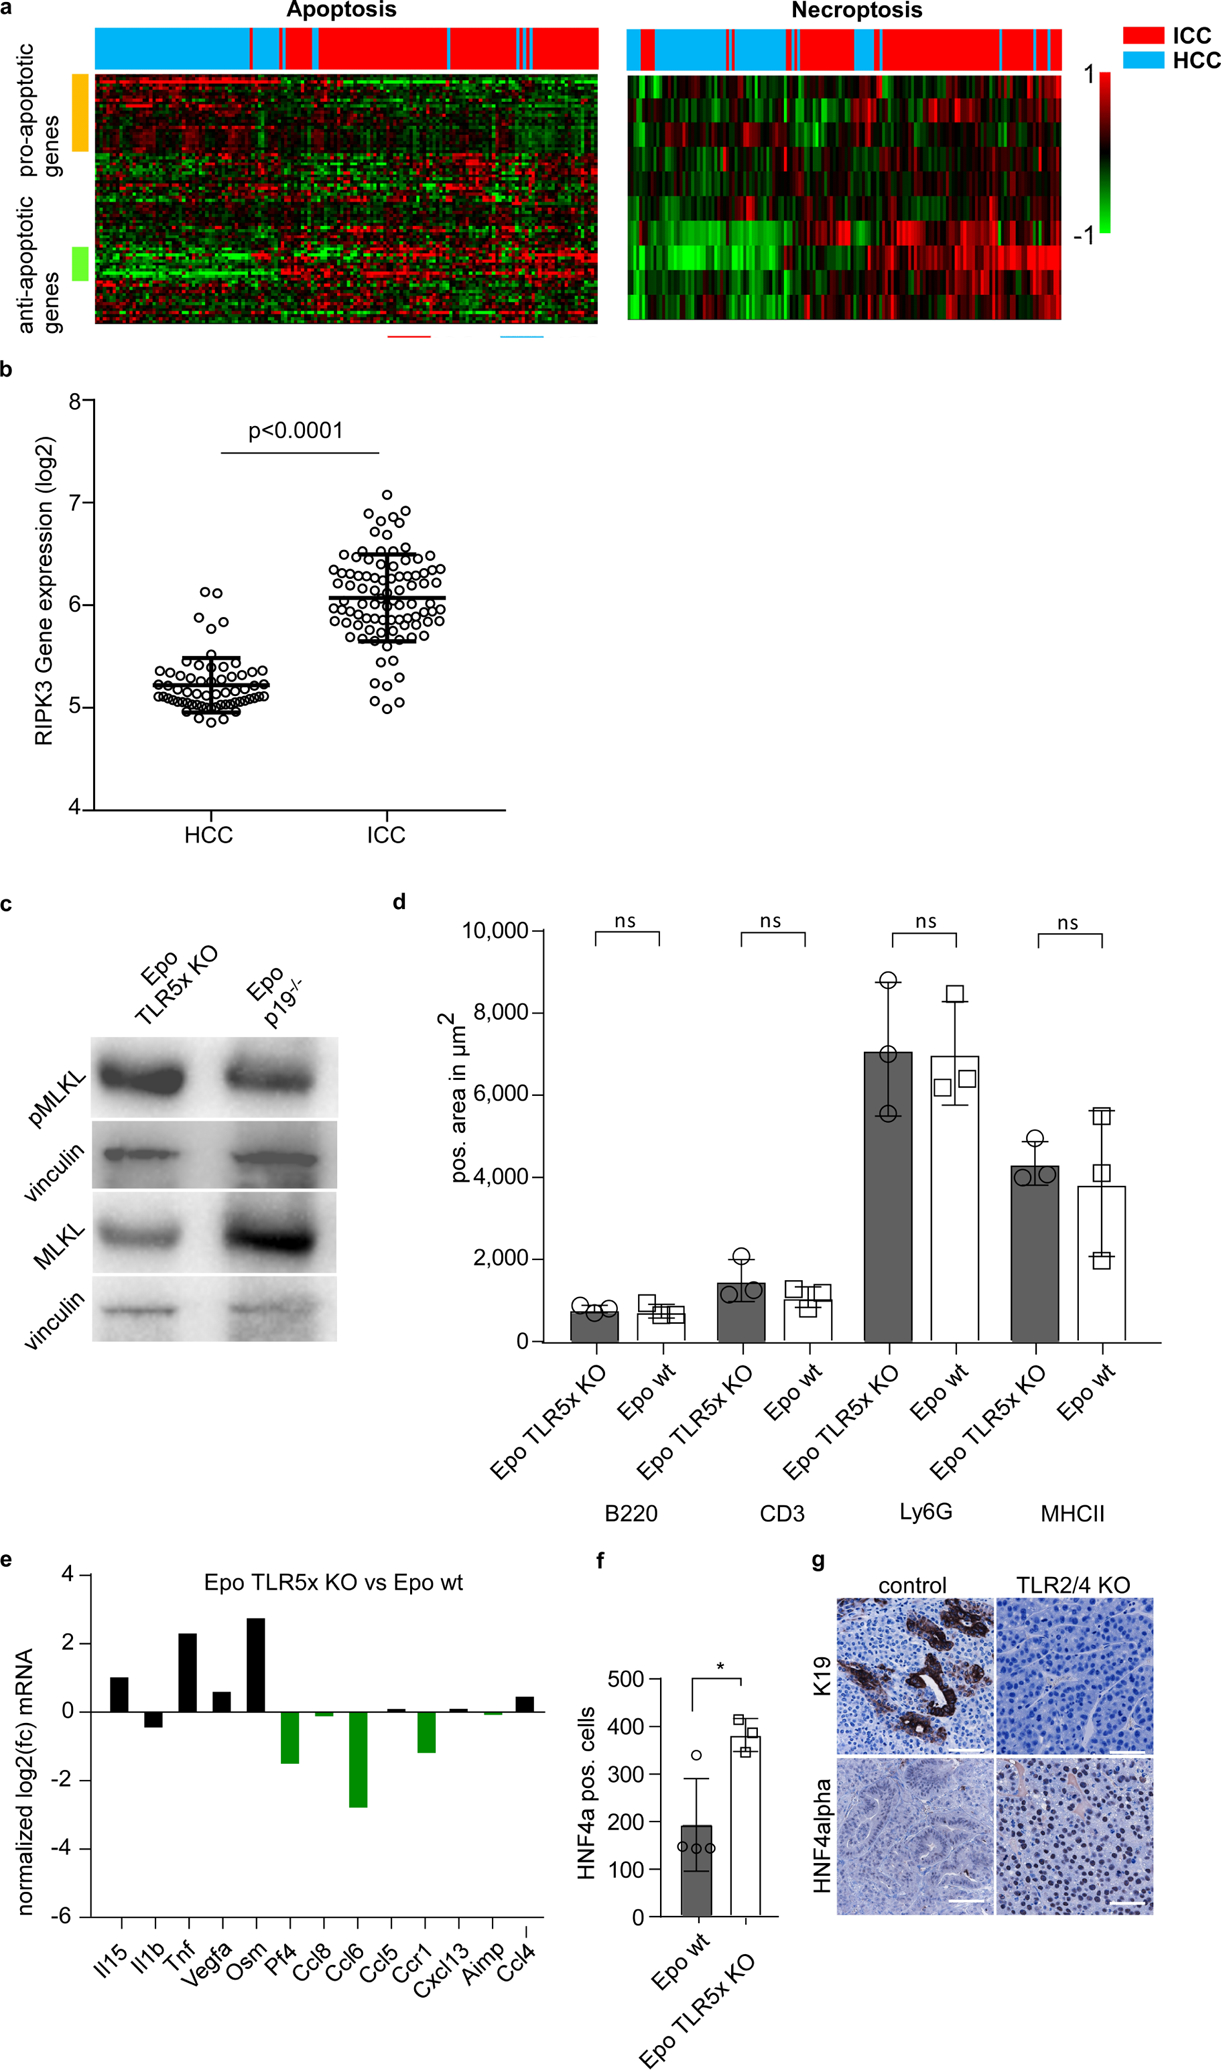
a, Transcriptomic patterns of apoptosis- (n = 84) or necroptosis- (n = 10) related genes in patients with HCC and ICC (n = 199) analysed via hierarchal clustering analysis. b, Gene expression of RIPK3 in ICC and HCC patient samples from the TIGER-LC cohort24(n = 199). P < 0.0001, Student’s two-sided t-test. Data are mean ± s.d. c, Western blot analysis for MLKL and pMLKL in lysates from TLR-knockout and p19Arf−/− mouse livers 3 days after Epo treatment. The experiment was performed once (n = 4 mice each). d, Immunohistochemistry quantification of B220 (P = 0.6698), CD3 (P = 0.2846), Ly6G (P = 0.9362) or MHCII (P = 0.6734) in livers from TLR5-knockout or syngeneic wild-type mice 3 days after Epo treatment (n = 3). P values determined by Student’s two-sided t-test. Data are mean ± s.d. e, qPCR-based cytokine profile of necroptosis-associated pattern in TLR5-knockout or syngeneic wild-type mice 3 days after Epo treatment (n = 2). Data are fold change of the mean from each group. f, Quantification of HNF4α-positive cells in Epo-induced tumours in TLR KO (TLR2, 3, 4, 7 and 9-knockout) (n = 3) or syngeneic wild-type (n = 4) mice. *P = 0.0255, Student’s two-sided t-test. Data are mean ± s.d. g, Representative micrographs of HNF4α and K19 staining on sections from tumours triggered by pCaMIN Epo delivery in TLR2 and TLR4 knockout or syngeneic wild-type mice (n = 5). Scale bar, 100 μm.
Extended Data Fig. 8 |. Generation and analysis of clonally derived cell lines from HDTV or Epo tumours.
a, Immunocytochemistry of isolated single cell lines of HDTV-derived HCC and Epo-derived ICC tumours. Depicted are representative co-staining images of K19 (red) and DAPI (blue). Scale bars, 100 μm. Experiment was performed twice with similar results. b, Schematic outline of the generation of clonal cell lines of Epo and HDTV tumours for subcutaneous injection into immunodeficient Rag2−/− mice. c, Representative micrographs of sections from subcutaneously grown HCC (see b; top) and ICC (bottom) with H&E (left) and K19 (right) staining. These data show that both HCC and ICC phenotypes are stably maintained even after in vitro passaging and in vivo retransplantation procedures in mice (n = 3). Scale bars, 100 μm. d, Bi-clustering of pairwise Pearson’s correlations based on normalized ATAC-seq fragment pseudo-counts for differentially accessible areas in ICC (n = 4 single cell clones) and HCC (n = 4 single cell clones). e, f, qRT–PCR analysis for Tbx3 (e) or Prdm5 (f) in mouse HCC or ICC cells (n = 4 single cell clones each). ***P = 0.0004, ****P < 0.0001, Student’s two-sided t-test. Data are mean ± s.d.
Extended Data Fig. 9 |. Influence of PRDM5 and TBX3 on tumour phenotype.
a, Representative micrographs of immunostaining for HNF4α or K19 on tumour sections after Epo delivery of pCaMIN transposon vector co-expressing control shRNA (shRen) and full-length Tbx3 (pCAMINshRen + Tbx3 Epo) or pCaMIN vector co-expressing Prdm5 shRNA and full-length Tbx3 (pCAMINPrdm5_1 + Tbx3 Epo) (n = 3). Scale bars, 100 μm. b, Representative micrograph of tumours induced by Epo delivery of pCaMIN and Tbx3 overexpression in ROSAmT/mG × Alb-cre × p19Arf−/− mice showing DAPI (blue) and mGFP (green) positivity (n = 6). Scale bar, 100 μm. c, qRT–PCR analysis for Tbx3 in mouse HCC cells stably expressing shRNAs targeting Tbx3 (shTbx3_1 and shTbx_2; n = 3). Data are mean ± s.d. d, qRT–PCR analysis for Prdm5 in mouse ICC cells stably expressing shRNAs targeting Prdm5 (shPrdm5_1 and shPrdm5_2; n = 2). Data are mean ± s.d.
Extended Data Fig. 10 |. Direct and indirect changes of Tbx3 and Prdm5 targets and pathways.
a, b, ChIP–seq density heat map for two biological replicates in the global set of reproducible peaks detected for Tbx3 (a) and Prdm5 (a) following the irreproducible discovery rate workflow (a and b, left) and corresponding ATAC-seq signal (a and b, right). Peaks are ranked according to the average ChIP–seq signal across replicates. The data are expressed as normalized reads per million mapped reads (RPM). The signal is shown 5 kb upstream and downstream of the centre of the ChIP–seq peaks. c, d, Heat maps depicting gene expression changes after Tbx3 shRNA-mediated (c) and Prdm5 shRNA-mediated (d) suppression. Only direct Tbx3 and Prdm5 targets are shown. Data are expressed as z-score. For each transcription factor (TBX3 or PRDM5), n = 4 cases (2 shRNAs per target, biological duplicates for each) and n = 2 controls (1 control shRNA in duplicate), two-sided moderated t-statistics. e, f, Heat maps depicting gene expression changes after Tbx3 (e) and Prdm5 (f) shRNA-mediated stable knockdown. Each knockdown experiment was performed in established cell lines from two different clones using two different shRNAs. In these heat maps, both direct and indirect Tbx3 and Prdm5 ChIP–seq-derived gene targets are shown. Differentially regulated genes were separated into direct or indirect Tbx3 or Prdm5 targets based on the presence or absence of proximal ChIP–seq peaks (<100 kb from the TSS or inside the gene body of deregulated genes). Data are expressed as row Z-score. For each transcription factor (TBX3 or PRDM5), n = 4 cases (2 shRNAs per target, biological duplicates for each) and n = 2 controls (1 control shRNA in duplicate), two-sided moderated t-statistics. g, Functional over-representation map depicting MSigDB canonical pathways associated to all/direct target/indirect target genes perturbed after Tbx3 and Prdm5 knockdown. The size of dots is proportional to the P value based on the hypergeometric distribution obtained when testing for over-representation, and their colour denotes whether the term is enriched for up or downregulated gene list. These data show regulation of distinct downstream pathways between Tbx3 (for example, biological oxidation, developmental biology) and Prdm5 (for example, extracellular matrix organization, collagen formation or Erbb signalling) (n = 4 cases; 2 shRNAs per target, biological duplicates for each, and n = 2 controls; 1 control shRNA in duplicate). h, qRT–PCR analysis of epigenetic modifiers from livers 3 days after Epo or HDTV treatment. All significantly regulated genes are shown (n = 3). P values determined by Student’s two-sided t-test. Data are fold changes of the mean.
Supplementary Material
Acknowledgements
We thank E. Rist, P. Schiemann, C. Fellmeth, C.-J. Hsieh, D. Heide and J. Hetzer for technical help or assistance. We thank A. Weber for providing TLR2 and TLR4 knockout mice and W. S. Alexander and The Walter and Eliza Hall Institute of Medical Research for providing Mlklfl/fl mice. The Cas9n–p19Arf sgRNA vector was provided by W. Xue. We thank the c.ATG facility of Tuebingen University and CeGaT Tuebingen for exome sequencing and data analysis. This work was supported by the ERC Consolidator Grant ‘CholangioConcept’ (to L.Z.), the German Research Foundation (DFG): grants FOR2314, SFB685, SFB/TR209 and the Gottfried Wilhelm Leibniz Program (to L.Z.). Further funding was provided by the German Ministry for Education and Research (BMBF) (e:Med/Multiscale HCC), the German Universities Excellence Initiative (third funding line: ‘future concept’), the German Center for Translational Cancer Research (DKTK), the German-Israeli Cooperation in Cancer Research (DKFZ-MOST) (to L.Z.) and the Intramural Research Program of the Centre for Cancer Research, National Cancer Institute, National Institutes of Health (to X.W.W.). The group of O.B. is supported by grants from ANR-BMFT, Fondation ARC pour la recherche sur le Cancer, INSERM, and the National Cancer Institute of the National Institutes of Health under Award Number R01CA136533. O.B. is a CNRS fellow.
Footnotes
Competing interests The authors declare no competing interests.
Extended data is available for this paper at https://doi.org/10.1038/s41586-018-0519-y.
Supplementary information is available for this paper at https://doi.org/10.1038/s41586-018-0519-y.
References
- 1.Farazi PA & DePinho RA Hepatocellular carcinoma pathogenesis: from genes to environment. Nat. Rev. Cancer 6, 674–687 (2006). [DOI] [PubMed] [Google Scholar]
- 2.Rizvi S & Gores GJ Pathogenesis, diagnosis, and management of cholangiocarcinoma. Gastroenterology 145, 1215–1229 (2013). [DOI] [PMC free article] [PubMed] [Google Scholar]
- 3.Sirica AE & Gores GJ Desmoplastic stroma and cholangiocarcinoma: clinical implications and therapeutic targeting. Hepatology 59, 2397–2402 (2014). [DOI] [PMC free article] [PubMed] [Google Scholar]
- 4.Wu W et al. Pattern of distant extrahepatic metastases in primary liver cancer: a SEER based study. J. Cancer 8, 2312–2318 (2017). [DOI] [PMC free article] [PubMed] [Google Scholar]
- 5.Fan B et al. Cholangiocarcinomas can originate from hepatocytes in mice. J. Clin. Invest 122, 2911–2915 (2012). [DOI] [PMC free article] [PubMed] [Google Scholar]
- 6.Li X et al. Co-activation of PIK3CA and Yap promotes development of hepatocellular and cholangiocellular tumors in mouse and human liver. Oncotarget 6, 10102–10115 (2015). [DOI] [PMC free article] [PubMed] [Google Scholar]
- 7.Nkontchou G et al. Peripheral intrahepatic cholangiocarcinoma occurring in patients without cirrhosis or chronic bile duct diseases: epidemiology and histopathology of distant nontumoral liver in 57 White patients. Eur. J. Gastroenterol. Hepatol 25, 94–98 (2013). [DOI] [PubMed] [Google Scholar]
- 8.Schulz PO et al. Association of nonalcoholic fatty liver disease and liver cancer. World J. Gastroenterol 21, 913–918 (2015). [DOI] [PMC free article] [PubMed] [Google Scholar]
- 9.Kang TW et al. Senescence surveillance of pre-malignant hepatocytes limits liver cancer development. Nature 479, 547–551 (2011). [DOI] [PubMed] [Google Scholar]
- 10.Dauch D et al. A MYC-aurora kinase A protein complex represents an actionable drug target in p53-altered liver cancer. Nat. Med 22, 744–753 (2016). [DOI] [PubMed] [Google Scholar]
- 11.Zender L et al. Cancer gene discovery in hepatocellular carcinoma. J. Hepatol 52, 921–929 (2010). [DOI] [PMC free article] [PubMed] [Google Scholar]
- 12.Gürlevik E et al. Adjuvant gemcitabine therapy improves survival in a locally induced, R0-resectable model of metastatic intrahepatic cholangiocarcinoma. Hepatology 58, 1031–1041 (2013). [DOI] [PubMed] [Google Scholar]
- 13.Marquardt JU, Andersen JB & Thorgeirsson SS Functional and genetic deconstruction of the cellular origin in liver cancer. Nat. Rev. Cancer 15, 653–667 (2015). [DOI] [PubMed] [Google Scholar]
- 14.Iverson SV, Comstock KM, Kundert JA & Schmidt EE Contributions of new hepatocyte lineages to liver growth, maintenance, and regeneration in mice. Hepatology 54, 655–663 (2011). [DOI] [PMC free article] [PubMed] [Google Scholar]
- 15.Fujita T & Narumiya S Roles of hepatic stellate cells in liver inflammation: a new perspective. Inflamm. Regen 36, 1 (2016). [DOI] [PMC free article] [PubMed] [Google Scholar]
- 16.Grasl-Kraupp B et al. In situ detection of fragmented DNA (TUNEL assay) fails to discriminate among apoptosis, necrosis, and autolytic cell death: a cautionary note. Hepatology 21, 1465–1468 (1995). [DOI] [PubMed] [Google Scholar]
- 17.Luedde T, Kaplowitz N & Schwabe RF Cell death and cell death responses in liver disease: mechanisms and clinical relevance. Gastroenterology 147, 765–783.e4 (2014). [DOI] [PMC free article] [PubMed] [Google Scholar]
- 18.Gautheron J et al. A positive feedback loop between RIP3 and JNK controls non-alcoholic steatohepatitis. EMBO Mol. Med 6, 1062–1074 (2014). [DOI] [PMC free article] [PubMed] [Google Scholar]
- 19.Afonso MB et al. Activation of necroptosis in human and experimental cholestasis. Cell Death Dis. 7, e2390 (2016). [DOI] [PMC free article] [PubMed] [Google Scholar]
- 20.Pasparakis M & Vandenabeele P Necroptosis and its role in inflammation. Nature 517, 311–320 (2015). [DOI] [PubMed] [Google Scholar]
- 21.Ofengeim D & Yuan J Regulation of RIP1 kinase signalling at the crossroads of inflammation and cell death. Nat. Rev. Mol. Cell Biol 14, 727–736 (2013). [DOI] [PubMed] [Google Scholar]
- 22.Murphy JM et al. The pseudokinase MLKL mediates necroptosis via a molecular switch mechanism. Immunity 39, 443–453 (2013). [DOI] [PubMed] [Google Scholar]
- 23.Postic C et al. Dual roles for glucokinase in glucose homeostasis as determined by liver and pancreatic beta cell-specific gene knock-outs using Cre recombinase. J. Biol. Chem 274, 305–315 (1999). [DOI] [PubMed] [Google Scholar]
- 24.Chaisaingmongkol J et al. Common molecular subtypes among Asian hepatocellular carcinoma and cholangiocarcinoma. Cancer Cell 32, 57–70.e3 (2017). [DOI] [PMC free article] [PubMed] [Google Scholar]
- 25.Conrad ML et al. Maternal TLR signaling is required for prenatal asthma protection by the nonpathogenic microbe Acinetobacter lwoffii F78. J. Exp. Med 206, 2869–2877 (2009). [DOI] [PMC free article] [PubMed] [Google Scholar]
- 26.Cheng HY, Chen XW, Cheng L, Liu YD & Lou G DNA methylation and carcinogenesis of PRDM5 in cervical cancer. J. Cancer Res. Clin. Oncol 136, 1821–1825 (2010). [DOI] [PubMed] [Google Scholar]
- 27.Suzuki A, Sekiya S, Büscher D, Izpisúa Belmonte JC & Taniguchi H Tbx3 controls the fate of hepatic progenitor cells in liver development by suppressing p19ARF expression. Development 135, 1589–1595 (2008). [DOI] [PubMed] [Google Scholar]
- 28.DePristo MA et al. A framework for variation discovery and genotyping using next-generation DNA sequencing data. Nat. Genet 43, 491–498 (2011). [DOI] [PMC free article] [PubMed] [Google Scholar]
- 29.Buenrostro JD, Giresi PG,, Zaba LC, Chang HY & Greenleaf WJ Transposition of native chromatin for fast and sensitive epigenomic profiling of open chromatin, DNA-binding proteins and nucleosome position. Nat. Methods 10, 1213–1218 (2013). [DOI] [PMC free article] [PubMed] [Google Scholar]
- 30.Bolger AM, Lohse M & Usadel B Trimmomatic: a flexible trimmer for Illumina sequence data. Bioinformatics 30, 2114–2120 (2014). [DOI] [PMC free article] [PubMed] [Google Scholar]
- 31.Langmead B & Salzberg SL Fast gapped-read alignment with Bowtie 2. Nat. Methods 9, 357–359 (2012). [DOI] [PMC free article] [PubMed] [Google Scholar]
- 32.Ross-Innes CS et al. Differential oestrogen receptor binding is associated with clinical outcome in breast cancer. Nature 481, 389–393 (2012). [DOI] [PMC free article] [PubMed] [Google Scholar]
- 33.Risso D, Schwartz K, Sherlock G & Dudoit S GC-content normalization for RNA-Seq data. BMC Bioinformatics 12, 480 (2011). [DOI] [PMC free article] [PubMed] [Google Scholar]
- 34.Risso D, Ngai J, Speed TP & Dudoit S Normalization of RNA-seq data using factor analysis of control genes or samples. Nat. Biotechnol 32, 896–902 (2014). [DOI] [PMC free article] [PubMed] [Google Scholar]
- 35.Robinson MD, McCarthy DJ & Smyth GK edgeR: a Bioconductor package for differential expression analysis of digital gene expression data. Bioinformatics 26, 139–140 (2010). [DOI] [PMC free article] [PubMed] [Google Scholar]
- 36.Ramírez F, Dündar F, Diehl S, Grüning BA & Manke T deepTools: a flexible platform for exploring deep-sequencing data. Nucleic Acids Res. 42, W187–W191 (2014). [DOI] [PMC free article] [PubMed] [Google Scholar]
- 37.Skene PJ & Henikoff S A simple method for generating high-resolution maps of genome-wide protein binding. eLife 4, e09225 (2015). [DOI] [PMC free article] [PubMed] [Google Scholar]
- 38.Aronesty E Comparison of sequencing utility programs. Open Bioinformatics 7, 1–8 (2013). [Google Scholar]
- 39.Langmead B, Trapnell C, Pop M & Salzberg SL Ultrafast and memory-efficient alignment of short DNA sequences to the human genome. Genome Biol. 10, R25 (2009). [DOI] [PMC free article] [PubMed] [Google Scholar]
- 40.Li H et al. The Sequence Alignment/Map format and SAMtools. Bioinformatics 25, 2078–2079 (2009). [DOI] [PMC free article] [PubMed] [Google Scholar]
- 41.Feng J et al. Using MACS to identify peaks from ChIP–seq data. Bioinformatics 34, 2.14.1–2.14.14 (2011) [DOI] [PMC free article] [PubMed] [Google Scholar]
- 42.Landt SG et al. ChIP-seq guidelines and practices of the ENCODE and modENCODE consortia. Genome Res. 22, 1813–1831 (2012). [DOI] [PMC free article] [PubMed] [Google Scholar]
- 43.Carvalho BS & Irizarry RA A framework for oligonucleotide microarray preprocessing. Bioinformatics 26, 2363–2367 (2010). [DOI] [PMC free article] [PubMed] [Google Scholar]
- 44.Durinck S, Spellman PT, Birney E & Huber W Mapping identifiers for the integration of genomic datasets with the R/Bioconductor package biomaRt. Nat. Protocols 4, 1184–1191 (2009). [DOI] [PMC free article] [PubMed] [Google Scholar]
- 45.Ritchie ME et al. limma powers differential expression analyses for RNA-sequencing and microarray studies. Nucleic Acids Res. 43, e47 (2015). [DOI] [PMC free article] [PubMed] [Google Scholar]
Associated Data
This section collects any data citations, data availability statements, or supplementary materials included in this article.
Supplementary Materials
Data Availability Statement
The data and code that support the findings of this study are available from the corresponding author on reasonable request. Source data for graphs showed in Figs. 4, 5 and Extended Data Figs. 1, 4–10 are available in the online version of this paper. Data from ChIP–seq experiments are available at the Sequence Read Archive (SRA) under the accession number SRP136997. Whole scans of western blots are depicted in Supplementary Fig. 1, and the gating strategy for flow cytometry is depicted in Supplementary Fig. 2.