Abstract
Host plant preference of agricultural pests may shift throughout the growing season, allowing the pests to persist on wild hosts when crops are not available. Lygus Hahn (Hemiptera: Miridae) bugs are severe pests of cotton during flowering and fruiting stages, but can persist on alternative crops, or on weed species. Diversity of digestive enzymes produced by salivary glands and gut tissues play a pivotal role in an organism’s ability to utilize various food sources. Polyphagous insects produce an array of enzymes that can process carbohydrates, lipids, and proteins. In this study, the digestive enzyme repertoire of the tarnished plant bug, Lygus lineolaris (Palisot de Beauvois), was identified by high-throughput sequencing followed by cDNA cloning and sequencing. This study identified 87 digestive genes, including 30 polygalacturonases (PG), one β-galactosidase, three α-glucosidases, six β-glucosidases, 28 trypsin-like proteases, three serine proteases, one apyrase-like protease, one cysteine protease, 12 lipases, and two transcripts with low similarity to a xylanase A-like genes. RNA-Seq expression profiles of these digestive genes in adult tarnished plant bugs revealed that 57 and 12 genes were differentially expressed in the salivary gland and gut (≥5-fold, P ≤ 0.01), respectively. All polygalacturonase genes, most proteases, and two xylanase-like genes were differentially expressed in salivary glands, while most of the carbohydrate and lipid processing enzymes were differentially expressed in the gut. Seven of the proteases (KF208689, KF208697, KF208698, KF208699, KF208700, KF208701, and KF208702) were not detected in either the gut or salivary glands.
Keywords: tarnished plant bug, digestive enzyme, expression profile, RNA-Seq, salivary gland
The tarnished plant bug, Lygus lineolaris (Palisot de Beauvois) (Hemiptera: Miridae), and other Lygus species feed on a wide variety of crops and wild hosts including corn, cotton, broccoli, strawberries, goldenrod, and pigweed (Scott 1977, Snodgrass et al. 1984). Substantial economic losses occur when tarnished plant bugs feed on reproductive tissues such as flowers, fruits, and seeds of crop hosts. Plant bugs feed by piercing tissues, injecting saliva containing digestive enzymes, and sucking partially digested tissues that are further processed in the gut. Saliva secreted by plant bugs contains large number of digestive enzymes (Handley and Pollard 1993, Shackel et al. 2005, Allen and Walker 2012, Showmaker et al. 2016). The digestive enzymes secreted into the probed site remain active for a prolonged period, continuing tissue damage long after feeding is completed (Handley and Pollard 1993, Shackel et al. 2005). Tissue damage caused by this prolonged digestive activity of secreted enzymes leads to loss of flowers and fruits, reductions in growth rates, and deformations of tissues due to uneven growth rates in affected tissues resulting in economic losses. For example, plant bug damage to strawberries often cause fruit deformation that diminishes market value (Rhainds and English-Loeb 2003, Wold and Hutchison 2003, Dara et al. 2018).
Many plants express chemical defenses against herbivore feeding (Amiri et al. 2016, Mason et al. 2019). Insects that move between different host plants must evolve different suites of countermeasure digestive enzymes to respond to different inhibitors from plants (Chougule et al. 2005, Josephrajkumar et al. 2006, Huang et al. 2009, Li et al. 2013, Halon et al. 2015, Pinheiro et al. 2017). Although partial transcriptomes and some digestive enzymes have been reported from plant bugs (e.g., Allen 2007, Allen and Mertens 2008, Walker and Allen 2010, Hull et al. 2013, Magalhaes et al. 2013, Showmaker et al. 2016), the full repertoire of macromolecule processing enzymes in this insect has not been studied. Here we report the characterization of different classes of digestive enzymes and their expression profiles in the gut and salivary gland of the tarnished plant bug.
Methods
Insects
Lygus lineolaris were obtained from a laboratory colony (USDA-ARS Southern Insect Management Research Unit, Stoneville, MS) maintained at 25°C under 20% humidity and a 14:10 (L:D) h photoperiod with the light on period starting at 0500 hours (Shelby et al. 2015). Insects used in the experiments were reared on broccoli until they were dissected, and 2- to 8-d-old adult insects were used in all experiments. Salivary glands and guts of males and females were dissected separately and three replicate pools of 10 salivary glands and five guts were used for RNA extractions and construction of RNA-Seq libraries for expression profiling.
RNA Extractions and cDNA Synthesis
Total RNA was isolated for all experiments using TriZol (Invitrogen, Carlsbad, CA). To obtain cDNA for digestive enzyme amplification and cloning, a custom designed oligo d(T) primer (5′-GGTAATACGACTCACTATAGGGAGAAGAGGCGAGCACAGAATTAATACGACTTTTTTTTTTTTTTTTTTTTV-3′) was used to selectively convert mRNA to cDNA from total RNA. For cloning digestive genes, the total RNA extracted from all life stages was pooled and mRNA was enriched using PolyA+ Tract magnetic bead kit (Promega, Madison, WI). Full-length cDNA was synthesized using GeneRacer 5′-RACE cDNA synthesis kit (Invitrogen).
Transcriptome Sequencing and Digestive Gene Identification
Nymphs and adults of L. lineolaris collected from field locations near Stoneville, MS, and all life stages from eggs to adults obtained from a laboratory colony maintained at the USDA-ARS Southern Insect Management Research Unit, Stoneville, MS was used to extract total RNA using Trizol Reagent (Invitrogen). This pool of total RNA was submitted to Center for Genomics and Bioinformatics, Indiana University for construction of Roche 454 GS FLX -Titanium (Roche/454 Life Sciences, Branford, CT) high-throughput sequencing libraries using the protocol described in Schwartz et al. (2010). Approximately 700 ng of total RNA pool was used to synthesize cDNA in a manner similar to Clontech SMART protocols (Clontech, Mountainview, CA), using primers optimized for Roche 454 sequencing process, followed by PCR amplification to generate dsDNA. Amplified cDNA was partially normalized to reduce sequence coverage of high copy number transcripts by controlled in-solution hybridization and double-stranded nuclease (DSN) digestion using the Trimmer Direct kit (Evrogen, Moscow, Russia). Partially normalized cDNA library was fragmented by sonication and ligated to customized 454 adaptors after enzymatically blunting the ends. The library was sequenced using the emulsion PCR protocol provided by the manufacturer (Roche/454 Life Sciences, Branford, CT). Sequencing adapters were removed using the signal processing software (Roche/454 Life Sciences, Branford, CT) and assembled into contigs using GS de novo assembler (NEWBLER v2.0.00.22, Roche/454 Life Sciences) with the default parameters (40 bp overlap; 90% identity). Contigs with less than 200 nucleotides were removed from the final assembly. The resulting contigs were annotated using Blast2GO v3.0 (BioBam, Valencia, Spain). Putative digestive enzymes were identified from the annotated transcriptome and used for designing gene-specific primers for cloning and validation by Sanger sequencing.
Digestive Enzyme cDNA Cloning and Bioinformatic Analyses
Gene-specific primers were designed for the 5′ end of full-length digestive enzyme transcripts. A common primer binding to the custom oligo d(T) primer (5′-GCGAGCACAGAATTAATACGACT-3′) was used as the reverse primer to amplify full-length transcripts. Contigs that were truncated at the 5′-end were amplified with a gene-specific primer designed to the 3′-end of the contig sequence and the nested 5′-RACE primer (5′-GGACACTGACATGGACTGAAGGAGTA-3′). When nucleotide polymorphisms were detected in transcripts, additional forward and reverse primers were designed to the middle of those transcripts to verify nucleotide sequence. All primers used for amplification and Sanger sequencing of putative digestive genes are given in Supp Table S1 [online only]. Amplicons were cloned into pCR2.1 TOPO T-A cloning vector (Invitrogen) and chemically competent Top10 E. coli cells were transformed to obtain recombinant clones. Dideoxy sequencing of selected clones were performed at the USDA-ARS Genomics and Bioinformatics Research Unit, Stoneville, MS. Nucleotide sequence reads of five or more clones with PHRED quality score ≥30 from each PCR product were used to obtain consensus sequences of each digestive sequence reported. The BLASTX similarity search algorithm (http://blast.ncbi.nlm.nih.gov/) was used to identify related sequences from other species. Database matches that had e values <1.0 e−5 were considered to be significant matches. Alignment of L. lineolaris sequences were performed alone or in conjunction with other arthropod sequences identified from BLAST analyses. Identification of predicted signal peptide sequences was performed using the SIGNALP 4.0 server (http://www.cbs.dtu.dk/services/SignalP/) and the Simple Modular Architecture Research tool (http://smart.embl-heidelberg.de/; Petersen et al. 2011, Letunic et al. 2012), respectively.
Phylogenetic Tree Construction
Evolutionary analyses of the putative digestive gene sequences of L. lineolaris were conducted in conjunction with other arthropod sequences identified from BLAST analyses. MUSCLE (Edgar 2004) algorithm and the best fit model search implemented in MEGA 10.0.5 (Kumar et al. 2018). The evolutionary history was inferred using the Neighbor-Joining (NJ) method implemented in MEGA 10.0.5 using the James, Taylor, and Thornton (JTT) model (Jones et al. 1992) with Gamma distributed variation in sites with a Gamma parameter of 1.5 and bootstrap support based on 10,000 iterations. The resulting tree was condensed to collapse branches with less than 50% bootstrap replicate support.
RNA-Seq Library Construction
mRNA was enriched from 5 μg total RNA extracted from triplicate pools of male and female salivary gland and gut tissues using PolyA+ Tract magnetic bead kit (Promega, Madison, WI). Separate full-length double-stranded cDNA was synthesized from 50 ng of mRNA from each tissue using SuperScript double-Stranded cDNA synthesis kit (Invitrogen) using the manufacturer’s protocol. Illumina short-read libraries were prepared from double-stranded cDNA from experimental samples using Nextera library construction kit (Illumina, San Diego, CA) following the manufacturer’s instructions. Unique barcoded adapters were used to index sequencing libraries made from triplicate samples from gut and salivary glands of males and females. Individual libraries were quantified using KAPA library quantification reagents (KAPA Biosystems, Cape Town, South Africa) and library pools containing equimolar quantities were size-fractionated on a SAGE-ELF device (SAGE Sciences, Beverly, MA). Indexed cDNA libraries were sequenced on an Illumina Hi-Seq2500 instrument to obtain 100 nt single reads.
Expression Profiling
Illumina RNA-Seq reads were filtered for quality and adapters were removed prior to use in expression profiling with ArrayStar 12.0 software (DNAStar, Madison, Wisconsin). When multiple alleles or variants of a gene were present, only one copy was used in the expression profiling. Expression data was first transformed using reads per kilobase per million reads (RPKM) followed by scaling all experiments to a common mean, and finally, normalizing the expression levels to that of L. lineolaris β-tubulin 1 gene transcript (KJ810523.1). β-tubulin 1 gene was selected as the calibrator based on previous reports (Walker and Allen 2010, Benoit et al. 2014, Rodrigues et al. 2014, Shelby et al. 2015, Yang et al. 2016, Lü et al. 2018) Log base 2 gene expression levels, standard deviations, and fold difference in gene expression levels compared to gut tissues (control) were calculated using ArrayStar 12.0 software (DNAStar, Madison, WI). Raw read counts mapped to each transcript were obtained for each sample separately.
Quantitative Real-Time PCR Validation of Expression Profiles
PCR primers were designed to the coding sequences of a representative sample of L. lineolaris digestive genes and the housekeeping genes alpha- and beta-tubulin genes to amplify approximately 100 bp fragment from each gene. Amplification of single discrete products from the cDNA preparations was confirmed by performing 40 cycles of quantitative real-time PCR (qRT-PCR), followed by dissociation curve analysis using an ABI7500-Fast sequence analysis instrument (AppliedBiosystems, Foster City, CA). The amplicons were also run on a 1.5% agarose gel to verify amplicon size and the presence of a single band. Primer pairs that produced a single amplicon were selected to perform qRT-PCR. Primer sequences used for qRT-PCR validation are given in Supp Table S2 (online only). KAPA SYBR FAST qPCR 2X master mix (KAPA Biosystems) was used to prepare a 1.25X master mix with ROX dye (Applied Biosystems, Foster City, CA) and 5 μM SYTO-9 green fluorescent dye. Master mix sufficient for all the amplification reactions and no template controls (NTC) was prepared (16 μl of the master mix per reaction) and pipetted to the designated wells of an ABI-FAST 96-well reaction plate. cDNA prepared from gut and salivary glands of L. lineolaris was diluted to a concentration of 10 ng/μl and 2 ul of the cDNA was added to each reaction well. Forward and reverse primers for each gene were mixed together in 5 mM Tris–HCl, pH 7.5 to yield a 2 μM solution of each primer of which 2 μl was added to each reaction to yield a final concentration of 0.4 μM in a 20 μl reaction volume. The wells designated for NTC reactions received 16 μl of the master mix 2 μl of a primer mix and 2μl of water. Triplicate reactions to amplify each digestive gene as well as α-tubulin and β-tubulin reference genes were set up for gut and salivary gland cDNA. qRT-PCR was run using an initial denaturing step at 98°C for 1 min followed by 40 cycles at 98°C for 5 s and 60°C for 30 s. At the end of cycling, a disassociation curve was generated for all the samples to determine the melting temperatures of the PCR products and to inspect the melt curves for deviations from the expected results. Data was exported to a spreadsheet and relative expression levels were calculated using ΔΔCT method (Livak and Schmittgen 2001). Mean of the expression levels of α- and β-tubulin was used to normalize expression levels across the tissues and the expression level of each digestive gene in salivary gland was calculated relative to the gut tissue.
Results
Identification of Putative Digestive Gene Transcripts
Annotation of the transcripts generated by Roche 454 transcriptome sequencing identified 259 putative digestive gene sequence contigs. Some of the sequence contigs were either 5′- or 3′-end truncated, while others were missing both ends. These sequences were made available to public by submitting to NCBI Sequence Read Archive (SRA) under the project number SRP005464 and the BioProject PRJNA64953.
Characterization of Putative Digestive Enzyme Transcripts
Sanger dideoxy sequencing of clones derived from 5′- and 3′-RACE products identified a total 87 digestive genes that included 30 polygalacturonases (PG), 1 β-galactosidase, 3 α-glucosidases, 6 β-glucosidases, 28 trypsin-like proteases, 3 serine proteases, 1 apyrase-like protease, 1 cysteine protease, 12 lipases, and 2 transcripts with low similarity to a xylanase A-like genes from Phaedon cochleariae (Pauchet and Heckel 2013). The transcript sequences were deposited in public databases under accession numbers KC702729.1 to KC702774.1, KF208689.1 to KF208739, KJ018765 to KJ018776, and KT587269 to KT587280. Transcripts of PG and trypsin-like genes that had nucleotide substitutions and differed by less than 5% amino acids were considered alleles and were labeled with a subscript (e.g., PG5a, PG5b etc.). Only one copy of each digestive gene with alleles was used in phylogenetic tree construction and expression profiling. A draft genome of L. lineolaris (Perera, unpublished, BioProject PRJNA685878) was searched with nucleotide sequences of the transcripts using BlastStation64-Local software (TM Software, Inc., Arcadia, CA) to verify that the transcripts identified were not contaminants. All 87 transcripts matched to a genomic scaffold, indicating that the transcripts were bona fide L. lineolaris sequences. Gene transcripts names, accession numbers, best BLAST hit protein sequence and species, E-value, and percent similarity are given in Supp Table S3 (online only). Digestive genes identified in previous studies are marked with an asterisk and the references are given in the footnotes. Analysis of proteins with Signal-P 5.0 (Nielsen et al. 1997, Almagro Armenteros et al. 2019) identified secretion signals in all L. lineolaris digestive proteins are identified here, except for α-glucosidase 1, β-glucosidases 2, 3, and 4, lipases 5, 7, and 8, trypsin-like protease 21, and serine protease 2. Trypsin-like protease 21 is a partial sequence truncated at the 5′-end and therefore, may be missing the secretion signal sequence. Other enzymes without the signal sequence may not be secreted and may be involved in intracellular processing of macromolecules.
Analysis of Evolutionary Relationships Among Sequences
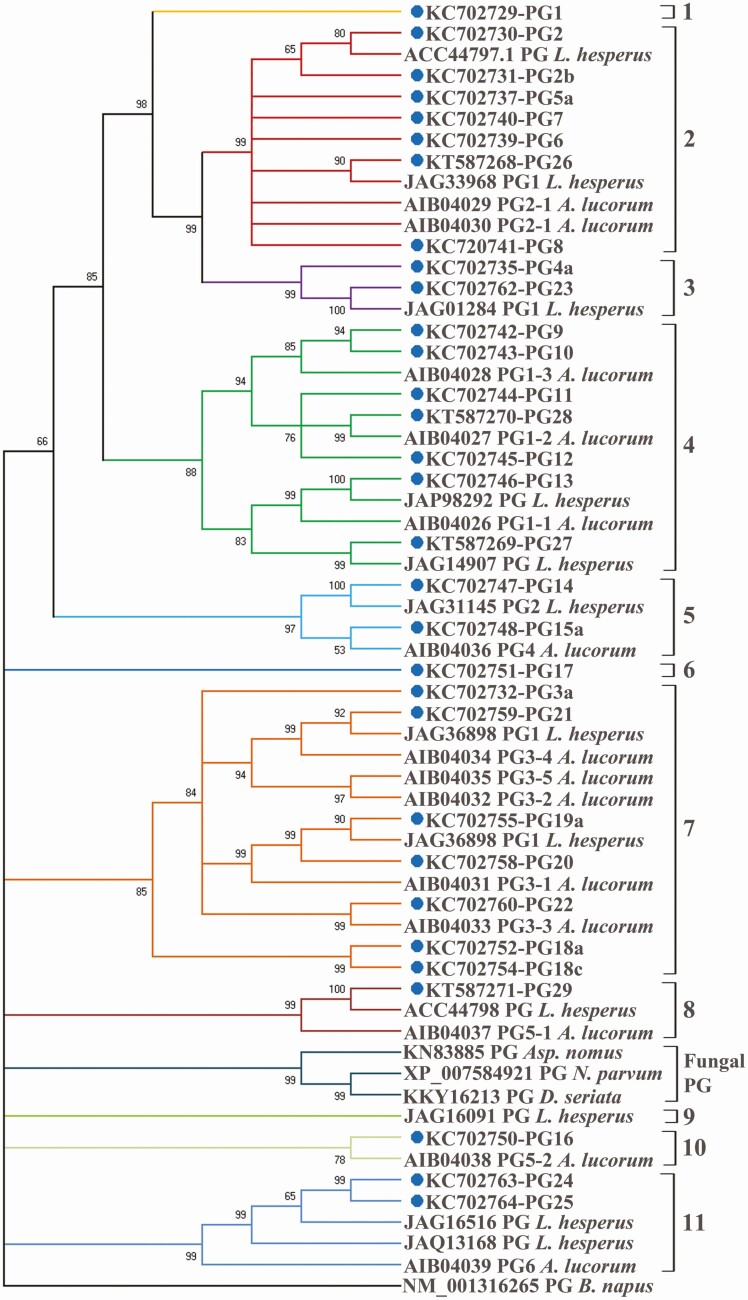
Evolutionary relationships among different digestive enzyme groups were constructed using NJ method implemented in MEGA X 10.0.5 package (Kumar et al. 2018) to assess the relationships between L. lineolaris digestive gene sequences and those identified from other arthropods. MEGA X 10.0.5 software identified the Jones-Taylor-Thornton model (Jones et al. 1992) with a discrete gamma distribution (JTT+G) as the best model for gene phylogeny reconstruction. Only one allele or variant of each digestive gene group was used in the phylogenetic analysis. Gene phylogeny trees generated for each class of digestive genes using the NJ method are shown in Figures 1–4. The NJ method uses genetic distance calculated from the number of differences between sequences to group similar sequences together regardless of the origin (i.e., whether homologous or orthologous). Therefore, we use the term “group” to refer to sequences that were clustered into a branch of a tree rather than using the term “clade” which refers to a lineage with common ancestry inferred using homologous characters. A gene phylogeny using a single copy (unigene) of each L. lineolaris PG variant group and PGs characterized in Lygus hesperus (Knight) and Apolygus lucorum (Hemiptera: Miridae) (Meyer-Dür) with Aspergillus nomus (Kurtzman, Horn & Hesseltine) (Eurotiales: Trichocomaceae), Neofusicoccum parvum (Pennycook & Samuels) (Dothideomycetes: Botryosphaeriaceae), and Diplodia seriata (De Not) (Botryosphaeriales: Botryosphaeriaceae) as the outgroup and Brassica napus (L.) (Brassicales: Brassicaceae) PGs at the root identified evolutionary relationships between L. lineolaris PGs and other mirid species (Fig. 1). Fungal and plant PGs were used in this analysis to evaluate if any of the PGs identified in L. lineolaris originated from food (broccoli) or microbial sources. In addition, PGs have not been identified in transcriptomes or genomes of any insect outside the family Miridae. Therefore, it is not possible to use a distantly related arthropod species other than plants or fungi, where PGs are ubiquitous, as outgroups.
Fig. 1.
Evolutionary relationships between putative polygalacturonase (PG) peptide sequences of Lygus lineolaris and those from other mirid species. Neighbor-joining evolutionary tree generated using Mega 10.0.05 program included PG polypeptide sequences of Lygus hesperus and Apolygus lucorum along with the PG genes from fungal species Aspergillus nomus, Neofusicoccum parvum, and Diplodia seriata as the outgroup. A PG sequence from Brassica napa was used to root the evolutionary tree. PG transcripts identified in this study are marked with a blue dot. Branch colors indicate the PGs grouped together due to high sequence similarity.
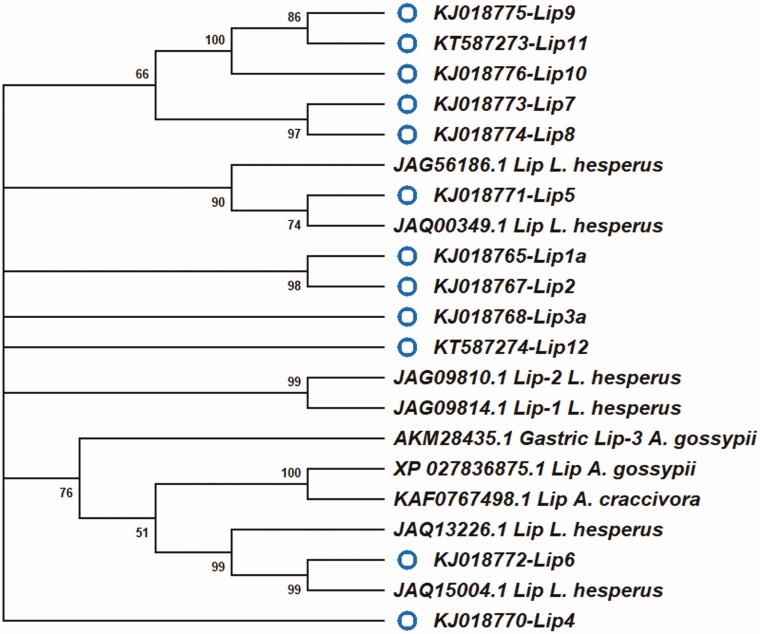
Fig. 4.
Evolutionary relationships between putative lipase peptide sequences of Lygus lineolaris and those from other mirid species and those from other insect species. Neighbor-joining tree generated using Mega 10.0.05 program included various lipase gene sequences available in public databases from the following species: Acromyrmex echinatior, Acyrthosyphon pisum, Aedes aegypti, Athalia rosae, Bombyx mori, Camponotus floridanus, Habropoda laboriosa, Halyomorpha halys, Harpegnathos saltator, Lygus hesperus, Monomorium pharaonis, Nasonia vitripennis, and Ooceraea biroi. A Lipase sequence from Daphnia pulex was used as the out group. Processing gene transcripts identified in this study are marked with a blue open circle.
Based on NJ trees derived in this study, PG genes could be classified into a total of 11 groups with seven groups containing two or more PGs and four singleton PGs (PG1, PG16, PG17, and PG29) that are different from each other and the PGs in the five multi-gene groups (groups 2, 3, 4,5, and 7; Fig. 1). All L. lineolaris PGs characterized in this study, except for PGs 1 through 4 (Allen 2007, Allen and Mertens 2008, Walker and Allen 2010), were novel gene sequences that have not been previously reported in this species. Fourteen PGs characterized in this study (PGs 5–12, 17, 18, 20, 24, and 25) and their alleles did not have any closely related PG in other mirid species. Lygus lineolaris PGs 13, 14, 19, 21, 23, 26, 27, and 29 had distantly related counterparts in L. hesperus. Remaining PGs had distantly related sequences in the mirid A. lucorum.
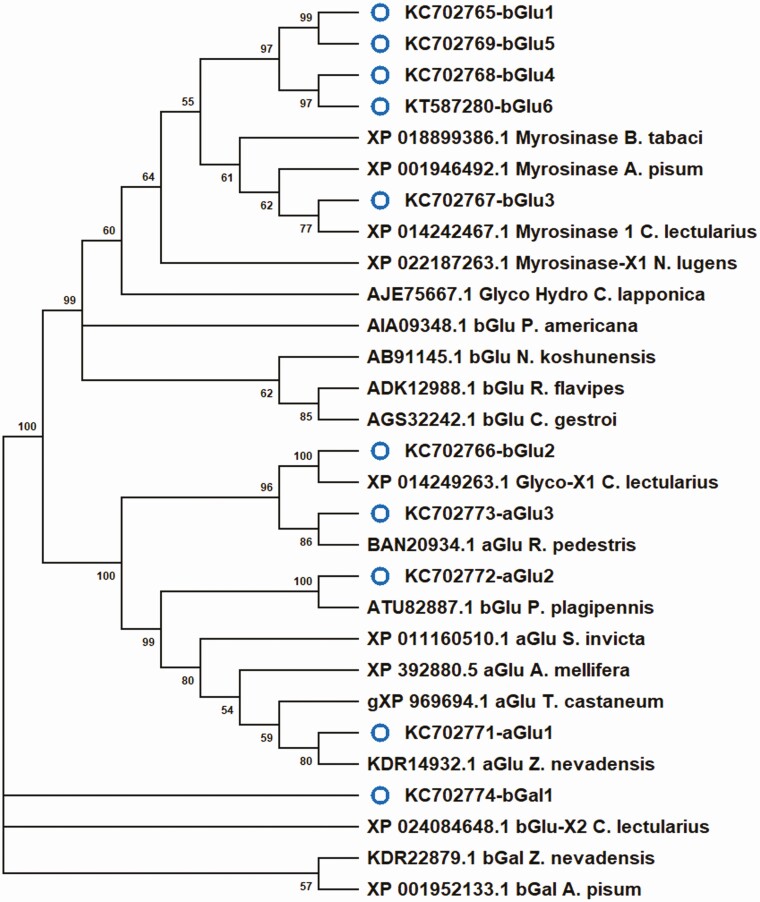
Carbohydrate processing enzymes identified from L. lineolaris in this study had distantly related sequences to other hemipteran species such as Bemisia tabaci (Gennadius) (Hemiptera: Aleyrodidae), Cimex lectularis L. (Hemiptera: Cimicidae), Nilaparvata lugens (Stål) (Hemiptera: Delphacidae), Pristhesancus plagipennis Walker (Hemiptera: Reduviidae), and Riptortus pedestris (F.) (Hemiptera: Alydidae) with amino acid sequence identities ranging from 42.5 to 74.3. Gene phylogeny indicated that β-glucosidase 3 and β-galactosidase 1 identified in L. lineolaris were distantly related to those from the pea aphid, Acyrthosiphon pisum (Fig. 2). Therefore, all carbohydrate processing genes identified in L. lineolaris can be considered as novel gene transcripts. Two transcripts that had low similarities to Phaedon cochleariae xylanase (Accession: XYN_PHACE; EC 3.2.1.8) did not match any sequences in the databases, and therefore, evolutionary relationship analysis was not possible.
Fig. 2.
Evolutionary relationships between putative glucosidase peptide sequences of Lygus lineolaris and those from other insect species available in public databases. Neighbor-joining tree generated using Mega 10.0.05 program included various carbohydrate processing gene sequences from Acyrthosyphon pisum, Apis mellifera, Bemisia tabaci, Cimex lectularius, Creontiades dilutes, Chrysomela lapponica, Neotermis koshunensis, Nilaparvata lugens, Pristhesancus plagipennis, Periplenata americana, Riptorus pedestris, Solenopsis invicta, Tribolium castaneum, and Zootermis nevadensis. Carbohydrate processing gene transcripts identified in this study are marked with a blue open circle.
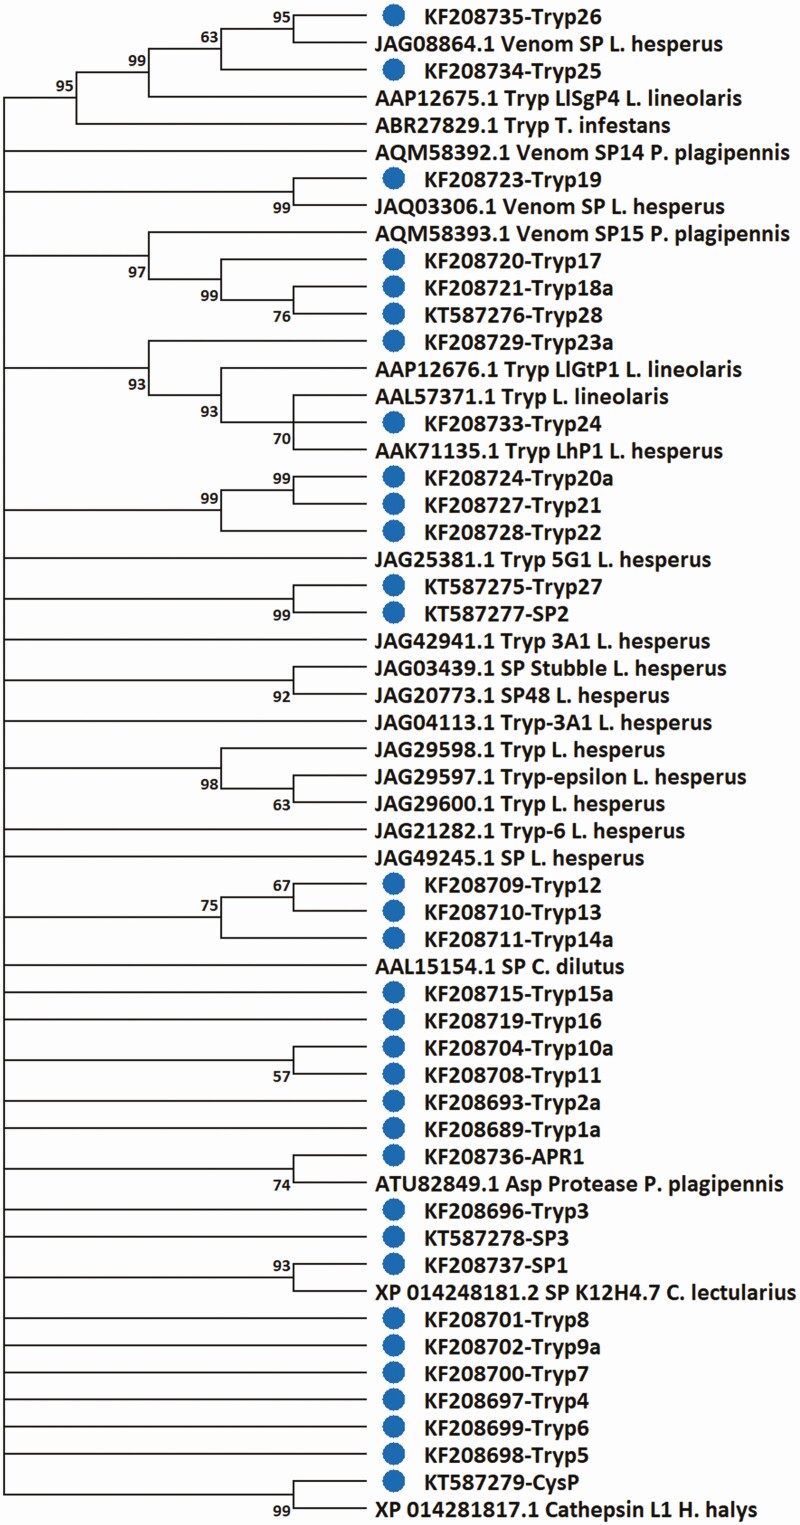
Proteases characterized in L. lineolaris included 28 serine proteases, one apyrase-like aspartyl protease, and one cathepsin-like cysteine protease. BLAST searches of the NCBI databases identified some related proteases from L. lineolaris and L. hesperus (81.4 to 99.2 identity) and other hemipteran species with similarities ranging from 31.3 to 84.1 (Supp Table S3 [online only]-BLAST hits). Gene phylogeny analysis of the L. lineolaris proteases revealed the diverse lineages of the protease repertoire in this insect. For example, L. lineolaris trypsin-like proteases 23, 24, 25, and 26, and the cysteine protease were the only members that had similar proteases with >90% amino acid identity in a mirid species (e.g., L. lineolaris, L. hesperus, Adelphocoris suturalis). Trypsin-like proteases 17, 18, and 28, serine protease SP1 and aspartyl protease APR1 had distantly related proteins in other hemipteran species. The remaining proteases formed distinct branches that indicated that most proteases identified from L. lineolaris in this study were unique and novel sequences (Supp Table S3 [online only] and Fig. 3).
Fig. 3.
Evolutionary relationships between putative protease peptide sequences of Lygus lineolaris and those from other hemipteran species. Neighbor-joining tree generated using Mega 10.0.05 program included various protease gene sequences available in public databases from the following species: Cimex lectularius, Creontiades dilutes, Halyomorpha halys, Lygus lineolaris, Lygus hesperus, Pristhesancus plagipennis. A trypsin sequence from Heliothis virescens was used as the out group. Protease gene transcripts identified in this study are marked with a blue dot.
We identified 12 lipases in L. lineolaris that had only 39.7 to 58.9% sequence identities with the best matching lipases in BLAST searches. Evolutionary relationship analysis indicated that lipases 5 and 6 were related to lipases from L. hesperus found in the databases with amino acid identities between them ranging from 98.0 to 79.0%, respectively (Fig. 4).
Digestive Gene Expression in Salivary Glands and Gut
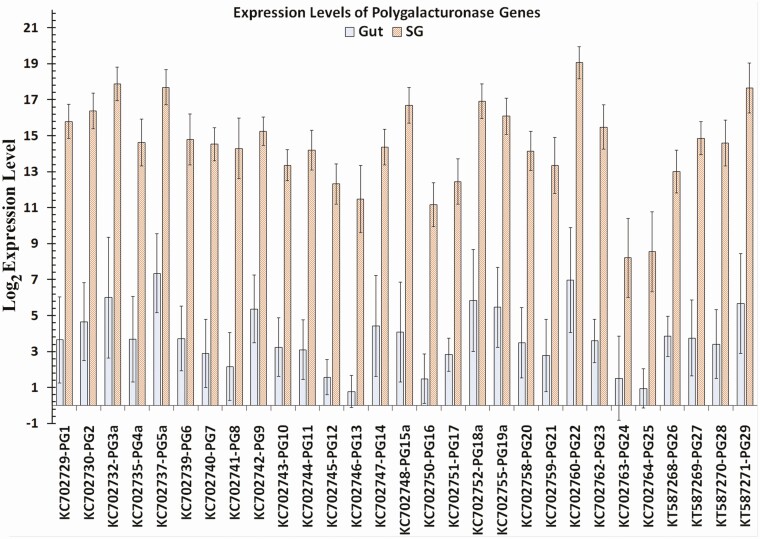
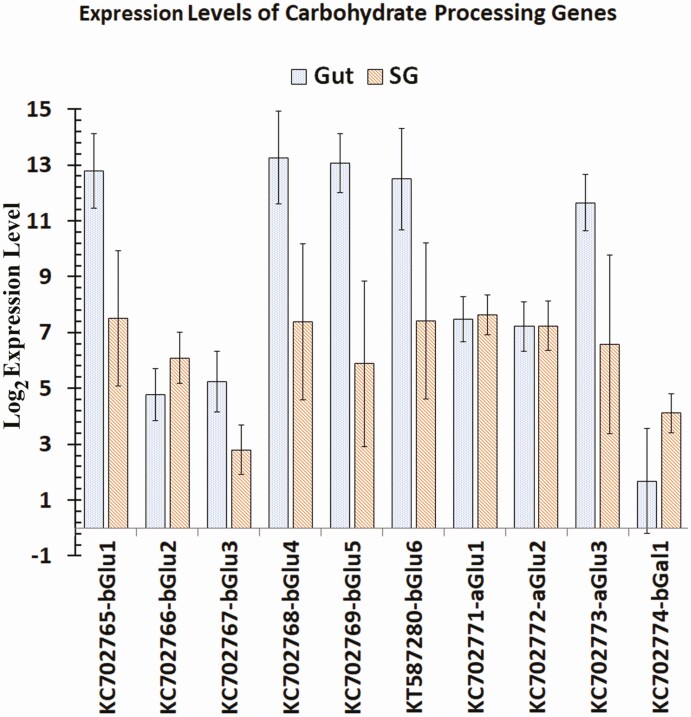
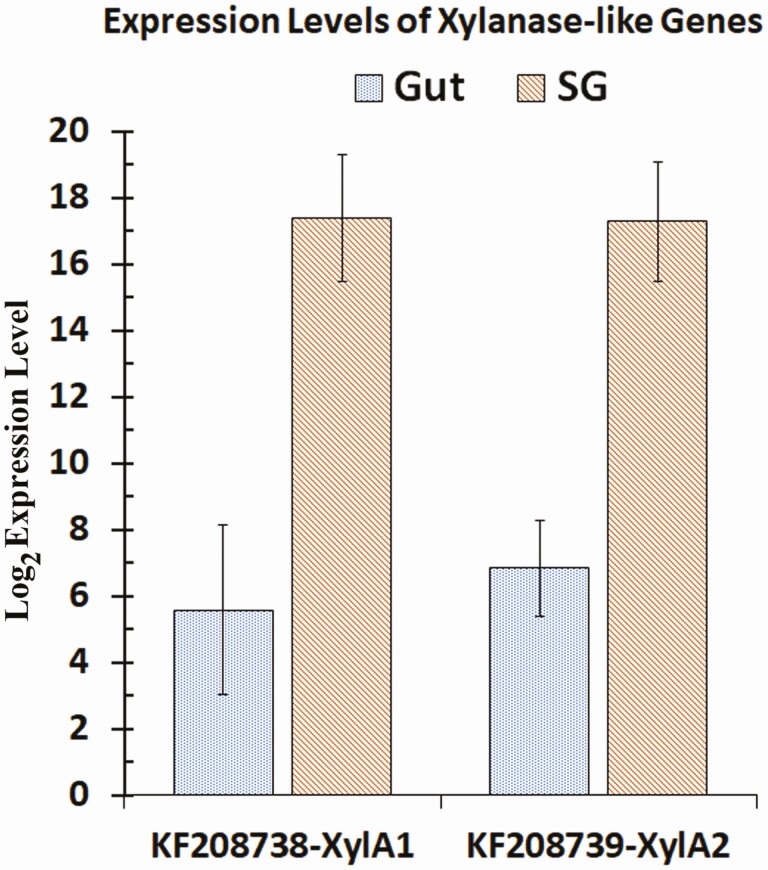
All Illumina short reads obtained from gut and salivary gland were submitted to the NCBI short read archive (SRA) under the project number PRJNA695862. Read numbers obtained in replicate samples for each tissue, total read number, and the total nucleotide count are given in Supp Table S4 (online only). Gene expression profiles, fold expression levels, and total RNA-Seq raw reads from salivary glands and gut of L. lineolaris mapped to each digestive gene using RNA-Seq data from male and female separately and pooled by tissue are given in the Supp Tables S4 and S5 (online only), respectively. Comparisons of expression levels in gut and salivary gland between sexes did not identify significant differences between any of the digestive genes at P < 0.01. However, at P < 0.05 female gut showed significantly higher expression levels of PG5, PG9, PG19, PG23, PG27, and Trypsin 11 transcripts (Supp Table 5 [online only]). All the PG transcripts and most protease transcripts, including Trypsin 11 had very low expression levels in the gut (Supp Table 6 [online only]). Examination of raw reads counts indicated that these differences could be the results of variation in low read numbers (6 to 657 reads) from gut of males and females mapped to the transcripts. Normalized RNA-Seq expression profiles of data pooled by the tissue type revealed almost exclusive expression of PG genes in salivary glands compared to the gut (Supp Table S6 [online only] and Fig. 5). Examination of total read counts revealed that gut tissues had extremely small raw read counts for PG genes compared to salivary gland tissues. In contrast, β-glucosidases 1, 4, 5, and 6, and α- glucosidase 3 were highly expressed in the gut tissues compared to salivary glands (Fig. 6). The only β-galactosidase identified in this study had negligible expression levels in both tissues with only 47 and 35 total raw reads mapped to the transcript in the gut and salivary glands, respectively. The α-glucosidases 1 and 2 had similar but moderate expression levels in both tissues. Compared to the gut, expression levels of the two xylanase-like transcripts in the salivary glands were very high (log2 expression levels of 15.9 to 16.0) with relative expression levels ranging from 1,394 to 3,807-fold (P < 0.01; Fig. 7; Supp Table 6 [online only]). Peptide sequences of both xylanase-like genes had signal peptides (Supp Table 7 [online only]), indicating that these proteins are secreted with saliva. However, it is difficult to discern the role of these proteins without conducting functional studies.
Fig. 5.
Log base 2 expression levels of polygalacturonase gene transcripts in the gut and salivary glands of Lygus lineolaris generated from RNA-Seq reads mapped to the transcripts. Standard deviation for each expression level is shown.
Fig. 6.
Log base 2 expression levels of carbohydrate processing gene transcripts in the gut and salivary glands of Lygus lineolaris generated from RNA-Seq reads mapped to the transcripts. Standard deviation for each expression level is shown.
Fig. 7.
Log base 2 expression levels of xylanase-like gene transcripts in the gut and salivary glands of Lygus lineolaris generated from RNA-Seq reads mapped to the transcripts. Standard deviation for each expression level is shown.
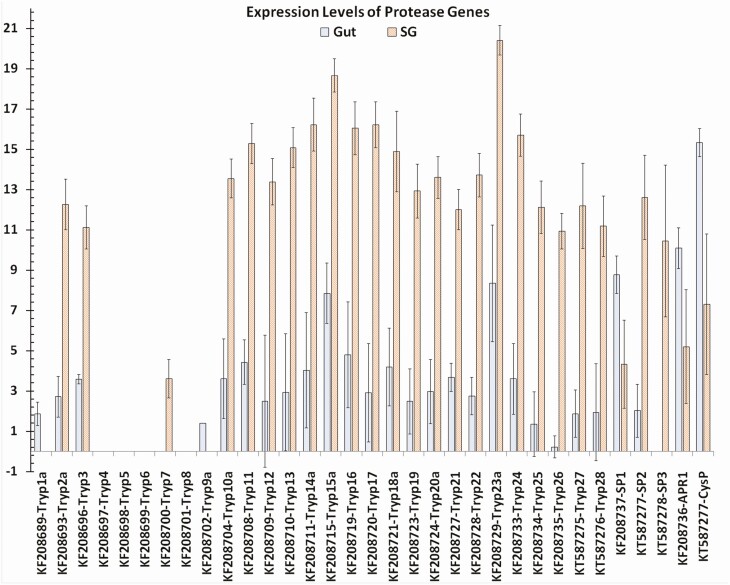
Trypsin-like proteases 1 and 4 to 9 had negligible or no expression in either organ, while serine protease 1 and aspartyl protease 1 had moderately higher expression levels in the gut. Cathepsin-like cysteine protease, which is a nonsecreted enzyme involved in intracellular protein processing, had 246-fold higher expression levels in the gut. All other proteases had 56- (Trypsin-like protease 3) to 10,876-fold (Trypsin-like protease 17) higher expression levels in the salivary glands compared to gut tissues indicating that these enzymes are used for extra-cellular digestion of plant proteins (Supp Table S6 [online only] and Fig. 8).
Fig. 8.
Log base 2 expression levels of protease gene transcripts in the gut and salivary glands of Lygus lineolaris generated from RNA-Seq reads mapped to the transcripts. Standard deviation for each expression level is shown.
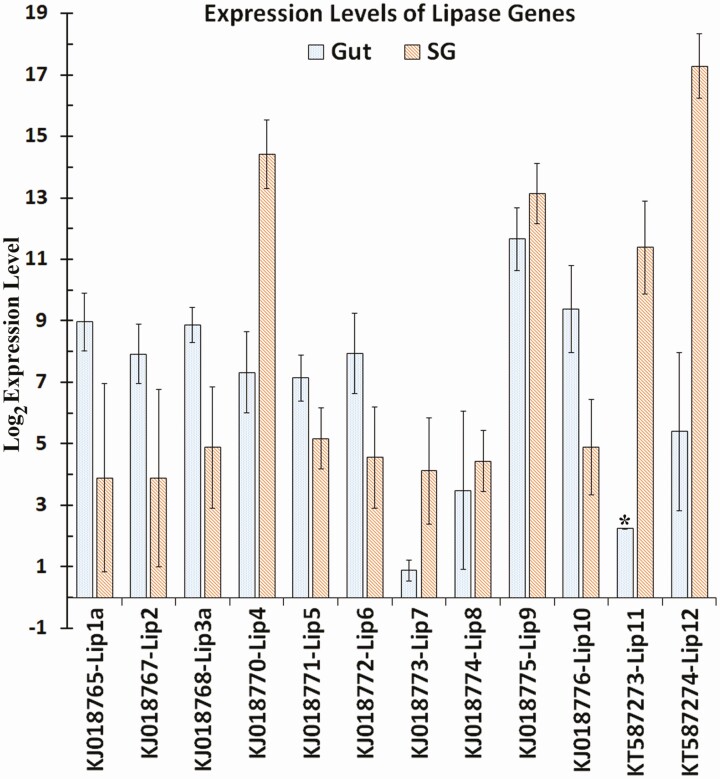
Lipases 4, 11, and 12 were highly expressed in salivary glands with 148-, 752-, and 4509-fold expression differences, respectively, where lipase 12 had the highest raw read count among all lipases at 289,414 reads. Lipases 1, 3, 5, 6, and 10 had higher expression levels in the gut, but normalized log expression levels only ranged from 5.69 to 7.87 (Supp Table 6 [online only]). Although the normalized log expression level of lipase 2 in the gut was 6. 468 ± 0.912 with a total read count of 579, the expression difference was not significant due to high variability of the read count in salivary gland samples that had a total of 6 reads mapped to lipase 2. Lipases 7 and 8 had low expression in both tissues and lipase 9 had high expression levels of 10.06 and 11.59 in the gut and salivary glands (2.88-fold difference), respectively (Supp Table S6 [online only] and Fig. 9).
Fig. 9.
Log base 2 expression levels of lipid processing gene transcripts in the gut and salivary glands of Lygus lineolaris generated from RNA-Seq reads mapped to the transcripts. Standard deviation for each expression level is shown.
Fold expression levels and their confidence intervals (Jung et al. 2011) of polygalacturonases 1, 11, 14, and 29, β-glucosidases 1, 3, and 4, trypsins 2 and 23, and xylanase-like gene 1 in the salivary gland of L. lineolaris relative to gut obtained from RNA-Seq and qRT-PCR experiments are shown in Supp Table S8 (online only). Although the relative expression levels calculated in qRT-PCR experiments were generally higher than those obtained from RNA-Seq experiments, the trends were similar where both experimental methods showing similar expression patterns. The differences in actual fold expression levels could be attributed to the differences in sensitivity to extrinsic factors between two techniques. RNA-Seq data are affected by cDNA synthesis, library construction and fractionation, and sequencing conditions. qRT-PCR amplifications are highly sensitive to multiple factors, including PCR conditions, DNA polymerase, and differences in amplification efficiency in primers used for target and reference gene amplification. While data from RNA-Seq experiments can be normalized using more than one method (e.g., RPKM, global mean, gene calibration) to limit variation due to experimental conditions, normalization of qRT-PCR experiments often limited to reference genes or standards. Therefore, RNA-Seq experiments may generally provide more accurate representation of actual expression patterns in the tissue. The purpose of qRT-PCR experiments in this work was to cross check the expression patterns revealed by RNA-Seq experiments and similar trends of gene expression exhibited by both techniques corroborate the expression patterns reported for digestive genes.
Discussion
Polyphagous piercing/sucking insects such as Lygus face challenges associated with fast in situ extra oral digestion of host tissue with enzymes secreted to the probe site with saliva. High levels of expression detected for PG and protease genes in the salivary gland of this insect indicate that these enzymes play a critical role in fast conversion of host plant tissue into a liquid that the insect must ingest through a narrow channel in the stylus. To successfully perform this task, polyphagous piercing and sucking insects require a diverse array of digestive enzymes that can break down a wide range of macromolecules efficiently and overcome enzyme inhibitors produced by plants.
The diversity of enzymes, especially the secreted PG and protease genes expressed in the salivary glands of L. lineolaris provide evidence for adaptability of this insect to feed on a large array of host plants. Many host plants have inhibitors of insect digestive enzymes (Albersheim and Anderson 1971, De Lorenzo and Ferrari 2002, D’Ovidio et al. 2004, Zhu-Salzman et al. 2005, Zhu-Salzman and Zeng 2015, Grosse-Holz and van der Hoorn 2016). As a piercing and sucking insect that injects saliva into plants for in situ digestion of plant tissues, L. lineolaris must possess a repertoire of digestive enzymes that could resist inhibition by plant originated inhibitors. In addition, plants may produce a diverse array of pectins or different plants may produce different types of pectins. Because these branched carbohydrates contain many different chemical structures and bonds, it is advantageous for a polyphagous insect to have a diverse array of enzymes that can break any combination of pectin chemical bonds encountered. High expression levels of all PGs, most proteases, and two xylanase-like genes in the salivary glands indicate that this insect has evolved a means to release a battery of diverse enzymes at probing sites to digest cell walls and to release the content of the cytoplasm. The proteases in the saliva process the plant cellular proteins at probing sites prior to ingestion and may continue protein digestion in the gut. The serine protease 1 and aspartic protease differentially expressed in the gut may aid in further processing of partially digested peptides. Differential expression of carbohydrate and lipid processing enzymes in the gut indicates that complex carbohydrates and lipids released by collapsed cells are ingested and processed in the gut. Since the insects used in this study were fed on broccoli prior to dissection of salivary glands and guts, it is not clear if the differential expression of digestive enzymes is in response to the content in the broccoli or if insects could modulate expression levels of these enzymes when feeding on different host plants. For example, it is possible that the seven trypsin-like proteases that were not expressed in either gut or salivary glands may be produced if the insects were fed on a different food source. In addition, it is possible that expression profiles of these digestive enzymes observed in adults could be different in nymphal instars.
In the present study, we characterized the repertoire of macromolecule processing enzymes identified from L. lineolaris transcriptomes assembled using high-throughput sequencing. PCR amplification with specific primers, cloning, and manual curation of the nucleotide sequences of putative digestive enzymes not only facilitated identification of many macromolecule processing enzymes, but also accurate characterization of the nucleotide sequences and alleles in this species. Fourteen unique PGs identified in Apolygus lucorum was the highest number of PGs previously reported in an insect (Zhang et al. 2015). Showmaker et al. (2016) previously described 17 putative PGs using an uncurated shotgun assembly of L. lineolaris salivary gland transcriptome, but only 4 new PGs were characterized in that study. In the present study we characterized 25 novel unique PGs in L. lineolaris. A total of five trypsin precursors that included three unique proteins and two alleles have been previously reported (Zhu et al. 2003). Of the 28 unique proteases characterized in this study, two had high sequence similarities to previously reported sequences, and therefore, 26 were novel proteases. In L. hesperus, 39 trypsin-like proteases have been reported (Zeng et al. 2002, Hull et al. 2014, Tassone et al. 2016). However, most of these enzymes were highly similar alleles of approximately eight different enzymes and the most closely related sequences were L. hesperus protease JAG08864.1 and L. lineolaris trypsin 26 at 95% amino acid identity. Similarly, most lipid and carbohydrate processing genes identified in this study were novel sequences.
This initial study of enzymes necessary for successful L. lineolaris feeding on multiple host plant species focused on the expression in the salivary glands and gut tissues. Hemipterans like L. lineolaris are thought to employ a “macerate-and-flush“ feeding strategy (Backus et al. 2005). Following stylet probing the insect establishes a feeding site by puncturing the plant. Multiple cycles of salivary injection, stylet maceration, and enzymatic treatment rupture the plant cells, whose contents are then ingested for further processing (Backus et al. 2007). Several classes of enzymes are needed to sequentially digest plant cells in situ, then to draw polymeric fragments from the feeding site into the gut for further digestion and absorption. These include the PGs, proteases, and xylanase-like enzymes produced primarily by the salivary glands and injected into the feeding site, which initially erode plant walls exposing their cellular contents to extraction and further digestion by glucosidases, proteases, and lipases in the gut. Some caution in interpreting our results is warranted as only a single food source, broccoli, adult males and females, and a single time point was examined in this study. However, it is likely the insects adjust expression patterns across feeding intervals to effectively exploit differences between host plant developmental stages, feeding sites, and between host plant species. Nymphal stages with smaller stylets and salivary glands may need to adjust feeding strategies. Heavily defended host plants such as cotton also rapidly respond to insect feeding by mobilizing several defenses that must also be monitored and circumvented by the insect across the feeding interval to successfully extract nutrients. The present study is a narrow window viewing only some of the contending plant/insect dynamics that occur. These findings, in conjunction with others (Showmaker et al. 2016, Hull et al. 2020), will enable detailed studies of the complex gene regulatory events that govern host choice and feeding dynamics. A better understanding of these issues may help to provide insights useful for pest management.
Supplementary Material
Acknowledgments
We thank Priya Chatakondi (USDA-ARS SIMRU) for technical support provided in insect rearing and Fanny Liu and Mary Duke of USDA-ARS Genomics and Bioinformatics Research Unit, Stoneville, MS for Sanger sequencing and Illumina sequencing (RNA-Seq), respectively. This work was partially supported by Cotton, Inc. grant 08-471 to O.P.P. We also thank Drs. Clint Allen (USDA-ARS SIMRU) and Siva Jakka (Valent USA, Stoneville, MS.) for critically reading an earlier version of this article.
Disclaimer: Mention of trade names or commercial products in this article is solely for the purpose of providing specific information and does not imply recommendation or endorsement by the U.S. Department of Agriculture. USDA is an equal opportunity provider and employer.
Author Contributions
OPP: Conceptualization, investigation, data curation, formal analysis, funding acquisition, writing original draft, review, and editing. KSS: Conceptualization, writing: review an editing. CAP: Investigation, writing: review and editing. GLS: Conceptualization, writing: review an editing.
References Cited
- Albersheim, P., and Anderson A. J.. . 1971. Proteins from plant cell walls inhibit polygalacturonases secreted by plant pathogens. Proc. Natl. Acad. Sci. U. S. A. 68: 1815–1819. [DOI] [PMC free article] [PubMed] [Google Scholar]
- Allen, M. L. 2007. Expressed sequenced tags from Lygus lineolaris (Hemiptera: Miridae), the tarnished plant bug. Genet. Mol. Res. 6: 206–213. [PubMed] [Google Scholar]
- Allen, M. L., and Mertens J. A.. . 2008. Molecular cloning and expression of three polygalacturonase cDNAs from the tarnished plant bug, Lygus lineolaris. J. Insect Sci. 8: 1–14. [DOI] [PMC free article] [PubMed] [Google Scholar]
- Allen, M. L., and W. B.Walker, 3rd. 2012. Saliva of Lygus lineolaris digests double stranded ribonucleic acids. J. Insect Physiol. 58: 391–396. [DOI] [PubMed] [Google Scholar]
- Almagro Armenteros, J. J., Tsirigos K. D., Sønderby C. K., Petersen T. N., Winther O., Brunak S., von Heijne G., and Nielsen H.. . 2019. SignalP 5.0 improves signal peptide predictions using deep neural networks. Nat. Biotechnol. 37: 420–423. [DOI] [PubMed] [Google Scholar]
- Amiri, A., Bandani A. R., and Alizadeh H.. . 2016. Molecular identification of Cysteine and Trypsin Protease, effect of different hosts on Protease expression, and RNAi mediated silencing of Cysteine Protease Gene in the Sunn Pest. Arch. Insect Biochem. Physiol. 91: 189–209. [DOI] [PubMed] [Google Scholar]
- Backus, E. A., Serrano M. S., and Ranger C. M.. . 2005. Mechanisms of hopper-burn: an overview of insect taxonomy, behavior, and physiology. Annu. Rev. Entomol. 50: 125–151. [DOI] [PubMed] [Google Scholar]
- Backus, E. A., Cline A. R., Serrano M. S., and Ellersieck M. R.. . 2007. Lygus hesperus (Knight) Hemiptera: Miridae) feeding on cotton: new methods and parameters for analysis of non-sequential EPG data. Ann. Entomol. Soc. Am. 100: 296–310. [Google Scholar]
- Benoit, J. B., Attardo G. M., Michalkova V., Krause T. B., Bohova J., Zhang Q., Baumann A. A., Mireji P. O., Takáč P., Denlinger D. L., . et al. 2014. A novel highly divergent protein family identified from a viviparous insect by RNA-seq analysis: a potential target for tsetse fly-specific abortifacients. PLoS Genet. 10: e1003874. [DOI] [PMC free article] [PubMed] [Google Scholar]
- Chougule, N. P., Giri A. P., Sainani M. N., and Gupta V. S.. . 2005. Gene expression patterns of Helicoverpa armigera gut proteases. Insect Biochem. Mol. Biol. 35: 355–367. [DOI] [PubMed] [Google Scholar]
- D’Ovidio, R., Mattei B., Roberti S., and Bellincampi D.. . 2004. Polygalacturonases, polygalacturonase-inhibiting proteins and pectic oligomers in plant–pathogen interactions. BBA Proteins and Proteom. 1696: 237–244. [DOI] [PubMed] [Google Scholar]
- Dara, S. K., Peck D., and Murray D.. . 2018. Chemical and non-chemical options for managing twospotted spider mite, western tarnished plant bug and other arthropod pests in strawberries. Insects 9: 156. [DOI] [PMC free article] [PubMed] [Google Scholar]
- De Lorenzo, G., and Ferrari S.. . 2002. Polygalacturonase-inhibiting proteins in defense against phytopathogenic fungi. Curr. Opin. Plant Biol. 5: 295–299. [DOI] [PubMed] [Google Scholar]
- Edgar, R. C. 2004. MUSCLE: multiple sequence alignment with high accuracy and high throughput. Nucleic Acids Res. 32: 1792–1797. [DOI] [PMC free article] [PubMed] [Google Scholar]
- Grosse-Holz, F. M., and van der Hoorn R. A.. . 2016. Juggling jobs: roles and mechanisms of multifunctional protease inhibitors in plants. New Phytol. 210: 794–807. [DOI] [PubMed] [Google Scholar]
- Halon, E., Eakteiman G., Moshitzky P., Elbaz M., Alon M., Pavlidi N., Vontas J., and Morin S.. . 2015. Only a minority of broad-range detoxification genes respond to a variety of phytotoxins in generalist Bemisia tabaci species. Sci. Rep. 5: 17975. [DOI] [PMC free article] [PubMed] [Google Scholar]
- Handley, D. T., and Pollard J. E.. . 1993. Microscopic examination of tarnished plant bug (Heteroptera: Miridae) feeding damage to strawberry. J. Econ. Entomol. 86: 505–510. [Google Scholar]
- Huang, L., Cheng T., Xu P., Cheng D., Fang T., and Xia Q.. . 2009. A genome-wide survey for host response of silkworm, Bombyx mori during pathogen Bacillus bombyseptieus infection. PLoS One 4: e8098. [DOI] [PMC free article] [PubMed] [Google Scholar]
- Hull, J. J., Geib S. M., Fabrick J. A., and Brent C. S.. . 2013. Sequencing and de novo assembly of the western tarnished plant bug (Lygus hesperus) transcriptome. PLoS One 8: e55105. [DOI] [PMC free article] [PubMed] [Google Scholar]
- Hull, J. J., Chaney K., Geib S. M., Fabrick J. A., Brent C. S., Walsh D., and Lavine L. C.. . 2014. Transcriptome-based identification of ABC transporters in the western tarnished plant bug Lygus hesperus. PLoS One 9: e113046. [DOI] [PMC free article] [PubMed] [Google Scholar]
- Hull, J. J., Perera O. P., and Wang M. X.. . 2020. Molecular cloning and comparative analysis of transcripts encoding chemosensory proteins from two plant bugs, Lygus lineolaris and Lygus hesperus. Insect Sci. 27: 404–424. [DOI] [PubMed] [Google Scholar]
- Jones, D. T., Taylor W. R., and Thornton J. M.. . 1992. The rapid generation of mutation data matrices from protein sequences. Comput. Appl. Biosci. 8: 275–282. [DOI] [PubMed] [Google Scholar]
- Josephrajkumar, A., Chakrabarty R., and Thomas G.. . 2006. Midgut proteases of the cardamom shoot and capsule borer Conogethes punctiferalis (Lepidoptera: Pyralidae) and their interaction with aprotinin. Bull. Entomol. Res. 96: 91–98. [DOI] [PubMed] [Google Scholar]
- Jung, K., Friede T., and Beissbarth T.. . 2011. Reporting FDR analogous confidence intervals for the log fold change of differentially expressed genes. BMC Bioinf. 12: 288. [DOI] [PMC free article] [PubMed] [Google Scholar]
- Kumar, S., Stecher G., Li M., Knyaz C., and Tamura K.. . 2018. MEGA X: molecular evolutionary genetics analysis across computing platforms. Mol. Biol. Evol. 35: 1547–1549. [DOI] [PMC free article] [PubMed] [Google Scholar]
- Letunic, I., Doerks T., and Bork P.. . 2012. SMART 7: recent updates to the protein domain annotation resource. Nucl. Acids Res. 40: D302–D305. [DOI] [PMC free article] [PubMed] [Google Scholar]
- Li, H., Zhang H., Guan R., and Miao X.. . 2013. Identification of differential expression genes associated with host selection and adaptation between two sibling insect species by transcriptional profile analysis. BMC Genomics 14: 582. [DOI] [PMC free article] [PubMed] [Google Scholar]
- Livak, K. J., and Schmittgen T. D.. . 2001. Analysis of relative gene expression data using real-time quantitative PCR and the 2(-Delta Delta C(T)) Method. Methods. 25: 402–408. [DOI] [PubMed] [Google Scholar]
- Lü, J., Yang C., Zhang Y., and Pan H.. . 2018. Selection of reference genes for the normalization of RT-qPCR data in gene expression studies in insects: a systematic review. Front. Physiol. 9: 1560. [DOI] [PMC free article] [PubMed] [Google Scholar]
- Magalhaes, L. C., van Kretschmar J. B., Donohue K. V., and Roe M.. . 2013. Pyrosequencing of the adult tarnished plant bug, Lygus lineolaris, and characterization of messages important in metabolism and development. Entomol. Exp. App. 146: 364–378. [Google Scholar]
- Mason, C. J., Long D. C., Lindroth R. L., and Hoover K.. . 2019. Divergent host plant utilization by adults and offspring is related to intra-plant variation in chemical defenses. J. Animal Ecol. 88: 1789–1798. [DOI] [PubMed] [Google Scholar]
- Nielsen, H., Engelbrecht J., Brunak S., and von Heijne G.. . 1997. Identification of prokaryotic and eukaryotic signal peptides and prediction of their cleavage sites. Protein Eng. 10: 1–6. [DOI] [PubMed] [Google Scholar]
- Pauchet, Y., and Heckel D. G.. . 2013. The genome of the mustard leaf beetle encodes two active xylanases originally acquired from bacteria through horizontal gene transfer. Proc. Biol. Sci. 280: 20131021. [DOI] [PMC free article] [PubMed] [Google Scholar]
- Petersen, T. N., Brunak S., von Heijne G., and Nielsen H.. . 2011. SignalP 4.0: discriminating signal peptides from transmembrane regions. Nat. Methods 8: 785–786. [DOI] [PubMed] [Google Scholar]
- Pinheiro, P. V., Ghanim M., Alexander M., Rebelo A. R., Santos R. S., Orsburn B. C., Gray S., and Cilia M.. . 2017. Host plants indirectly influence plant virus transmission by altering gut cysteine protease activity of aphid vectors. Mol Cell Proteomics 16: S230–S243. [DOI] [PMC free article] [PubMed] [Google Scholar]
- Rhainds, M., and English-Loeb G.. . 2003. Variation in abundance and feeding impact of tarnished plant bug (Hemiptera: Miridae) for different cultivars of strawberry: role of flowering phenology and yield attributes. J. Econ. Entomol. 96: 433–440. [DOI] [PubMed] [Google Scholar]
- Rodrigues, T. B., Barros Rodrigues T., Khajuria C., Wang H., Matz N., Cunha Cardoso D., Valicente F. H., Zhou X., and Siegfried B.. . 2014. Validation of reference housekeeping genes for gene expression studies in western corn rootworm (Diabrotica virgifera virgifera). PLoS One 9: e109825. [DOI] [PMC free article] [PubMed] [Google Scholar]
- Schwartz, T. S., Tae H., Yang Y., Mockaitis K., Van Hemert J. L., Proulx S. R., Choi J. H., and Bronikowski A. M.. . 2010. A garter snake transcriptome: pyrosequencing, de novo assembly, and sex-specific differences. BMC Genomics 11: 694. [DOI] [PMC free article] [PubMed] [Google Scholar]
- Scott, D. 1977. An annotated listing of host plants of Lygus hesperus Knight. Bull. Entomol. Soc. Am. 23: 19–22. [Google Scholar]
- Shackel, K. A., de la Paz Celorio-Mancera M., Ahmadi H., Greve L. C., Teuber L. R., Backus E. A., and Labavitch J. M.. . 2005. Micro-injection of Lygus salivary gland proteins to simulate feeding damage in alfalfa and cotton flowers. Arch. Insect Biochem. Physiol. 58: 69–83. [DOI] [PubMed] [Google Scholar]
- Shelby, K. S., Perera O. P., and Snodgrass G. L.. . 2015. Expression profiles of astakine-like transcripts in the tarnished plant bug, Lygus lineolaris, exposed to fungal spores of Beauveria bassiana. Insect Mol. Biol. 24: 480–490. [DOI] [PubMed] [Google Scholar]
- Showmaker, K. C., Bednářová A., Gresham C., Hsu C. Y., Peterson D. G., and Krishnan N.. . 2016. Insight into the salivary gland transcriptome of Lygus lineolaris (Palisot de Beauvois). PLoS One 11: e0147197. [DOI] [PMC free article] [PubMed] [Google Scholar]
- Snodgrass, G. L., Scott W. P., and Smith J. W.. . 1984. Host plants and seasonal distribution of the tarnished plant bug (Hemiptera; Miridae) in the Delta of Arkansas, Louisiana, and Mississippi. Environ. Entomol. 13: 110–116. [Google Scholar]
- Tassone, E. E., Geib S. M., Hall B., Fabrick J. A., Brent C. S., and Hull J. J.. . 2016. De novo construction of an expanded transcriptome assembly for the western tarnished plant bug, Lygus hesperus. GigaScience 5: 6. [DOI] [PMC free article] [PubMed] [Google Scholar]
- Walker, W. B., and Allen M. L.. . 2010. Expression and RNA interference of salivary polygalacturonase genes in the tarnished plant bug, Lygus lineolaris. J. Insect Sci. 10: 173. [DOI] [PMC free article] [PubMed] [Google Scholar]
- Wold, S. J., and Hutchison W. D.. . 2003. Phenology of Lygus lineolaris (Hemiptera: Miridae) in Minnesota June-bearing strawberries: comparison of sampling methods and habitats. J. Econ. Entomol. 96: 1814–1820. [DOI] [PubMed] [Google Scholar]
- Yang, C., Preisser E. L., Zhang H., Liu Y., Dai L., Pan H., and Zhou X.. . 2016. Selection of reference genes for RT-qPCR analysis in Coccinella septempunctata to assess un-intended effects of RNAi transgenic plants. Front. Plant Sci. 7: 1672. [DOI] [PMC free article] [PubMed] [Google Scholar]
- Zeng, F., Zhu Y. C., and Cohen A. C.. . 2002. Molecular cloning and partial characterization of a trypsin-like protein in salivary glands of Lygus hesperus (Hemiptera: Miridae). Insect Biochem. Mol. Biol. 32: 455–464. [DOI] [PubMed] [Google Scholar]
- Zhang, L., Xu P., Xiao H., Lu Y., Liang G., Zhang Y., and Wu K.. . 2015. Molecular characterization and expression profiles of polygalacturonase genes in Apolygus lucorum (Hemiptera: Miridae). PLoS One 10: e0126391. [DOI] [PMC free article] [PubMed] [Google Scholar]
- Zhu, Y. C., Zeng F., and Oppert B.. . 2003. Molecular cloning of trypsin-like cDNAs and comparison of proteinase activities in the salivary glands and gut of the tarnished plant bug Lygus lineolaris (Heteroptera: Miridae). Insect Biochem. Mol. Biol. 33: 889–899. [DOI] [PubMed] [Google Scholar]
- Zhu-Salzman, K., and Zeng R.. . 2015. Insect response to plant defensive protease inhibitors. Annu. Rev. Entomol. 60: 233–252. [DOI] [PubMed] [Google Scholar]
- Zhu-Salzman, K., Bi J. L., and Liu T. X.. . 2005. Molecular strategies of plant defense and insect counter-defense. Insect Sci. 12: 3–15. [Google Scholar]
Associated Data
This section collects any data citations, data availability statements, or supplementary materials included in this article.


