Abstract
The accuracy of atmospheric chemical mechanisms used in air quality models is critical for robustly predicting the production and decay of air pollutants and thus to develop strategies to reduce concentrations that are above levels harmful to humans and ecosystems. In this study we document, evaluate and analyze the implementation of the CB6r3 chemical mechanism used in the Community Multiscale Air Quality (CMAQ) model, including changes that have been to the standard version, and demonstrate the impact of this update on predictions. In general, CB6r3 slightly improves the predictions of ozone and oxides of nitrogen, while providing more consistency with current scientific understanding. Nitric acid is generally overpredicted in both winter and summer, and ongoing work continues to address this overprediction and update other aspects of the mechanism.
Keywords: chemical mechanism, ozone, HAPs, Carbon Bond
1. Introduction
Atmospheric chemistry is at the heart of air quality models (AQMs) used in research and regulatory applications to understand the complex mixture of chemicals present in the ambient atmosphere. Atmospheric chemistry controls the production and decay of chemical air pollutants that are harmful to human health and ecosystems, such as ozone (O3), nitrogen dioxide (NO2), hazardous air pollutants (HAPs) and fine particulate matter (PM2.5). In AQMs, gas-phase atmospheric chemistry is characterized by a chemical mechanism, which quantifies the possible reactions, rates, and products of the many individual chemicals that react in the ambient atmosphere, and translates this information into a structure that can be used in an AQM. Thus, the chemical mechanism provides the bridge between experimental and theoretical chemical kinetics studies and their usage in real-world air pollution applications (i.e. Kaduwela et al., 2015). AQMs are used in a wide variety of applications, such as assessing emission reductions to help meet regulatory goals, analyzing future impacts of new technologies, addressing the impact of uncertain processes, and quantifying spatial and temporal heterogeneity in air pollution. Selecting a chemical mechanism appropriate for the problem being addressed is therefore critical for obtaining reliable answers to questions about current and future air quality.
The Community Multiscale Air Quality Modeling (CMAQ) system is a 3-dimensional, urban-to-continental-scale AQM used extensively for regulatory and research studies worldwide (https://www.epa.gov/cmaq). One major change included in the recent CMAQ release is addition of the CB6r3 chemical mechanism (Emery et al., 2015). While CB6r3 uses a similar condensation approach as earlier Carbon Bond-type mechanisms, it has updates that make it more consistent with current scientific consensus on atmospheric chemistry. These include updated reaction rate constants, updated isoprene chemistry, extended organic peroxy radical chemistry, and additional species that can affect the production of O3, HAPs and PM2.5. Overall, the CB6 chemical mechanism is an improved chemical mechanism for AQMs compared to earlier versions of CB05 (Yarwood et al., 2010; Hildebrandt Ruiz and Yarwood, 2013; Goldberg et al., 2016).
The goal of this study is to document, evaluate and analyze predictions using the new CB6r3 chemical mechanism, applied over a large area, under winter and summer conditions, in CMAQ. We detail the implementation, defined here as CMAQ-CB6, document the usage of CMAQ-CB6 for predicting concentrations of O3, oxidized nitrogen (NOy) and HAPs, demonstrate differences from previous mechanisms available in CMAQ, and compare predictions against observations. The earlier CB05tucl mechanism (Whitten et al., 2010), previously available in CMAQv5.02, has been used extensively in rulemaking and development of strategies to reduce air pollution in the U.S., so an important purpose of this study is to understand whether updating the chemistry might change predicted air quality outcomes. We analyze the sensitivity of CMAQ-CB6 to the representation of some uncertain reactions and emissions. Lastly, we summarize and discuss the challenges of maintaining robustness and state-of-the-science in the representation of atmospheric chemistry within AQMs.
2. Description of the chemical mechanism
2.1. Description of base mechanism, CB6r3
The CB6 version of the Carbon Bond chemical mechanism was first developed for use in AQMs in 2010 (Yarwood et al., 2010), and revised several times (Yarwood et al., 2012; Hildebrandt Ruiz and Yarwood, 2013; Emery et al., 2015). CB6r3 is the starting point for our implementation.
Differences between CB6 and earlier CB05 mechanisms have been the subject of previous reports (i.e. Ramboll Environ, 2016). Some updates relevant for regional scale modeling include:
additional explicit species to represent longer-lived, abundant organic compounds, including acetone, benzene, propane and acetylene.
additional organic peroxy radicals and reactions.
updated isoprene chemistry, including production of isoprene epoxydiol and hydroperoxyaldehydes resulting from isomerization of isoprene hydroxyperoxy radicals.
more detailed representation of organic nitrate species by using three model species.
heterogeneous hydrolysis reaction of one organic nitrate species (NTR2).
updated organic and inorganic reaction rate constants (IUPAC, 2017).
CMAQ-CB6 is an extension of CB6r3, providing additional capabilities needed in CMAQ, including prediction of HAPs, secondary organic aerosol (SOA) precursors and other functions detailed in the following sections.
2.2. Extensions for formation and decay of key HAPs
In addition to criteria pollutants (O3, NO2, sulfur dioxide (SO2), PM2.5, and carbon monoxide (CO)), CMAQ-CB6 includes the option to simulate HAPs, in gas and particle phases (Luecken et al., 2006; Hutzell and Luecken, 2008). HAPs represented in CMAQ include 30 species posing the greatest potential health threat in urban areas (urban air toxics) and several additional HAPs, identified in analyses from the National Air Toxics Assessment (US Environmental Protection Agency [EPA], 2015). All HAPs available in CMAQv5.2 are listed in Tables S-1 and S-2.
There are nine active HAPs in CMAQ-CB6, whose concentrations are calculated within the chemistry solver: formaldehyde (HCHO), acetaldehyde, 1,3-butadiene, acrolein, benzene, toluene, naphthalene, chlorine and hydrochloric acid, with the implementation of new HAP reactions not otherwise available in CB6, listed in Table 1.
Table 1.
Reactions of active HAP species in CMAQ-CB6.
| Rxn ID | Reaction represented | Rate expression | K298 | Notes |
|---|---|---|---|---|
| T10 | BUTADIENE13 + OH = OH + 0.58 × ACROLEIN | 1.48 × 10⁻¹¹ exp(448/T) | 6.6 × 10⁻¹¹ | Reaction rate (Calvert et al., 2000); yield of acrolein (Tuazon et al., 1999) |
| T11 | BUTADIENE13 + O3 = O3 + 0.52 × ACROLEIN | 1.34 × 10⁻¹⁴exp(−2283/T) | 6.31 × 10⁻¹⁸ | Reaction rate (Calvert et al., 2000); yield of acrolein (Tuazon et al., 1999) |
| T12 | BUTADIENE13 + NO3 = NO3 + 0.045 × ACROLEIN | 1.79 × 10⁻¹³ | 1.79 × 10⁻¹³ | Yarwood et al.(2005); yield of acrolein (Tuazon et al., 1999) |
| TCL3 | BUTADIENE13 + CL = CL + 0.58 × ACROLEIN | 2.51 × 10⁻¹⁰ | 2.51 × 10⁻¹⁰ | (Stutz et al., 1998), same yield as in OH reaction |
| T17 | ACROLEIN + OH = OH | 2.0 × 10⁻¹¹ | 2.0 × 10⁻¹¹ | Orlando and Tyndall, (2002) |
| T18 | ACROLEIN + O3 = O3 | 2.61 × 10⁻¹⁹ | 2.6 × 10⁻¹⁹ | Grosjean et al. (1993) |
| T19 | ACROLEIN + NO3 = NO3 | 1.15 × 10⁻¹⁵ | 1.15 × 10⁻¹⁵ | Calvert et al. (2011) |
| T20 | ACROLEIN = | Uses photo rates | ||
| TCL5 | ACROLEIN + CL = CL | 2.37 × 10⁻¹⁰ | 2.4 × 10⁻¹⁰ | Calvert et al. (2011) |
| T21 | TOLU + OH = OH | 1.8 × 10⁻¹²exp(340/T) | 5. × 10−12 | Same as CB6 rate for model species TOL + OH |
| TCL6 | TOLU + CL = CL | 6.1 × 10⁻¹¹ | 6.1 × 10⁻¹¹ | Shi and Bernhard, (1997) |
| R185a | NAPH + OH = 0.155 × CRES + 0.544 × XLO2 + 0.602 × RO2 + 0.244 × XOPN + 0.244 × OH+ 0.058 × XO2H + 0.155 × HO2 + PAHRO2 | 1.85 × 10⁻¹¹ | 1.9 × 10⁻¹¹ | Same reaction rate and products as CB6 model species XYL; napthalene emissions are not included in XYL but modeled explicitly with this reaction. |
| T02-T05; TCL1 | Formaldehyde primary decay reactions only | Same reaction rates as FORM in base mechanism, reactions R96-R100; CL16 | Reactive tracer to account for formaldehyde from emissions only. | |
| T06-T09; TCL2 | Acetaldehyde primary decay reactions only | Same reaction rates as ALD2 in base mechanism, reactions R105-R108; CL17 | Reactive tracer to account for acetaldehyde from emissions only. | |
| T13-T16; TCL5 | Acrolein decay reactions only | Same reaction rates as T17-T20; TCL5 | Reactive tracer to account for acrolein from emissions only. |
Calculations for another 34 gas phase HAP species and 15 aerosol-phase HAP species are optional in a CMAQ simulation. Their concentrations are calculated at the end of the chemical kinetics time step using predicted oxidant concentrations. Most were available in previous CMAQ releases, but nine new HAPs (Table S-3) have been added in CMAQv5.2, representing compounds recently identified as top contributors to cancer and non-cancer risk (EPA, 2015).
In addition to HAPs explicitly listed in Tables S-1 and S-2, CMAQ has been designed with the flexibility to include new, potentially hazardous pollutants as additional research becomes available. For example, CMAQ has previously been used to model herbicides, multiple PAHs and hydrofluorocarbons (i.e. Cooter and Hutzell, 2002; Aulinger et al., 2007; Luecken et al., 2009).
2.3. modifications to CB6 in CMAQ for compatibility with previous releases
Other modifications implemented in CMAQ-CB6 for compatibility with previous CMAQv5.1 (Appel et al., 2017), include:
First order decay of ozone to parameterize halogen depletion, as in Appel et al. (2017).
Production and reaction of SOA tracer species from reactions of aromatics, terpenes, PAHs, alkanes and terpenes (https://www.epa.gov/cmaq; Pye and Pouliot, 2012).
Additional species and reactions of semivolatile primary organic aerosols from combustion, accounting for aerosol aging and fragmentation (Donahue et al., 2012).
Chlorine chemistry from CB05 (Yarwood et al., 2005), and addition of nitryl chloride (ClNO2) gas phase reaction and formation from heterogeneous reactions of dinitrogen pentoxide (N2O5), which recycles NO2.
Heterogeneous reactions solved simultaneously with the gas phase, which can impact gas phase species, especially reactions of N2O5 to form nitric acid (HNO3) and ClNO2, hydrolysis of nitrates, and partitioning of isoprene epoxydiol.
2.4. Other modifications to CB6 in CMAQ
A few additional modifications made to CMAQ-CB6 include:
Correction to products from the reaction of isoprene peroxy radical (species ISO2) and lumped peroxy radicals (RO2), identified as part of CB6r4 (Emery et al., 2016).
Representation of the quantum yield of glyoxal as the sum of all nonzero channels (Atkinson et al., 2006). The cross sections are from IUPAC (2017) below 473 nm, and JPL (2015) above 474 nm, and include temperature and density corrections.
Modification of the quantum yield for hydroxyacetaldehyde photolysis (species GLYD) to a constant value of 0.75 as recommended in IUPAC (2017).
Recalculation of the methyl glyoxal quantum yields to smoothly vary from 275 to 385, and inclusion of a temperature and density correction, based on IUPAC (2017) and the MPI-MAINZ UV/VIS spectral atlas (http://satellite.mpic.de/spectral_atlas).
Inclusion of a pressure-dependency in the quantum yield of acetone photolysis.
A listing of all reactions included in CMAQ-CB6 is given in Table S-4.
3. Description of model parameters used for testing, analysis, and evaluation
CMAQ-CB6 is implemented and tested in CMAQ version 5.2. CMAQ was recently evaluated against a large database of observations (version 5.1, Appel et al., 2017) and performed well for O3 and PM2.5 concentrations. The emissions, meteorology, domain, and other conditions of this simulation are as described previously (Appel et al., 2017) and will only be briefly summarized here. CMAQv5.2 is applied over the contiguous US, along with portions of Mexico and Canada, using a model domain consisting of 469 east-west cells and 299 south-north cells with horizontal dimensions of 12 km by 12 km. The vertical dimension consists of 35 layers of variable height spanning from the surface, where the layer midpoint is approximately 10 m, to a total height of 50 hPa (approximately 20 km). Boundary conditions for the 12 km CMAQ simulations are provided by a 2011 hemispheric GEOS-Chem simulation (Bey et al., 2001) with chemical species mapped to corresponding CMAQ-CB6 species.
Meteorological fields were provided by WRFv3.7, with options previously described in Appel et al. (2017), and processed with MCIP v4.2 (https://www.cmascenter.org/). Emissions were derived from the National Emission Inventory (NEI) 2011 version 3.5ek, processed and gridded using the Sparse Matrix Operator Kernel Emissions program (SMOKE; https://www.cmascenter.org/smoke/). In-line biogenic emissionswere calculated with the BEIS v3.61 modeling system (Bash et al., 2016); additional emissions include bidirectional ammonia fluxes and in-line NOx emissions estimated from lightning strikes (Kang et al., 2018).
The performance of CMAQ-CB6 was demonstrated for simulations over January and July, 2011. Simulations were initialized with a 10-day spin-up to minimize the impact of initial conditions. Gas-phase observations of hourly O3 during this period were obtained from the Air Quality System (AQS; https://www.epa.gov/aqs), collected at 2086 sites across the continental U.S. Additional observational data for HNO3 and aerosol nitrate were obtained from the Southeastern Aerosol Research and Characterization network (SEARCH; https://my.usgs.gov/gcmp/program/show/943855). For the July simulation, AQS monitoring data were supplemented by specialized measurements made during the DISCOVER-AQ experiment in Baltimore, MD (https://www-air.larc.nasa.gov/missions/discover-aq/discover-aq.html). Previous studies have documented the rich dataset available from this experiment (Crawford et al., 2014; Anderson et al., 2014; Simon et al., 2018).
Base case simulations were performed with CMAQv5.2 using three versions of Carbon Bond mechanisms: 1.) CMAQ-CB6, with the modifications described previously; 2.) CB05tucl; a version of CB05 with updated toluene (Whitten et al., 2010), released in CMAQ v5.0.2; and 3.) CB05e51; an interim update of CB05tucl with additional organic nitrate species (Appel et al., 2017), released in CMAQv5.1.
Two additional “what if” sensitivity studies were performed using CMAQ-CB6, to study aspects of the chemistry where large uncertainty exists that could change model predictions. These studies were done over the period of July 1–14, 2011, focusing on summer conditions when photochemical activity is highest:
CB6_2xisop: CMAQ-CB6 with isoprene emissions increased by a factor of 2. This was chosen to roughly approximate the difference between the BEIS and MEGAN biogenic isoprene emission estimates (Bash et al., 2016) and allow closer comparison with models that use a different biogenic representation (including simulations of Goldberg et al., 2016). This sensitivity provides a brute-force way to demonstrate how further refinement of biogenic emissions or chemistry might affect model predictions of multiple species.
CB6_2h_nitH: CMAQ-CB6 with faster heterogeneous hydrolysis of nitrates (2 h lifetime), which is within the range of previous estimates needed to reproduce measurements in areas with biogenic emissions (Fisher et al., 2016; Lee et al., 2016). This is likely to be high for an overall hydrolysis rate, but may give further insight on the impact of other processes that remove NOy.
4. Results
4.1. Base case simulations and comparisons with observations and previous versions
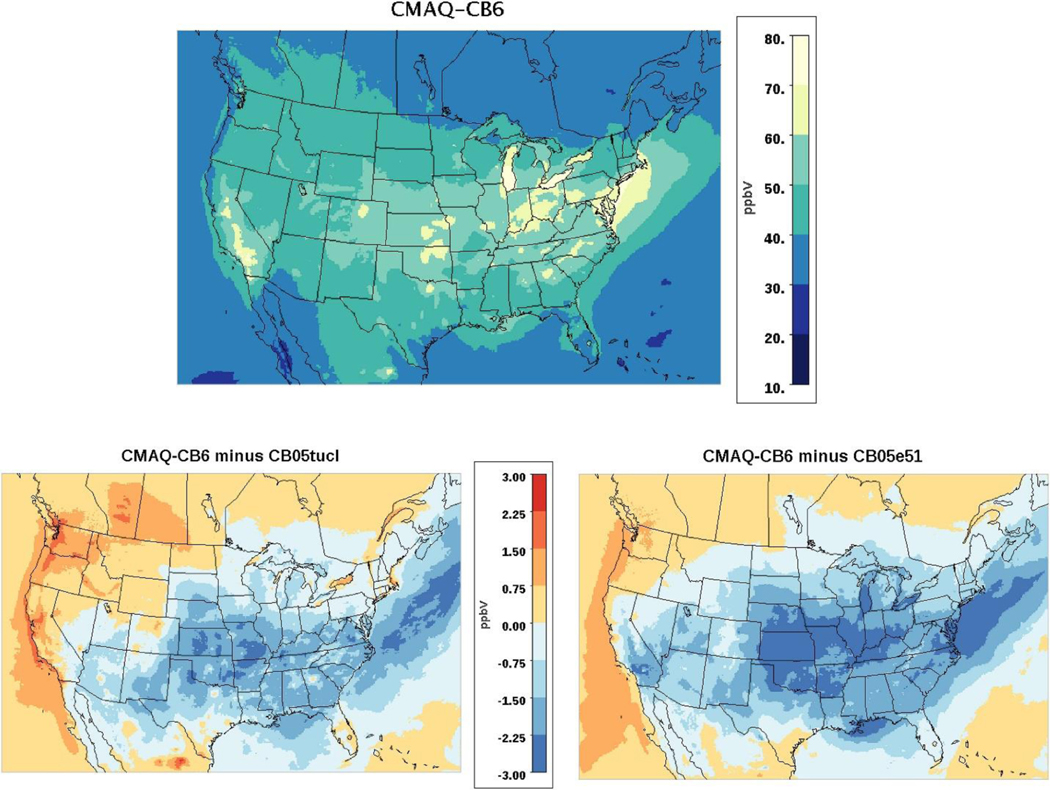
Fig. 1 shows the spatial distribution of the July and January ozone concentrations predicted by CMAQ-CB6, and the differences from earlier mechanisms, CB05tucl and CB05e51. This figure shows the monthly mean of the maximum 8-h average concentrations calculated for each day of the month. CMAQ-CB6 predicts lower O3concentrations than the other mechanisms, with the largest differences occurring in the southeastern and south-central US. These differences are caused by multiple interacting processes, with the largest impact from lower levels of NO2 recycling by CMAQ-CB6 in areas of the country where O3 tends to be limited by NOx (NO + NO2) availability. CMAQ-CB6 predicts about 30–40% more NOy removal than CB05tucl, because the nitrate species are more soluble and can hydrolyze to HNO3, which is rapidly deposited. While CMAQ-CB6 and CB05e51 have similar removal rates of NOy, CMAQ-CB6 has fewer reactions recreating NO2 from nitrate, which results in reduced availability of NO2 to form O3.
Fig. 1.
Mean of 8-h daily maximum O3 concentration in July, 2011 using CMAQ-CB6 (top), and mean difference in daily maximum 8-hr O3 concentration between CMAQ-CB6 and CB05tucl (bottom, left) and between CMAQ-CB6 and CB05e51 (bottom, right). Blue values indicate where CMAQ-CB6 predicts lower O3.
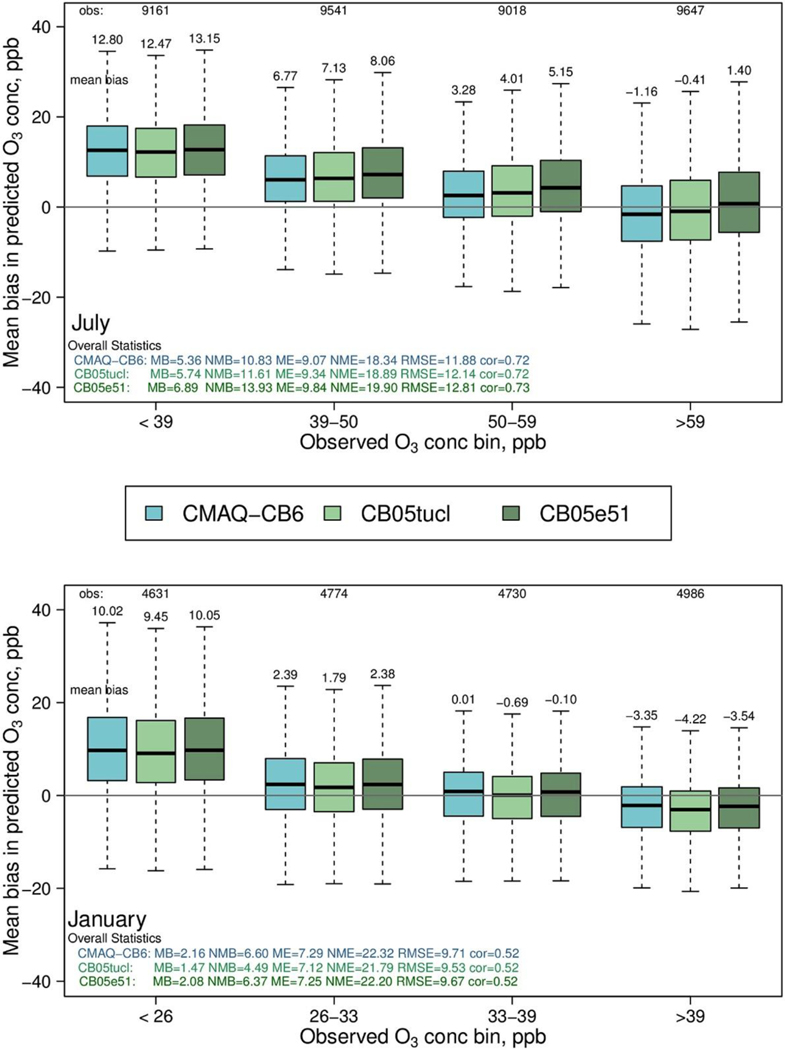
In Fig. 2, the distribution of the daily mean bias (MB) of each of these mechanisms is compared to observed values. These comparisons are shown across four O3 bins, chosen to represent similar numbers of observations. In July, all versions overpredict O3 at the lowest concentration levels but are relatively unbiased for concentrations in the highest quartile of observations, which includes concentrations most relevant from a regulatory standpoint. When this quartile is expanded in July (Figure S-1), CMAQ-CB6 performs well for the lowest half of the observations and slightly underpredicts at the 2 highest quartiles. Concentrations of O3 are lower in January, and predictions show relatively little bias in the mid-concentration bins, but a larger negative bias at high concentrations. Over the entire concentration range, CMAQ-CB6 performs about the same as CB05tucl and CB05e51: with MB = 5.36, it is slightly better in July, and with MB = 2.16 it is slightly worse in January. With a normalized mean bias (NMB) of 10.8% in July and 6.6% in January, a normalized mean error (NME) of 18.3 in July and 22.3 in January, and root mean square error (RMSE) of 11.9 in July and 9.7 in January, the overall statistics are within the ranges of those seen in other model evaluation studies (Simon et al., 2012). Consistent with these studies (i.e. Simon et al., 2012), CMAQ-CB6 slightly overestimates ozone when all data are included, with improved performance when only observed values above 60 ppb are included (NMB = −2.0, NME = 11.8 and RMSE = 10.8; Figure S-1).
Fig. 2.
Mean bias in daily, maximum 8-h O3 for CMAQ-CB6 and two earlier mechanisms (CB05tucl and CB05e51) in July (top) and January, 2011 (bottom). The number of observations in each concentration bin are given at the top and indicated by relative width of each box; top and bottom of each box denote the 75th and 25th percentiles, respectively, and whiskers denote either the minimum and maximum values or the1.5 × the interquartile range, depending on which is closest to the median.
CMAQ-CB6 performance varies slightly across the US (Figure S-2), with less bias in all bins for the Northeast subset of states (NMB = 8.2%), compared to the Southeast (NMB = 12.9%) or Midwest (NMB = 13.4%) subsets, but remains relatively unbiased for all subsets in the highest quartile.
There is essentially no difference in predictions of NOx between CMAQ-CB6 and the two other mechanisms (Figure S-3). When compared to observations, all three mechanisms slightly overpredict in the summer (NMB = 10.7 to 12.1), and underpredict in winter (NMB = −34.6 to −35.), with the mean relatively unbiased for the lowest bins and underpredicted at the higher concentrations. Since chemiluminescent measurements of NOx can include interference from other oxidized nitrogen species, on the order of 50% in the summer months (i.e. Lamsal et al., 2008), the overprediction in July would likely be larger for NOx than this comparison indicates. While other studies have found NOx overpredicted by CMAQ and postulated that NOx emissions are overestimated, the link between concentrations from AQMs and emissions is complex, involving meteorology, chemistry, deposition and emissions, and the exact reason for these overpredictions is still being investigated (i.e. Simon et al., 2018).
4.2. Model predictions for NOy species
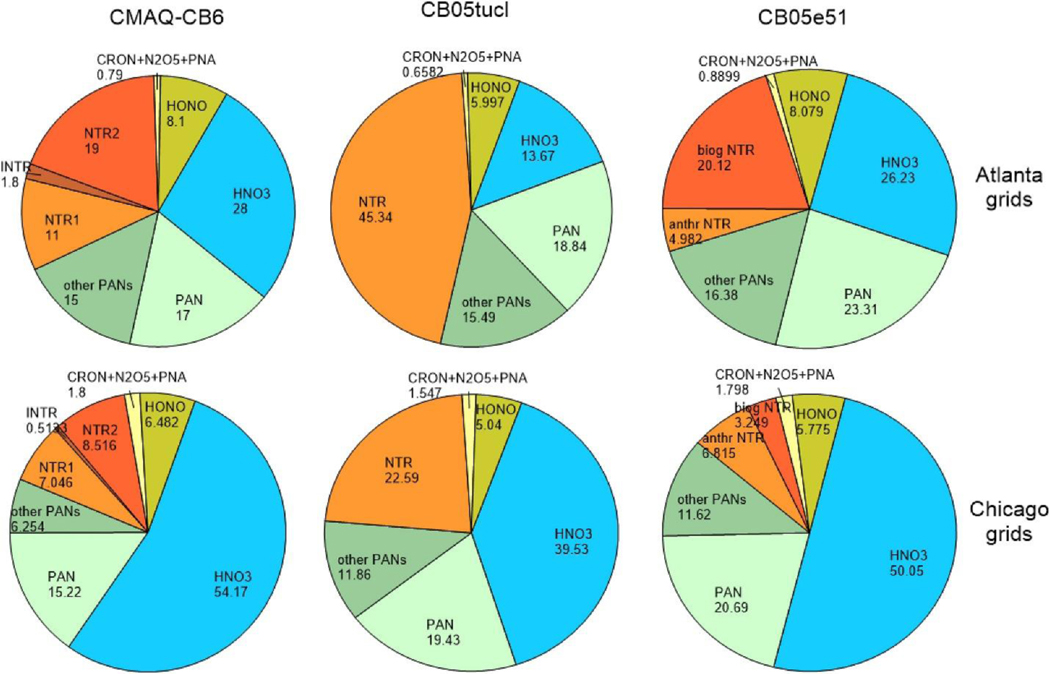
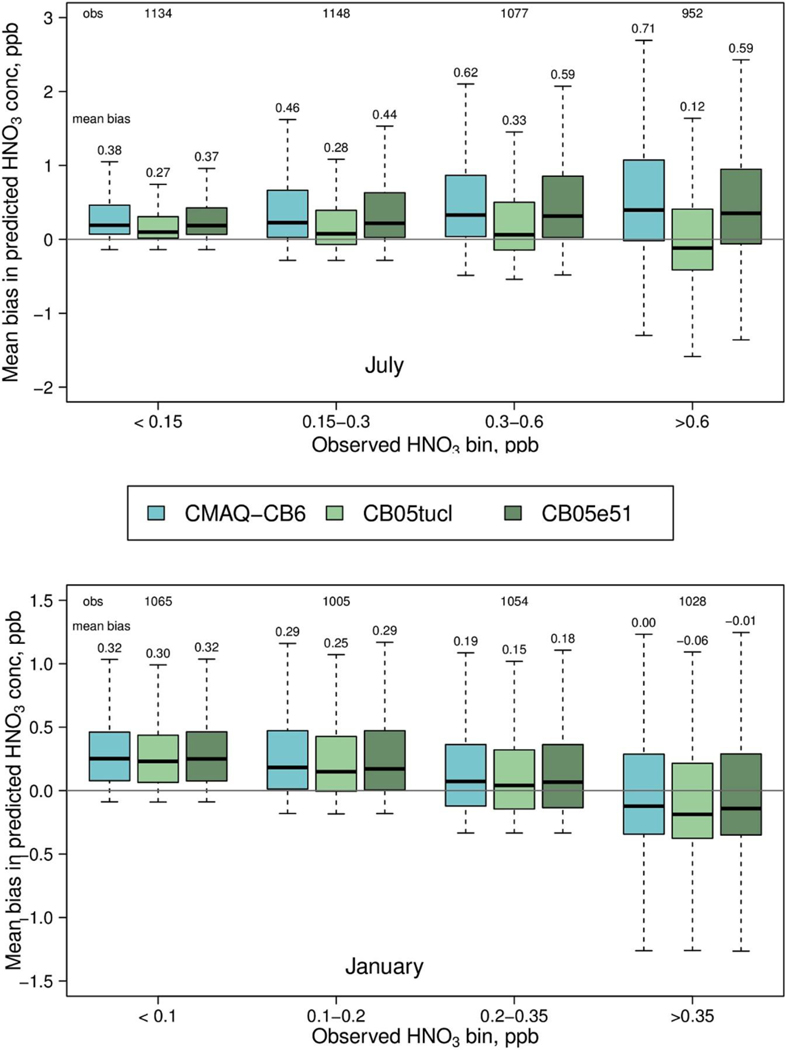
Fig. 3 shows the July average relative distribution of NOz (all gas phase oxidized nitrogen species except NOx) from CMAQ-CB6, CB05tucl and CB05e51 at two different urban areas, consisting of 16 grids surrounding Atlanta and Chicago; distributions for Baltimore and Cincinnati are shown in Figure S-4. At all locations, HNO3 is the largest component of NOz in CMAQ-CB6, comprising 28–54% of the total. Alkyl nitrates (ANs; CMAQ-CB6 species NTR1+INTR + NTR2) are also substantial and provide a large fraction of total NOz in Atlanta, due to contribution from biogenic nitrates. The average chemical lifetime of ANs in CMAQ-CB6, as implemented in CMAQv5.2, is about 15 h at the surface in July, but dry deposition is a much larger loss, with a lifetime of about 2 h. Summed over the lowest ∼1 km of the model (first 15 layers), however, the lifetime of ANs is determined by both chemistry and physical processes, with a lifetime of about 30–100 h. Lifetimes of HNO3 are much shorter – about 6 h averaged over the lowest 1 km in altitude - with deposition being the predominant loss. In CMAQ-CB6, AN hydrolysis is a large source of HNO3, providing 28% of total HNO3 formation in the lower 1 km of the model, with OH + NO2 contributing 62%, and N2O5 hydrolysis another 10%. Monitoring data for HNO3 is not as comprehensive as for O3, but data from the SEARCH network for July, 2011 indicates that CMAQ-CB6 overpredicts HNO3observations in July and January (Fig. 4). Despite the high HNO3, aerosol nitrate is generally underpredicted in summer and at the highest NOx levels for all three mechanisms (Fig S-5), which could result from uncertainties in aerosol chemistry, or in ammonia and SO2 emissions that affect the volatility of aerosol nitrate.
Fig. 3.
Distribution of NOz species, averaged over July, 2011, for 16 grids covering Atlanta (top row) and Chicago (bottom row).
Fig. 4.
Mean bias in nitric acid modeled by CMAQ-CB6, CB05tucl and CB05e51 compared to observations, for the months of July (top) and January, 2011 (bottom).
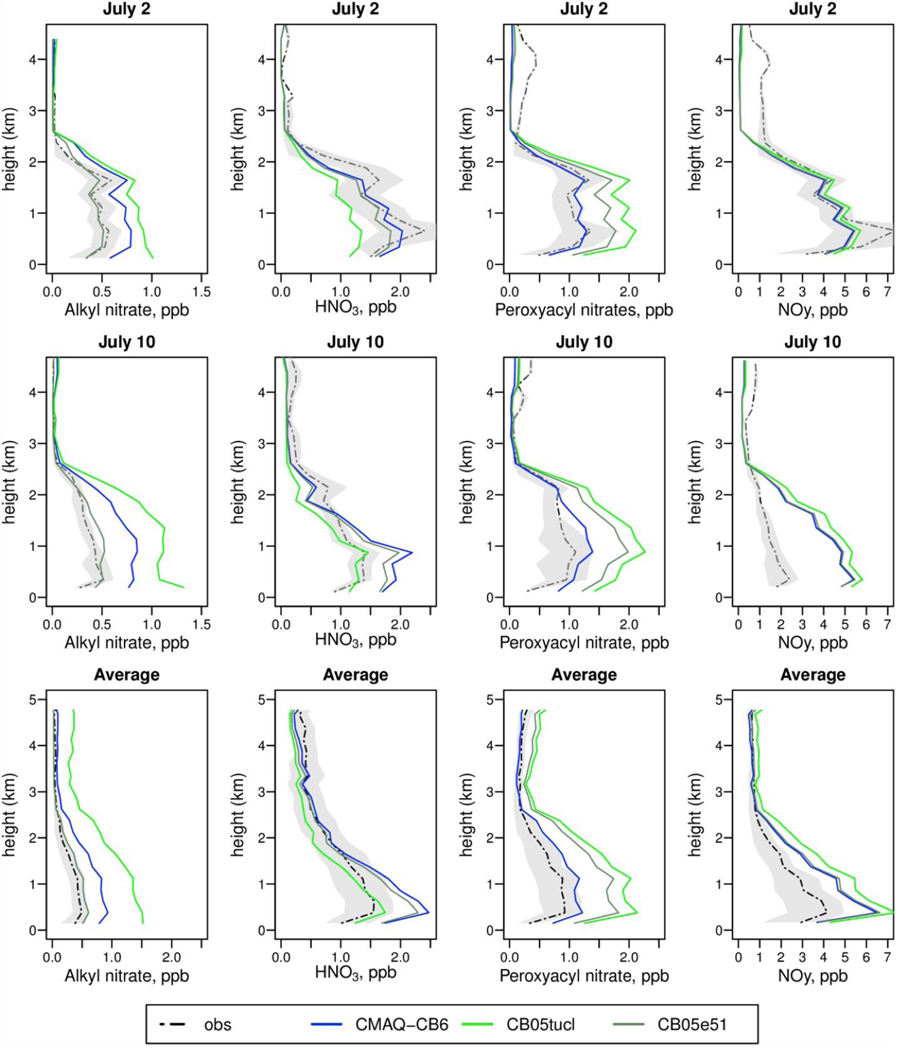
While there are many surface measurements of O3 across the U.S. in 2011, there are limited measurements of O3 and other pollutants above ground level. One comprehensive database available during 2011 is the DISCOVER-AQ field study, centered on the area around Baltimore, MD, including vertical profiles of NOy. Fig. 5 shows observations and model predictions for several NOy species during the flights of July 2 and July 10, 2011, and the average over 14 flights in July. Comparison of model predictions for twelve other days with DISCOVER-AQ measurements, including comparisons with photolytic measurements of NO2, are shown in Figures S-6 to S-10. CMAQ-CB6 shows significant improvement in reproducing the vertical structure and magnitude of peroxyacyl nitrates (PNs) compared to earlier mechanisms (Fig. 5 and S-8). For ANs, CMAQ-CB6 improves on the predictions of CB05tucl, because it allows for removal of the largest nitrate (NTR2) by heterogeneous reaction, although it still overestimates concentrations. The earlier CB05e51 performs better for ANs due to its inclusion of more decay reactions, but recycling of NO2 from these reactions contributes to the overprediction of PNs, as well as O3 (Fig. 2). CMAQ-CB6 also makes more HNO3than the other mechanism, as it includes a larger route through heterogeneous hydrolysis. On some days (such as July 2), this higher HNO3 prediction is in better agreement with observations, while on others (such as July 10) it worsens performance. CMAQ-CB6 predicts slightly less NO2 and NOy than the other mechanisms (Figures S-9 and S-10) because it terminates more NO2 via HNO3 and ANs. While CMAQ-CB6 slightly overpredicts NO2 on average during this experiment, it is largely within the interquartile range of the measurements.
Fig. 5.
Vertical profiles of model predictions for oxidized nitrogen species compared to observations taken during DISCOVER-AQ. Species include alkyl nitrates (leftmost), nitric acid (second from left), peroxyacyl nitrates (second from right) and total NOy (rightmost). Profile dates are July 2 (top) and July 10, 2011 (bottom row). The last row shows the average over all experiment days. Shaded areas show the interquartile range of observations.
Other modeling studies of DISCOVER-AQ also show overpredictions of NOy, including Simon et al. (2018), who found NMB = 50–69% for NOy and NMB = 18% for HNO3, using CMAQ v5.0,1 with CB05tucl. Goldberg et al. (2016) found both NOyand HNO3 to be overestimated during DISCOVER-AQ, with NMB = 86.2%, and NMB = 36.3%, respectively, using the CAMx model with CB05. They improved the bias by using CB6r2 in combination with a reduction in mobile NOx emissions, increase in AN deposition rates and use of MEGAN emissions, although that combination also produced a substantial overestimate in isoprene.
4.3. Model predictions for HAPs
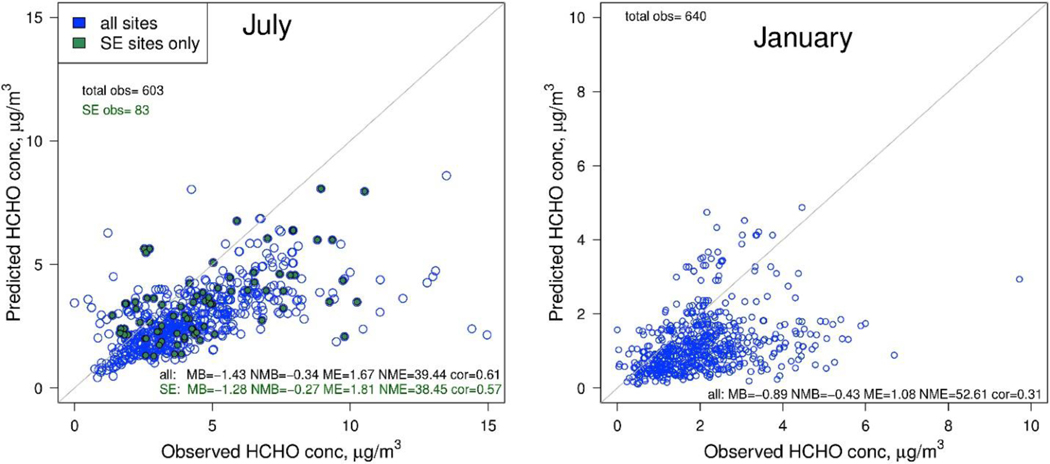
One important feature of CMAQ-CB6 is the ability to simulate HAPs as well as criteria pollutants. Fig. 6 shows an example of daily-averaged model predictions for HCHO, an important HAP, compared to measurements from the AQS network. In 2011, CMAQ-CB6 underpredicts HCHO concentrations overall, as well as at sites in the Southeast, where biogenic emissions are a large contributor. The performance for HCHO and other HAPs has been significantly worse than for O3 in the past (Luecken et al., 2006), including during the DISCOVER-AQ study, where NMB = −28.3 to −30% (Goldberg et al., 2016; Simon et al., 2018). Similarly, Marvin et al. (2017) found NMB = −32% for CB6r2 in the Southeastern US during the 2013 SENEX experiment, with other chemical mechanisms similarly underpredicting (NMB = −15 to −33%).
Fig. 6.
Comparison of 24-h average predicted and observed HCHO at all sites across the domain, in July, 2011 (left) and January, 2011 (right). Sites in the Southeastern US during July are identified in green.
Biogenic sources are a major contributor to HCHO concentrations, through both direct HCHO emissions and secondary production from other reactive volatile organic compounds (VOC)s, including isoprene, terpenes, methylbutenol and other alkenes (Luecken et al., 2018), so uncertainties in biogenic emissions will impact model performance for HCHO. Errors in the representation of HCHO from atmospheric chemistry, especially secondary biogenic reactions, may also contribute to this underprediction. Marvin et al. (2017) reduced the underprediction bias in half by increasing the yield of HCHO from later-generation products of isoprene oxidation, with the largest increases from addition of HCHO as a product to the photolysis of hydroperoxyaldehydes from isoprene peroxy radical isomerization, and substitution of HCHO as a product (instead of mechanism species PAR) to the reactions of lumped isoprene products (largely methyl vinyl ketone and methacrolein) represented by mechanism species ISPD. As HCHO is the largest non-O3 source of new radicals, the causes of this underprediction require further investigation and improvement.
4.4. Sensitivity studies to analyze impact of emissions and nitrate reactions
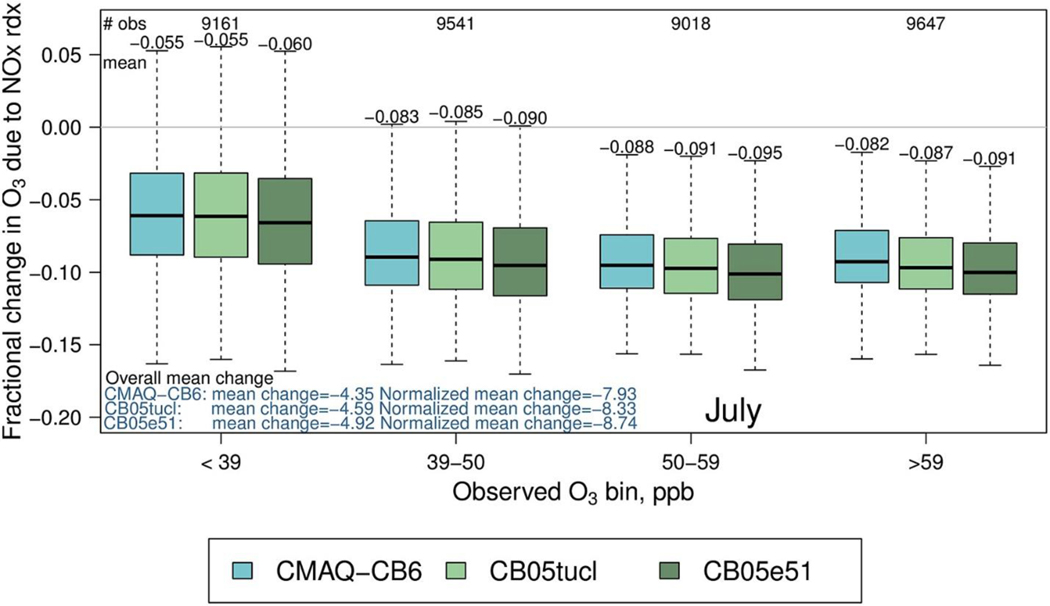
One important use of models is to predict how future concentrations of air pollutants might change due to emission reductions. Fig. 7 demonstrates differences among the three mechanisms in the response of ozone to a 30% anthropogenic NOx emission reduction. CMAQ-CB6 is slightly less responsive to a NOx reduction than the other two mechanisms across the entire range of concentrations, but the differences are small: less than 0.24 ppb on average compared to CB05tucl.
Fig. 7.
Fractional change in daily maximum 8-h averaged O3 in July, 2011 due to a 30% NOx reduction for three mechanisms. Negative values indicate a reduction in O3 when NOx is reduced.
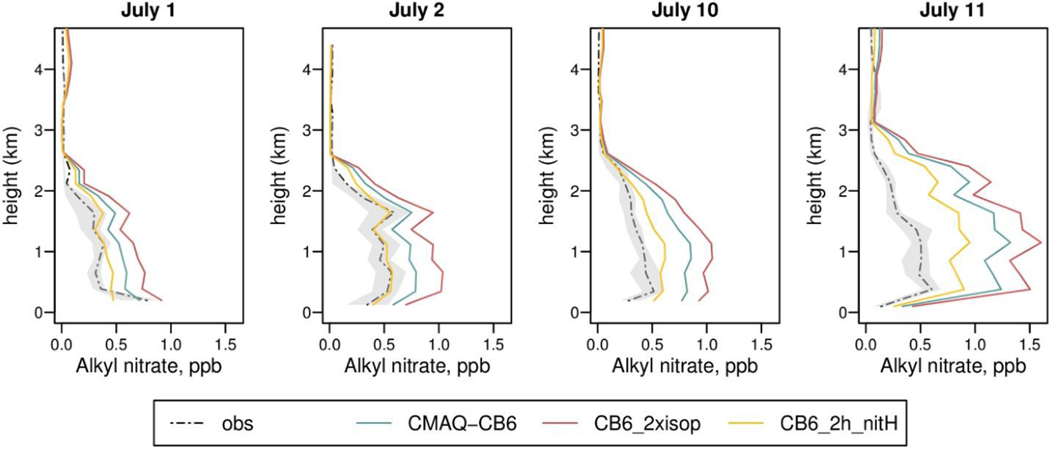
Although many reactions have been updated in the development of CB6r3, several aspects of the emissions and atmospheric chemistry are still uncertain. We performed two sensitivity studies to help constrain the impacts of two key areas of uncertainty (CB6_2xisop and CB6_2h_nitH, described in Section 3). Neither of these sensitivities has a large impact on O3 concentrations (Figure S-11). When isoprene emissions are doubled, O3 production increases slightly, improving model bias at the highest quartile but degrading it at lower concentrations, where CMAQ-CB6 already overpredicts. Increasing isoprene emissions also increases formation of isoprene nitrates, degrading model performance for ANs (Fig. 8). Although predictions of HCHO are improved, with the bias cut in half (Figure S-12), this might mask underprediction of HCHO in biogenic chemistry (i.e. Marvin et al., 2017). Alternatively, biogenic HCHO emissions or biogenic precursors other than isoprene may be underestimated, as previous studies have shown BEISv3.61 isoprene emissions to match observations well (Bash et al., 2016; Goldberg et al., 2016), and optimized inversions of isoprene emissions in the Southeast indicate that MEGAN isoprene emissions may be too high by 40% (Kaiser et al., 2018).
Fig. 8.
Vertical profiles of model predictions for alkyl nitrates compared to observations taken during DISCOVER-AQ, for CMAQ-CB6 and two sensitivity studies. Concentrations are for 4 flights in July. Shaded areas show the interquartile range of observations.
When heterogeneous hydrolysis of NTR2 is increased (CB6_2h_nitH), the impact on O3 is minor, but the increased NOx termination substantially impacts AN concentrations, improving agreement with DISCOVER-AQ measurements (Fig. 8). This indicates that some additional AN removal, without additional NO2 formation, is needed in the mechanism. Reduced availability of NOx would also reduce AN concentrations, as other studies (Anderson et al., 2014; Goldberg et al., 2016) have found improved predictions of ANs when mobile source NOx emissions were decreased by 50%. Goldberg et al. (2016), using the same nitrate chemistry as CMAQ-CB6, still found NMB = 136% in ANs when NOx emissions were reduced, in combination with isoprene from MEGAN and AN deposition increases, but increased isoprene likely contributed substantially to this bias as our CB6_2xisop simulation predicts.
5. Discussion, Conclusions and Future work needed
CMAQ-CB6 performs well, within the range of previous evaluations, compared to measurements over the wide variety of spatial, temporal, chemical and meteorological conditions encountered across the US. NOy speciation likely remains a problem, including overprediction of HNO3, and it is unclear whether this results from emission uncertainties, mischaracterization of physical processes or unknown chemistry processes. We note that high-quality data for evaluating NOy components is lacking and care must be taken when drawing conclusions from observations made in a small area of the country, and over one month of one year, such as those made during Baltimore DISCOVER-AQ. Consequently, modifications made to the mechanism to better match limited observations must be thoroughly scrutinized to ensure that they are applicable in other geographic locations and other seasons, without degrading model performance for other species.
Condensing atmospheric chemistry into a modeled chemical mechanism is a compromise between detail and computational efficiency, and no single chemical mechanism will have the appropriate detail for all applications. For regional applications where the major focus is on the criteria pollutant O3, CMAQ-CB6 provides predictions that are consistent with the established accuracy currently available in AQMs. While CMAQ-CB6 provides a relatively compact and computationally-efficient description of general atmospheric chemistry, it is difficult to modify, so it may not be appropriate for specialized applications where more detail is required in the chemical species or reactions, or where the inclusion of new/updated chemistry information is desired. With lumped mechanisms, such as CMAQ-CB6, most individual VOCs lose their identity, and model evaluations for individual VOCs are limited to those model species represented explicitly. In addition, the non-integer product coefficients resulting from the condensation process in CMAQ-CB6, as in many other condensed mechanisms, obscures the individual reaction pathways being represented, making it difficult to trace the model reactions back to “real” chemical species and kinetics on which they are based. The widely employed mechanism condensation strategy of collapsing several reactions to a single reaction can make it harder to determine how product stoichiometric coefficients influence the sensitivity of secondary species (e.g., ozone) to emitted species (Dunker et al., 2014, 2016).
For more specialized applications and evaluations, other condensation techniques, such as the SAPRC07 (Carter, 2010) could provide more flexibility to represent individual, emitted VOCs, while representations such as Common Representative Intermediate mechanisms (Jenkin et al., 2008) have more flexibility to characterize products and radicals, and to include additional chemistry and species as new research becomes available. This flexibility comes at a price, as it may increase computational requirements. We recommend further research with chemical solvers to investigate how computational efficiency depends on the number of reactions, numbers of products formed in the reactions, and integer vs. non-integer stoichiometric coefficients. A more complex mechanism will also require more time to implement, error-check, analyze and evaluate.
Future chemical mechanisms should incorporate flexibility to respond to the needs of the model application, as well as provide consistency, transparency, documentation of accuracy, and provenance (Kaduwela et al., 2015), along with tools to facilitate implementation, evaluation and analysis. Ideally, chemical mechanisms should be able to respond quickly to new discoveries in atmospheric chemistry or emerging chemicals. They should be capable of integrating with multi-phase chemistry, for example, the ability to predict SOA precursors and feedback between gas and aerosol species, although gas-phase mechanisms must remain flexible because AQMs implement multi-phase chemistry differently.
The analyses presented here demonstrate that CMAQ-CB6 performed as well as earlier mechanisms for O3, although it was unable to replicate the concentrations of HCHO and some oxidized nitrogen species with the same degree of confidence For air pollution issues other than O3, or when chemical regimes change, such as in the upper troposphere or different areas of the world, it is unclear whether these discrepancies will continue to give unbiased predictions for O3, hence it is essential that we continue to evaluate and improve representations of atmospheric chemistry in AQMs. This includes searching for better methods for condensing highly detailed chemical reaction sequences to forms that can be used in AQMs, while also maintaining the detailed reaction schemes from which they are derived.
Supplementary Material
Highlights.
The CB6 chemical mechanism has been included in CMAQ with modifications.
Predictions are analyzed against observations of several pollutants.
CMAQ-CB6 performance for ozone is similar to previous CB05 mechanisms.
6. Acknowledgements/Disclaimer
Although this work was reviewed by EPA and approved for publication, it may not necessarily reflect official Agency policy.
7. References
- Anderson LG, 2009. Ethanol fuel use in Brazil: air quality impacts. Energy & Environmental Science 2, 1015–1037. [Google Scholar]
- Appel KW, Napelenok SL, Foley KM, Pye HOT, Hogrefe C, Luecken DJ, Bash JO, Roselle SJ, Pleim JE, Foroutan H, Hutzell WT, Pouliot GA, Sarwar G, Fahey KM, Gantt B, Gilliam RC, Kang D, Mathur R, Schwede DB, Spero TL, Wong DC, Young JO, 2017. Description and evaluation of the Community Multiscale Air Quality (CMAQ) model version 5.1. Geosci. Model Dev, 10, 1703–1732, doi: 10.5194/gmd-1703-2017. [DOI] [PMC free article] [PubMed] [Google Scholar]
- Atkinson R, Aschmann SM, 1988. Kinetics of the reactions of acenaphthene and acenaphthylene and structurally-related aromatic compounds with OH and NO3 radicals, N2O5 and O3 at 296 ± 2 K. International Journal of Chemical Kinetics 20, 513–539. [Google Scholar]
- Atkinson R, Baulch DL, Cox RA, Crowley JN, Hampson RF, Hynes RG, Jenkin ME, Rossi MJ, Troe J, Subcommittee I, 2006. Evaluated kinetic and photochemical data for atmospheric chemistry: Volume II - gas phase reactions of organic species. Atmos. Chem. Phys 6, 3625–4055. [Google Scholar]
- Aulinger A, Matthias V, Quante M, 2007. Introducing a Partitioning Mechanism for PAHs into the Community Multiscale Air Quality Modelling System and Its Application to Simulating the Transport of Benzo(a)pyrene over Europe, Journal of Applied Meteorology and Climatology 46 (11), 1718–1730 [Google Scholar]
- Bash JO, Baker KR, Beaver MR, 2016. Evaluation of improved land use and canopy representation in BEIS v3. 61 with biogenic VOC measurements in California. Geosci. Model Dev, 9, 2191. [Google Scholar]
- Calvert JG, Atkinson R, Becker KH, Kamens RM, Seinfeld JH, Wallington TJ, Yarwood G, 2002. The Mechansms of Atmospheric Oxidation of Aromatic Hydrocarbons. Oxford University Press, New York, NY. [Google Scholar]
- Calvert JG, Atkinson R, Kerr JA, Madronich S, Moortgat GK, Wallington TJ, Yarwood G, 2000. The mechanisms of atmospheric oxidation of the alkenes. Oxford University Press, New York/Oxford. [Google Scholar]
- Calvert JG, Derwent RG, Orlando JJ, Tyndall GS, Wallington TJ, 2008. Mechanisms of atmospheric oxidation of the alkanes. Oxford University Press, New York, NY. [Google Scholar]
- Calvert JG, Mellouki A, Orlando JJ, Pilling MJ, Wallington TJ, 2011. The mechanisms of atmospheric oxidation of the oxygenates. Oxford University Press, New York. [Google Scholar]
- Calvert JG, Orlando JJ, Stockwell WR, Wallington TJ, 2015. The mechanisms of reactions influencing atmospheric ozone. Oxford University Press, New York, NY. [Google Scholar]
- Carter WPL, 2010. Development of the SAPRC-07 chemical mechanism. Atmospheric Environment 44, 5324–5335. [Google Scholar]
- Cho J, Roueintan M, Li Z, 2014. Kinetic and Dynamic Investigations of OH Reaction with Styrene. The Journal of Physical Chemistry A 118, 9460–9470. [DOI] [PubMed] [Google Scholar]
- Cooter EJ, Hutzell WT, 2002. A Regional Atmospheric Fate and Transport Model for Atrazine. 1. Development and Implementation. Environmental Science & Technology 36, 4091–4098. [DOI] [PubMed] [Google Scholar]
- Donahue NM, Kroll JH, Pandis SN, Robinson AL, 2012. A two-dimensional volatility basis set – Part 2: Diagnostics of organic-aerosol evolution. Atmos. Chem. Phys 12, 615–634. [Google Scholar]
- Emery C, Jung J, Koo B, Yarwood G, 2015. Improvements to CAMx snow cover treatments and Carbon Bond chemical mechanism for winter ozone. Final Report, prepared for Utah Department of Environmental Quality, Salt Lake City, UT. Prepared by Ramboll Environ, Novato, CA, August 2015. [Google Scholar]
- Emery C, Koo B, Hsieh WC, Wentland A, Wilson G, Yarwood G. 2016. Technical Memorandum to Chris Misenis at U.S.EPA reporting on EPA Contract, EPD12044; WA 4–07; Task 7, August 1, 2016. [Google Scholar]
- Fisher JA, Jacob DJ, Travis KR, Kim PS, Marais EA, Chan Miller C, Yu K, Zhu L, Yantosca RM, Sulprizio MP, Mao J, Wennberg PO, Crounse JD, Teng AP, Nguyen TB, St. Clair JM, Cohen RC, Romer P, Nault BA, Wooldridge PJ, Jimenez JL, Campuzano-Jost P, Day DA, Hu W, Shepson PB, Xiong F, Blake DR, Goldstein AH, Misztal PK, Hanisco TF, Wolfe GM, Ryerson TB, Wisthaler A, Mikoviny T, 2016. Organic nitrate chemistry and its implications for nitrogen budgets in an isoprene- and monoterpene-rich atmosphere: constraints from aircraft (SEAC4RS) and ground-based (SOAS) observations in the Southeast US. Atmos. Chem. Phys 16, 5969–5991. [DOI] [PMC free article] [PubMed] [Google Scholar]
- Grosjean D, 1991. Atmospheric Chemistry of Toxic Contaminants. 5. Unsaturated Halogenated Aliphatics: Allyl Chloride, Chloroprene, Hexachlorocyclopentadiene, Vinylidene Chloride. Journal of the Air & Waste Management Association 41, 182–189. [Google Scholar]
- Grosjean D, Grosjean E, Williams EL, 1993. Rate constants for the gas-phase reactions of ozone with unsaturated alcohols, esters, and carbonyls. International Journal of Chemical Kinetics 25, 783–794. [Google Scholar]
- Hildebrandt Ruiz L, Yarwood G, 2013. Interactions between Organic Aerosol and NOy: Influence on Oxidant Production. Final report for AQRP project 12–012, http://aqrp.ceer.utexas.edu/projectinfoFY12_13/12-012/12-012%20Final%20Report.pdf
- Hutzell WT and Luecken DJ, 2008. Fate and transport of emissions for several trace metals over the United States, Science of The Total Environment, 396, 2, 164–179. [DOI] [PubMed] [Google Scholar]
- IUPAC, 2017. Task Group on Atmospheric Chemical Kinetic Data Evaluation. http://iupac.pole-ether.fr/ (accessed 10–2-17).
- Jenkin ME, Watson LA, Utembe SR, Shallcross DE, 2008. A Common Representative Intermediates (CRI) mechanism for VOC degradation. Part 1: Gas phase mechanism development. Atmospheric Environment 42, 7185–7195. [Google Scholar]
- JPL, 2015. Chemical Kinetics and Photochemical Data for Use in Atmospheric Studies, Evaluation Number 18, publication 15–10. National Aeronautics and Space Adminisitration, Jet Propulsion Laboratory, Pasadena, CA. [Google Scholar]
- Kang D, Heath N, Foley K, Bash J, Roselle S, Mathur R, 2018. On the Relationship Between Observed NLDN Lightning Strikes and Modeled Convective Precipitation Rates: Parameterization of Lightning NOx Production in CMAQ. Springer International Publishing, Cham, pp. 413–419. [Google Scholar]
- Le Person A, Eyglunent G, Daële V, Mellouki A, Mu Y, 2008. The near UV absorption cross-sections and the rate coefficients for the ozonolysis of a series of styrene-like compounds. Journal of Photochemistry and Photobiology A: Chemistry 195, 54–63. [Google Scholar]
- Lee BH, Mohr C, Lopez-Hilfiker FD, Lutz A, Hallquist M, Lee L, Romer P, Cohen RC, Iyer S, Kurtén T, Hu W, Day DA, Campuzano-Jost P, Jimenez JL, Xu L, Ng NL, Guo H, Weber RJ, Wild RJ, Brown SS, Koss A, de Gouw J, Olson K, Goldstein AH, Seco R, Kim S, McAvey K, Shepson PB, Starn T, Baumann K, Edgerton ES, Liu J, Shilling JE, Miller DO, Brune W, Schobesberger S, D’Ambro EL, Thornton JA, 2016. Highly functionalized organic nitrates in the southeast United States: Contribution to secondary organic aerosol and reactive nitrogen budgets. Proceedings of the National Academy of Sciences 113, 1516–1521. [DOI] [PMC free article] [PubMed] [Google Scholar]
- Luecken DJ, Hutzell WT, Gipson GL, 2006. Development and analysis of air quality modeling simulations for hazardous air pollutants. Atmospheric Environment 40, 5087–5096. [Google Scholar]
- Luecken DJ, Hutzell WT, Strum ML, Pouliot GA, 2012. Regional sources of atmospheric formaldehyde and acetaldehyde, and implications for atmospheric modeling. Atmospheric Environment 47, 477–490. [Google Scholar]
- Luecken DJ, Waterland L, Papasavva R, Taddonio S, Hutzell KN, Rugh WT, Andersen JP, O. S, 2009. Ozone and TFA Impacts in North America from Degradation of 2,3,3,3-Tetrafluoropropene (HFO-1234yf), A Potential Greenhouse Gas Replacement. Environmental Science & Technology 44, 343–348 [DOI] [PubMed] [Google Scholar]
- Orlando JJ, Tyndall GS, 2002. Mechanisms for the Reactions of OH with Two Unsaturated Aldehydes: Crotonaldehyde and Acrolein. The Journal of Physical Chemistry A 106, 12252–12259. [Google Scholar]
- Pye HOT, Pouliot GA, 2012. Modeling the role of alkanes, polycyclic aromatic hydrocarbons, and their oligomers in secondary organic aerosol formation. Env. Sci. Tech, 46 (111), 6041–6047. [DOI] [PubMed] [Google Scholar]
- Environ Ramboll, 2016. User’s Guide Comprehensive Air Quality Model with Extensions, version 6.40, Novato, CA, http://www.camx.com/files/camxusersguide_v6-40.pdf
- Sander R, 2015. Compilation of Henry’s law constants (version 4.0) for water as solvent. Atmos. Chem. Phys 15, 4399–4981. [Google Scholar]
- Shi J, Bernhard MJ, 1997. Kinetic studies of Cl-atom reactions with selected aromatic compounds using the photochemical reactor-FTIR spectroscopy technique. International Journal of Chemical Kinetics 29, 349–358. [Google Scholar]
- Simon H, Beck L, Bhave P, Divita F, Hsu Y, Luecken D, Mobley D, Pouliot G, Reff A, Sarwar G, Strum M, 2010. The development and uses of EPA’s SPECIATE database Atmospheric Pollution Research 1, 196–206. [Google Scholar]
- Stutz J, Ezell MJ, Ezell AA, Finlayson-Pitts BJ, 1998. Rate Constants and Kinetic Isotope Effects in the Reactions of Atomic Chlorine with n-Butane and Simple Alkenes at Room Temperature. The Journal of Physical Chemistry A 102, 8510–8519. [Google Scholar]
- Teruel MA, Blanco MB, Luque GR, 2007. Atmospheric fate of acrylic acid and acrylonitrile: Rate constants with Cl atoms and OH radicals in the gas phase. Atmospheric Environment 41, 5769–5777. [Google Scholar]
- Tuazon EC, Alvarado A, Aschmann SM, Atkinson R, Arey J, 1999. Products of the Gas-Phase Reactions of 1,3-Butadiene with OH and NO3 Radicals. Environmental Science & Technology 33, 3586–3595. [Google Scholar]
- U.S. Environmental Protection Agency, 2015. Technical Support Document, EPA’s 2011 National-scale Air Toxics Assessment; Office of Air Quality, Planning, and Standards, Research Triangle Park, NC. https://www.epa.gov/sites/production/files/2015-12/documents/2011-nata-tsd.pdf
- Whitten GZ, Heo G, Kimura Y, McDonald-Buller E, Allen DT, Carter WPL, Yarwood G, 2010. A new condensed toluene mechanism for Carbon Bond: CB05-TU. Atmospheric Environment 44, 5346–5355. [Google Scholar]
- Yarwood G, Rao S, Yocke M, Whitten GZ, 2005. Updates to the Carbon Bond Mechanism: CB05. Final Report to the US Environmental Protection Agency, RT-0400675. Yocke and Company, Novato, CA. [Google Scholar]
- Yarwood G, Whitten GZ, Jung J, 2010. Development, Evaluation and Testin gof Version 6 of the Carbon Bond Chemical Mechanism (CB6). Final Report prepared for the Texas Commision on Environmental Quality by ENVIRON Internal Corp., Novato, CA, Sept 22, 2010. [Google Scholar]
- Yarwood G, Heo G, Carter WPL, Whitten GZ, 2012. Experimental chamber experiments to evaluate NOx sinks and recylcing in atmospheric chemical mechanisms. Final report for AQRP project 10–042, prepared by ENVIRON International Corp., Novato, CA, Feb. 17, 2012. [Google Scholar]
Associated Data
This section collects any data citations, data availability statements, or supplementary materials included in this article.


