

Abstract
Complex I is the largest and most intricate of the protein complexes of mitochondrial electron transport chain (ETC). This L-shaped enzyme consists of a peripheral hydrophilic matrix domain and a membrane-bound orthogonal hydrophobic domain. The interfacial region between these two arms is known to be critical for binding of ubiquinone moieties and has also been shown to be the binding site of Complex I inhibitors. Knowledge on specific roles of the ETC interfacial region proteins is scarce due to lack of knockout cell lines and animal models. Here we mutated nuclear encoded NADH dehydrogenase [ubiquinone] iron-sulfur protein 2 (NDUFS2), one of three protein subunits of the interfacial region, in a human embryonic kidney cell line 293 using a CRISPR/Cas9 procedure. Disruption of NDUFS2 significantly decreased cell growth in medium, Complex I specific respiration, glycolytic capacity, ATP pool and cell-membrane integrity, but significantly increased Complex II respiration, ROS generation, apoptosis, and necrosis. Treatment with idebenone, a clinical benzoquinone currently being investigated in other indications, partially restored growth, ATP pool, and oxygen consumption of the mutant. Overall, our results suggest that NDUFS2 is vital for growth and metabolism of mammalian cells, and respiratory defects of NDUFS2 dysfunction can be partially corrected with treatment of an established mitochondrial therapeutic candidate. This is the first report to use CRISPR/Cas9 approach to construct a knockout NDUFS2 cell line and use the constructed mutant to evaluate the efficacy of a known mitochondrial therapeutic to enhance bioenergetic capacity.
Keywords: Electron transport chain, Complex I, CRISPR/Cas9, respiration, oxygen consumption, glycolysis, ATP synthesis, apoptosis, necrosis, ROS, idebenone
1. INTRODUCTION
Mitochondria are canonically known as the powerhouses of the cell and generate most of the cell’s supply of adenosine triphosphate (ATP) through oxidative phosphorylation (OXPHOS) via the electron transport chain (ETC). The mammalian mitochondrial ETC consists of five transmembrane protein complexes (I-V). NADH:ubiquinone oxidoreductase (Complex I; EC 1.6.5.3) is the largest of the multimeric complexes of ETC [1] and catalyzes the first step of mitochondrial OXPHOS. Complex I is responsible for transferring electrons from NADH to ubiquinone via flavin mononucleotide (FMN) and iron-sulfur clusters [2, 3].
Mammalian Complex I is an L-shaped structure of which, its hydrophilic peripheral arm protrudes into the mitochondrial matrix while its hydrophobic orthogonal arm is embedded in the lipid bilayer of the inner mitochondrial membrane [4–6]. The redox reaction involving the transfer of electrons from NADH to ubiquinone takes place in the peripheral matrix arm, whereas the proton transfer process takes place in the orthogonal membrane arm [7]. The interface region between the matrix arm and the membrane arm is believed to be critical for the function of Complex I enzyme as this (interface) region constitutes a large quinone or inhibitor binding pocket [8, 9]. The interface region is comprised of three major core subunits, namely, NADH dehydrogenase [ubiquinone] iron-sulfur protein 2 (NDUFS2 or 49 kDa), NADH dehydrogenase [ubiquinone] iron-sulfur protein 7 (NDUFS7 or PSST), and NADH dehydrogenase 1 (ND1). Inhibitors in particular bind to the interfacial region between matrix and membrane arms. The large cleft formed by NDUFS2 and NDUFS7 subunits is the site where ubiquinone is reduced by electrons from the terminal Fe-S cluster [10, 11]. Therefore, the interfacial juncture between the peripheral and membrane domains appears to be a “critical region” or a “hot spot” for the binding of inhibitors and ubiquinone.
Various knockout cell models have been used to characterize the involvement of 25 accessory subunits of Complex I for the assembly of this complex and for cell viability [12]. Nevertheless, more work remains to be completed to disclose the true association of Complex I and its interface region to cellular respiration, metabolism, and mitochondrial diseases. To date, suitable knockout models that allow for thorough examinations of interface region of Complex I or its core subunit NDUFS2 have not been created. In this study, we successfully used a CRISPR/cas9 approach to mutate NDUFS2 of a human cell line, HEK293, and used this mutant to elucidate the importance of this protein for in vitro growth, cell-membrane integrity, generation of reactive oxygen species (ROS), apoptosis, glycolysis, ATP synthesis, and respiration.
2. MATERIALS AND METHODS
2.1. Cell lines and culture conditions.
Human embryonic kidney cell line 293 (HEK293) was kindly provided by Dr. Joseph Ruiz at Enzerna Biosciences (Raleigh, NC). Media and reagents for growing and maintaining cells were purchased from Life Technologies Corporation (Carlsbad, CA). The cells were maintained in Dulbecco’s Modified Eagle’s medium (DMEM) supplemented with 10% (by volume) fetal bovine serum and 1% penicillin-streptomycin. Cells were sustained in a humidified incubator at 37ºC and 5% CO2. A 0.25% trypsin-EDTA solution was used for detachment of cells. One Shot Stbl3 Chemically Competent cells of Escherichia coli (Life Technologies Corporation) were used for constructing the mutagenesis plasmid. Bacteria carrying the plasmids were maintained in Luria Bertani (LB; Sigma-Aldrich, St. Louis, MO) agar or broth, and sustained in a humidified incubator at 37ºC.
2.2. Construction and validation of NDUFS2 mutant.
Single guide RNA (sgRNA) sequences were designed, purchased from Integrated DNA Technologies (Skokie, IL), and cloned into plasmid px458 (Addgene, Watertown, MA). HEK293 cells were transfected with recombinant px458 plasmid using transfection reagent Xfect (Takara Bio USA Inc, Mountain View, CA). Clones with mutation in NDUFS2 were picked using procedures described elsewhere [13] and validated by Western immunoblotting using rabbit polyclonal antibody to NDUFS2 (Cat# PA522364; Life Technologies Corporation, Carlsbad, CA) and rabbit polyclonal antibodies to ß-Actin (Cat# ab8227, Abcam Inc, Cambridge, MA). A clone missing NDUFS2 was chosen for further work and designated as HEK293△NDUFS2 (Fig. 1).
Figure 1. Construction of the NDUFS2 mutant.
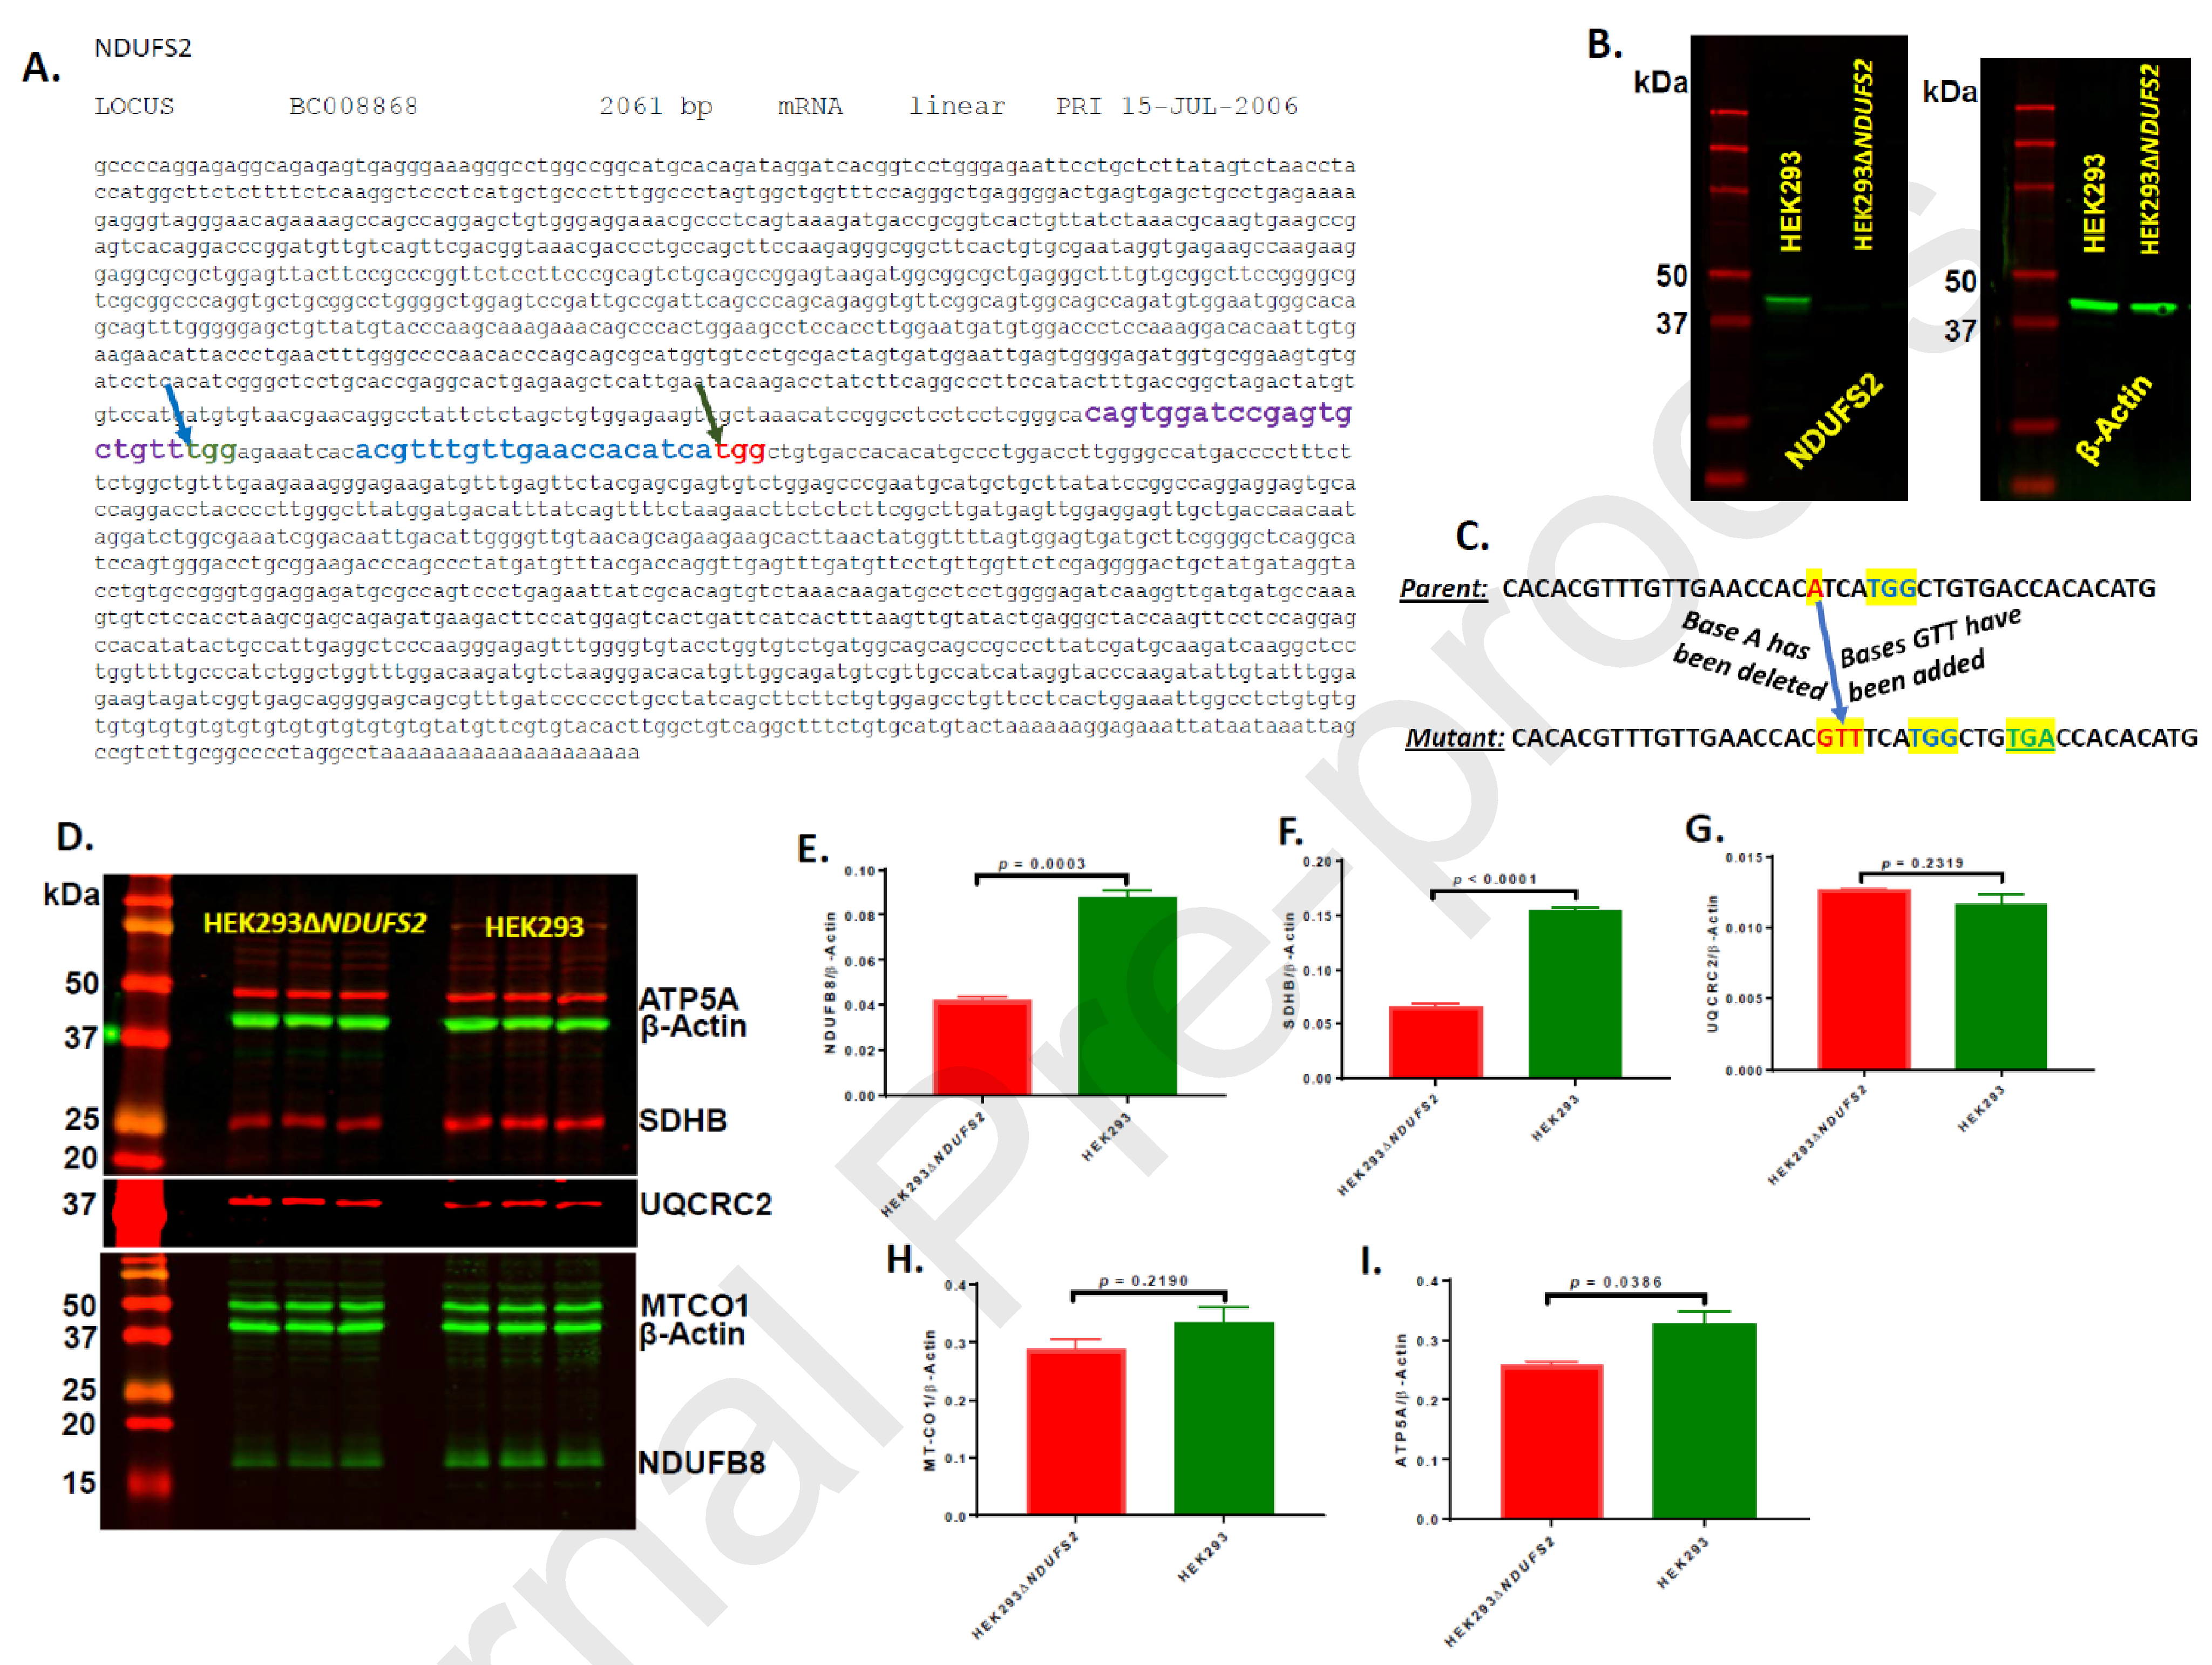
The gene sequence of NDUFS2 with CRISPR targeting sites is shown (A). The sgRNA and PAM sequences predicted by the online CRISPOR program are depicted in purple and green colors, respectively; the specific site for mutation (at 970-bp) is shown with a blue-arrow. The sgRNA and PAM sequences predicted by the online idtdna program are depicted in blue and red colors, respectively; the specific site for mutation (at 1002-bp) is shown with a green-arrow. Expression of NDUFS2 protein is shown (B). The protein extracts reacted with rabbit polyclonal antibodies to NDUFS2 and rabbit polyclonal antibodies to ß-Actin are shown. The DNA level recombination events in the genome of the mutant are illustrated (C). The targeted PAM sequence of TGG is shown highlighted and in blue color. The base A (highlighted and in red color) of the parent has been replaced with bases GTT (highlighted and in red color) in the mutant. These events generated a TGA stop codon (highlighted and in green color) downstream of the PAM sequence of mutant genome. Expression of representative subunits from all five ETC complexes are shown (D – I). The expression of NDUFB8 (complex I; D and E), SDHB (complex II; D and F), UQCRC2 (complex III; D and G), MTCO1 (complex IV; D and H), and ATP5A (complex V; D and I) were normalized to the expression of ß-Actin.
The NDUFS2 DNA region including the targeted mutation site was PCR amplified using the primers shown in Table-1 and sequenced by Sanger Sequencing using the same primers. Moreover, the DNA regions encompassing the top three off-targets were PCR amplified and sequenced using the primers shown in Table 1.
Table 1.
Targeted mutagenesis site, possible off-target sites, the respective protospacer adjacent motif (PAM) sequences, and forward (F) and reverse (R) oligonucleotide primers used for PCR amplification and DNA sequencing.
| Guide strand | PAM | Chromosome in human genome | Oligo primers used in sequencing (5’-3’) |
|---|---|---|---|
| Targeted mutagenesis site | |||
| ACGTTTGTTGAACCACATCA | TGG | 1 | GGAAGCCTCCACCTTGGAAT (F) CCAATGTCAATTGTCCGATT (R) |
| Possible off-target sites | |||
| ACCTGTGCTGAACCGCATCA | CGG | 11 | ACGTTTGTTGAACCACATCA (F) ACGTTTGTTGAACCACATCA (R) |
| AC-TTTGATGAACCACATCA | TGG | 12 | ACGTTTGTTGAACCACATCA (F) ACGTTTGTTGAACCACATCA (R) |
| ATCTTTGTCTAACCACATCA | AAG | 17 | ACGTTTGTTGAACCACATCA (F) ACGTTTGTTGAACCACATCA (R) |
Expression of protein subunits representative to each of the five ETC complexes was examined by Western immunoblotting using Total OXPHOS Human WB Antibody Cocktail (Cat# ab110411, Abcam). Since the expression of complexes I and IV subunits was not clearly visible in Western blots with this antibody, the expression of these two complexes was examined separately by Western immunoblotting using antibodies to NDUFB8 (complex I; Cat# ab192878, Abcam) and MT-CO1 (complex IV; Cat# ab203912, Abcam).
2.3. Cell growth and metabolism.
To measure the cell proliferation of parent HEK293 and mutant HEK293△NDUFS2, aliquots of 50,000 cells were introduced into 75 cm2 flasks each carrying 25 ml growth media and cell numbers were quantified in triplicates after 4 and 6 days of incubation. Membrane porousness of cell lines was assessed using Mitochondrial ToxGlo Assay (Cat# G8000; Promega Corporation, Madison, WI). This assay is based on the differential measurement of a biomarker associated with changes in cell membrane integrity relative to vehicle-treated control cells during short exposure periods. Cell membrane integrity is assessed by measuring the presence or absence of a distinct protease activity associated with necrosis using a fluorogenic peptide substrate (bis-AAF-R110) to measure “dead cell protease activity”. The bis-AAF-R110 substrate cannot cross the intact membrane of live cells and therefore gives insignificant signal with viable cells, relative to non-viable cells. ROS generation was measured using ROS-Glo H2O2 Assay (Cat# G8820; Promega). Apoptosis and necrosis were assessed using RealTime-Glo Annexin V Apoptosis and Necrosis Assay (Cat# JA1011; Promega). Extracellular Acidification Rate (ECAR) was determined with an Agilent Seahorse XFe96 analyzer [14, 15], and glycolysis and glycolytic capacity per 20,000 cells were calculated as described elsewhere [15]. Oxygen Consumption Rate (OCR) of saponin-permeabilized cells was assayed with an Agilent Seahorse XFe96 analyzer, and basal respiration, reserve respiratory capacity and maximal respiratory capacity were calculated as described elsewhere [15]. Seahorse cell culture plates were pre-coated the with Cell-Tak (Corning, Cat. # 354240) as per the vendor guidelines (5991-7153EN.pdf(agilent.com) prior to plating the cells. Cellular ATP pool was measured using Mitochondrial ToxGlo Assay (Promega Corporation, Madison, WI). Oxygen consumption of saponin-permeabilized cells [16] was measured by Oroboros O2k respirometry [17, 18].
2.4. Restoring (rescuing) the impaired growth and respiration the mutant.
Effectiveness of the potential Complex I therapeutic idebenone in restoring the ATP synthesis defects of the mutant HEK293△NDUFS2 was evaluated. In this procedure, mutant cells were cultured in media supplemented with 1 μM of idebenone in 96-well plates at 2,000 cells/well. Fresh media (with or without the therapeutic) were added on days 0, 3 and 5. Cellular ATP pool was assessed on day 6 of incubation by Mitochondrial ToxGlo Assay. Mutant cells were also cultured in 6-well plates at 2000 cells/well in medium supplemented 0.5, 1, 5, or 10 μM of idebenone. Fresh media containing the drug was added on days 3, 6 and 9, and the cell counts in wells of triplicates was determined following 10 days incubation. Efficacy of idebenone in improving respiration of permeabilized mutant cells was measured by O2k respirometry as described above with the following modification: subsequent to glutamate+malate injection, idebenone was injected into chambers at 1 μM final concentration. The control groups received DMSO. Moreover, effectiveness of idebenone in improving OCR of permeabilized cells was assessed with the Agilent Seahorse XFe96 analyzer as outlined above with the following modification: cells grown overnight in XFe96 culture plates were washed, and glucose-free DMEM (pH 7.4) supplemented with 10 mM glucose, 10 mM sodium pyruvate, and 2 mM glutamine, 20 μg/ml saponin and 1 μM of idebenone was added to the wells prior to incubating for 40 min at 37ºC in a CO2-free station. The control wells received the same medium added with DMSO but without idebenone.
2.5. Statistical analyses.
Student’s t-tests were performed using Microsoft Excel program (Microsoft, Redmond, WA) or GraphPad Prism 7 (GraphPad Software, San Diego, CA) to compare the means of the parent versus mutant or vehicle control versus idebenone treatment. The ECAR data were analyzed by repeated measures ANOVA using GraphPad Prism 8. Mean differences between groups were considered statistically significant at p < 0.05.
3. RESULTS
3.1. Construction of the recombinant mutant cell line HEK293△NDUFS2.
The 2061 bp long nucleotide sequence of Homo sapiens NDUFS2 (GenBank locus ID BC008868) was used as the template for designing sgRNA sequences. Two separate sites of the gene NDUFS2 on HEK293 genome, independently from each other, were targeted for mutating based on the predictions made by two separate online CRISPR guide tools. One of the tools, the online program of Integrated DNA Technologies (https://www.idtdna.com/site/order/designtool/index/CRISPR_CUSTOM), predicted the 1002-bp site of the forward strand of the gene as the most reliable for mutagenesis with an on-target specificity score of 88% and off-target score of 71% (Fig. 1A). The guide strand predicted by this program for this site was ACGTTTGTTGAACCACATCA that is located right upstream of the protospacer adjacent motif (PAM) sequence TGG. The top and bottom sgRNA sequences for this site in 5’ to 3’ direction were CACCgACGTTTGTTGAACCACATCA and AAACTGATGTGGTTCAACAAACGTc, respectively. A second site for mutagenesis was also chosen based on the prediction of the other online guide tool, named, CRISPOR (http://crispor.tefor.net/). This program predicted the 970-bp site of the forward strand of the gene as reliable for mutagenesis with 87% on-target specificity score (Fig. 1A). The relevant guide strand and PAM sequences predicted by this program for this site were CAGTGGATCCGAGTGCTGTT and TGG, respectively. The top and bottom sgRNA sequences for this site in 5’ to 3’ direction were CACCgCAGTGGATCCGAGTGCTGTT and AAACAACAGCACTCGGATCCACTGc, respectively.
In our efforts to mutate the 970-bp site of NDUFS2, protein expression of 21 individual clones grown from single individual cells were examined by Western immunoblotting. All these 21 clones produced protein profiles exactly similar to the parent strain HEK293 suggesting that none of these clones carried an expected mutation in NDUFS2 gene.
In our efforts to mutate the 1002-bp site of the forward strand of NDUFS2 gene, protein expression of 22 individual clones grown from single individual cells were examined using the same approach by Western immunoblotting. Six of these clones were found missing an approximately 49 kDa protein (Fig. 1B), corresponding to the predicted molecular weight of NDUFS2. One of these clones was chosen for further work and designated HEK293△NDUFS2. We then PCR amplified and sequenced the NDUFS2 region encompassing the CRISPR targeting site (at 1002-bp). The results indicated deletion of one base four bases upstream of the PAM sequence and insertion of three bases at the deletion site (Fig. 1C). These alterations at DNA level led to a frame-shift mutation. As a result, a stop codon had been created four bases downstream of the CRISPR targeting site (Fig 1C). Overall, the INDEL recombination events at the CRISPR targeting site have disrupted the amino acid sequence downstream of the targeting site. These observations justify the Western immunoblot data in Fig. 1B that reflect the total absence of NDUFS2 protein expression in the mutant.
Using the online CRISPR prediction site of the Integrated DNA Technologies, we identified the top three potential off-target sites (Table 1). The DNA regions encompassing these sites were PCR amplified and sequenced. The DNA sequences of these sites of the mutant were similar to those of the parent cell line indicating absence of any off-target genetic alterations in the genome of the mutant.
We then investigated whether mutation in NDUFS2 altered the expression of other subunits of the five ETC complexes. Expression of complex I subunit NDUFB8 (Fig. 1D and 1E) decreased significantly in the mutant (p = 0.0003) suggesting that NDUFS2 expression has direct impact on expression of other subunits of the complex I. Moreover, the expression of complex II subunit SDHB (Fig. 1D and 1F) and complex V subunit ATP5A (Fig. 1D and 1I) decreased significantly in the mutant (p <0.0001 and 0.0386, respectively) suggesting an association in protein expression between complexes I and other ETC complexes. Nevertheless, the expressions of complex III subunit UQCRC2 (Fig. 1D and 1G) and complex IV subunit MT-CO1 (Fig. 1D and 1H) were not different between the parent or the mutant suggesting that mutation did not impact expression of those two subunits/complexes.
3.2. Mutation of NDUFS2 impaired cell-membrane integrity, and increased ROS production, apoptosis and necrosis.
The amount of ROS generated did not differ between the parent and the mutant significantly at 0 h (immediately after addition of the substrate to the reaction; p = 0.3893; Fig. 2A). Nevertheless, the mutant produced 24.7% (p < 0.0001) and 47.1% (p < 0.0001) greater amounts of ROS respectively at 24 and 72 h after addition of the substrate. These observations suggest that disruption of NDUFS2 results in subsequent increases in ROS generation over time.
Figure 2. ROS production, membrane porousness, apoptosis, and necrosis of cell lines.
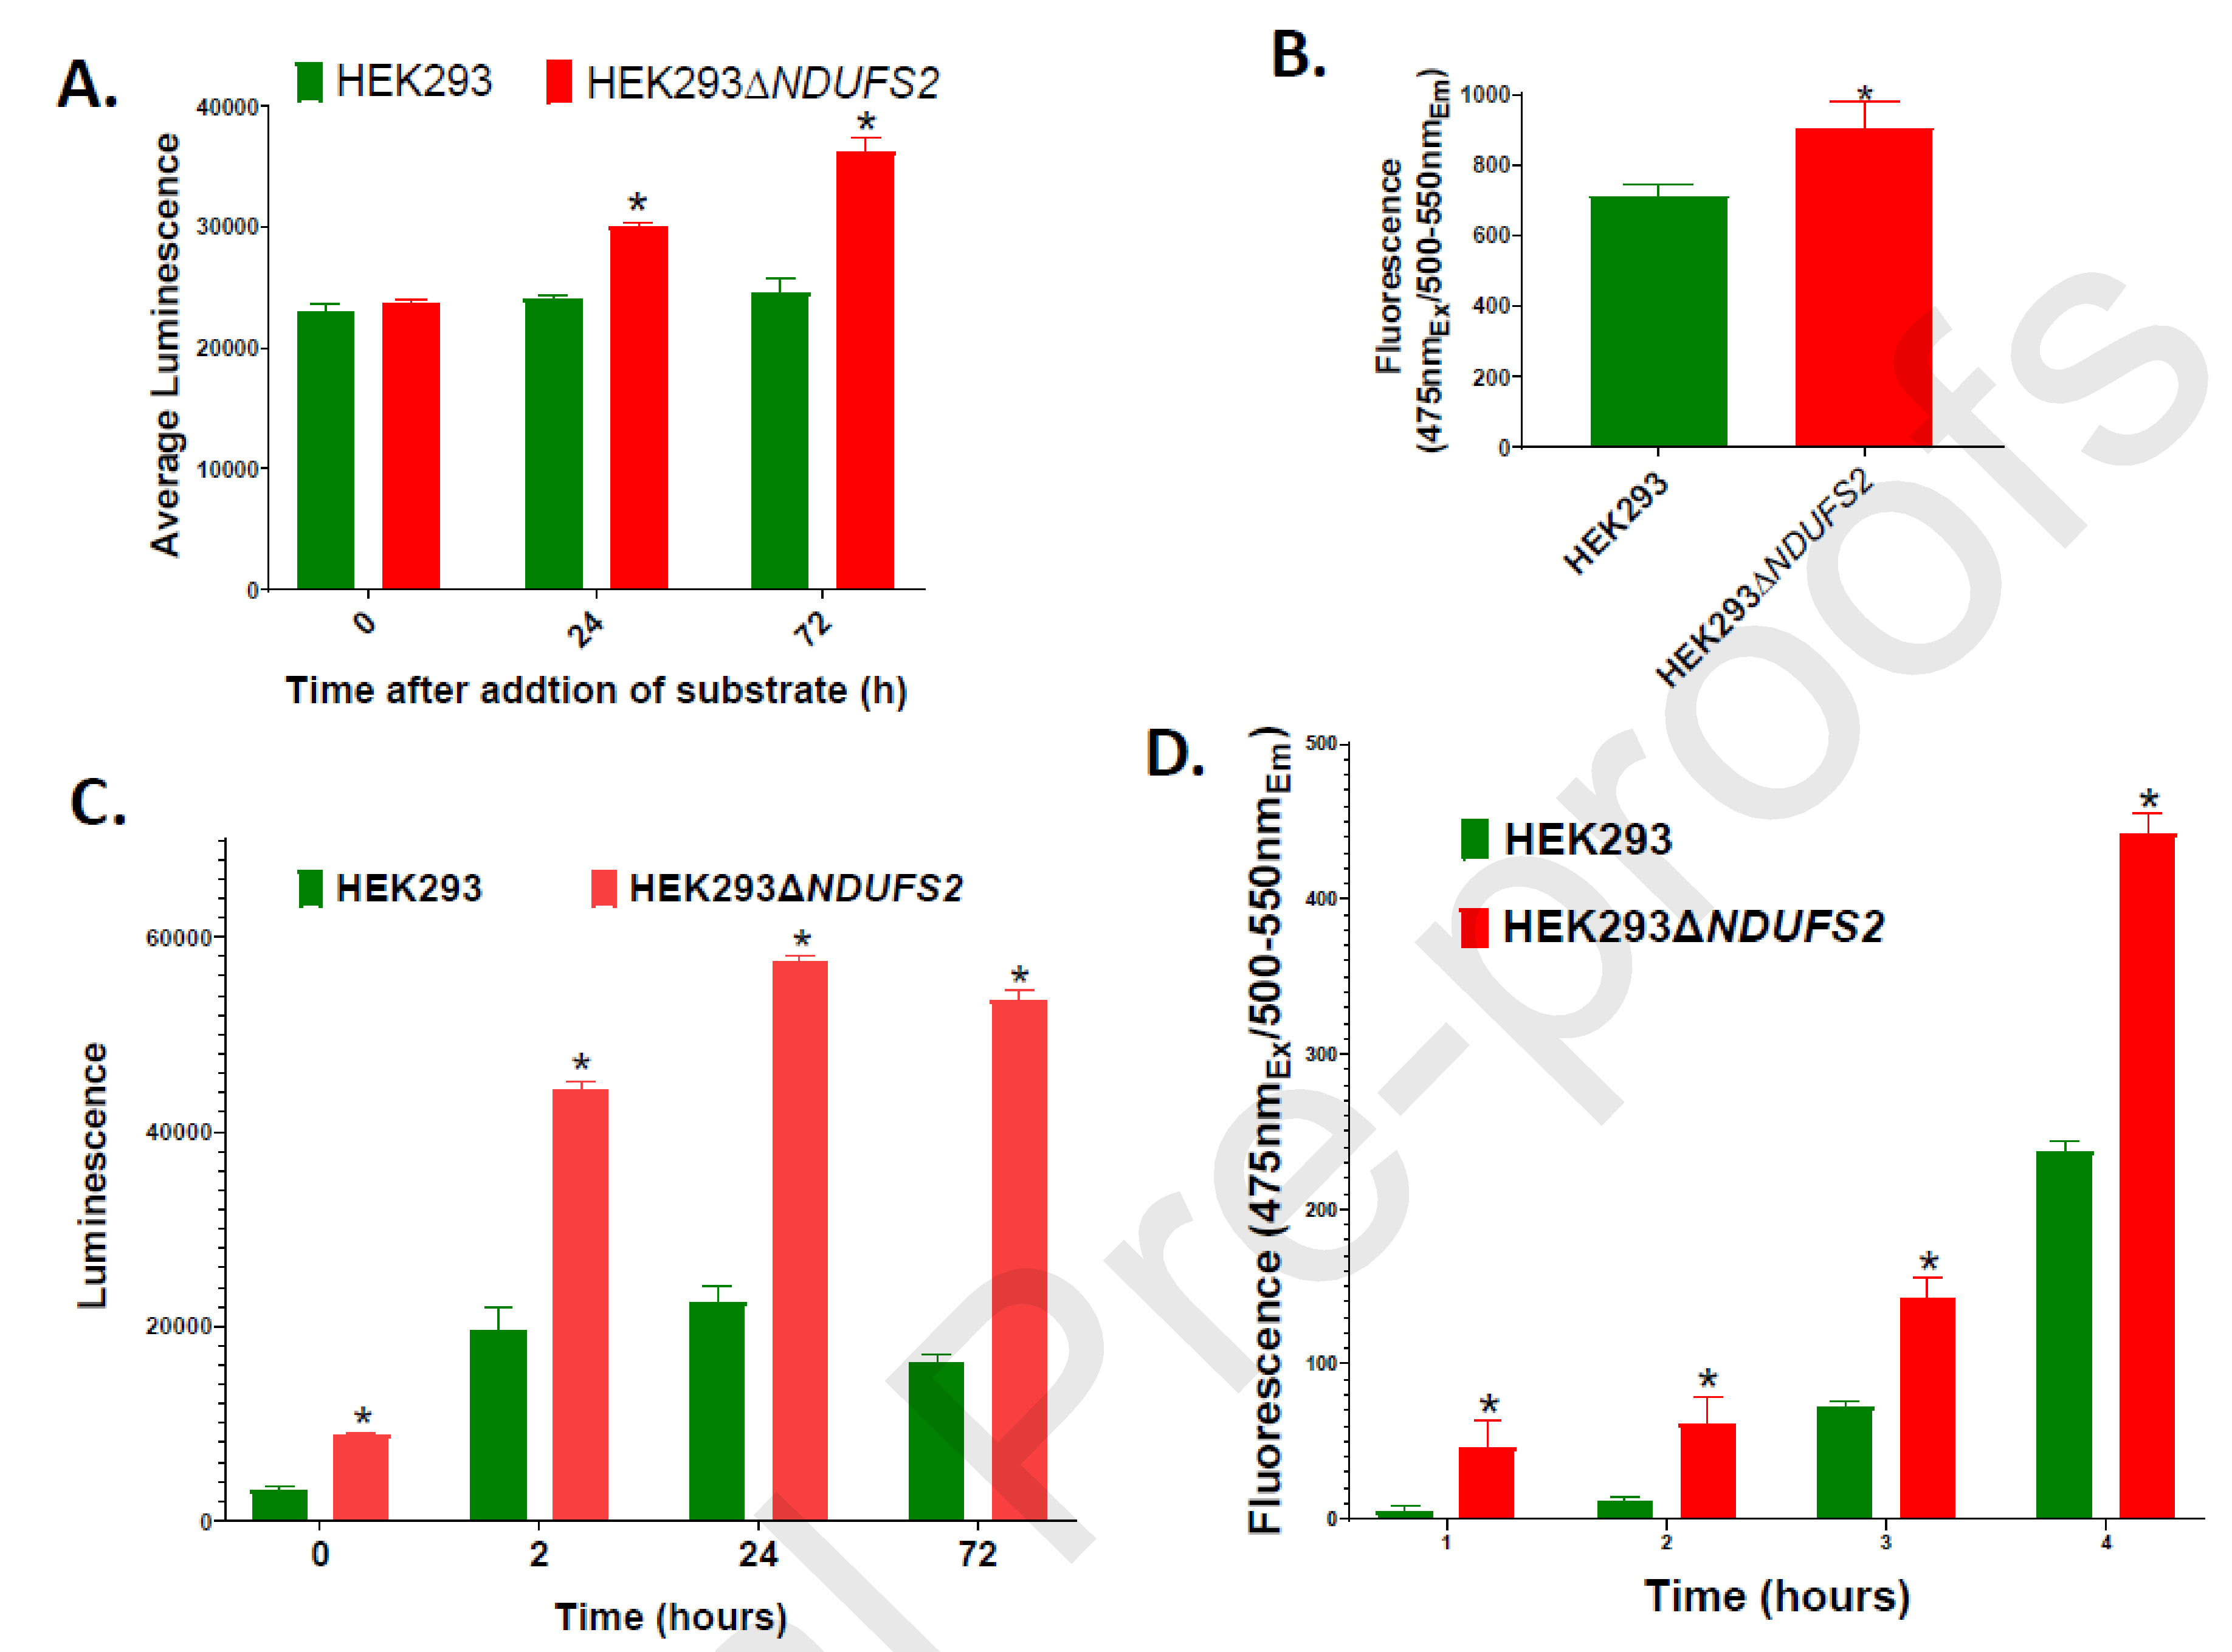
ROS generation measured using ROS-Glo H2O2 Assay is shown (A). The measurements are expressed as total luminescence per 15,000 cells. The mean values were compared between the parent HEK293 and the mutant HEK293△NDUFS2. The p values for the differences between the mean values were 0.3893, < 0.0001, and < 0.0001 respectively at 0, 24, and 72 hours after addition of substrate to the reaction. Membrane porousness measured using Mitochondrial ToxGlo Assay is shown (B). Measurements are expressed as total fluorescence per 10,000 cells (p = 0.027). Apoptosis (C) and necrosis (D) per 15,000 cells measured using RealTime-Glo Annexin V Apoptosis and Necrosis Assay at 0, 2, 24, and 72 hours of incubation are shown. Apoptosis measurements are expressed as total luminescence; the p value for the differences between the mean values was < 0.0001 for each time point. Necrosis measurements are expressed as total fluorescence; the p values for the differences between the mean values were 0.0085, 0.0115, 0.0002, and < 0.0001 respectively at 0, 2, 24, and 72 h post-incubation. The mean values significantly different between two cell lines are indicated by *. Error bars represent the SE of the mean. The number of wells per cell line is n = 12 for each parameter.
Cell membranes of the mutant were 27.7% more porous than those of the parent (p = 0.0221) (Fig. 2B) indirectly indicating increased necrosis and cell death. At all the time points, the mutant displayed significantly increased level of apoptosis (p < 0.0001 for each time point; Fig. 2C). The mutant also showed significantly increased necrosis at each time point (p = 0.0085, 0.0115, 0.0002, and < 0.0001 respectively at 0, 2, 24, and 72 h post-incubation; Fig. 2D). Overall, our findings indicate that disruption of NDUFS2 is associated with weakened cell-membrane integrity, and made the cells more apoptotic and susceptible to necrosis.
3.3. Disruption of NDUFS2 impaired glycolysis and ATP synthesis.
ECAR of intact cells was determined (Fig. 3A). Both glycolysis (p < 0.0001; Fig. 3B) and glycolytic capacity (p < 0.0001; Fig. 3C) decreased significantly in mutant cells. The findings indicate an association between NDUFS2 function and glycolysis. Luminescence data indicated that compared to the parent, the mutant produced 57.6% less amount of ATP (p < 0.0001; Fig. 3D). Impaired ATP synthesis was consistent with suppressed mitochondrial and glycolytic metabolism.
Figure 3. Respiration, glycolysis, and ATP synthesis of cell lines.
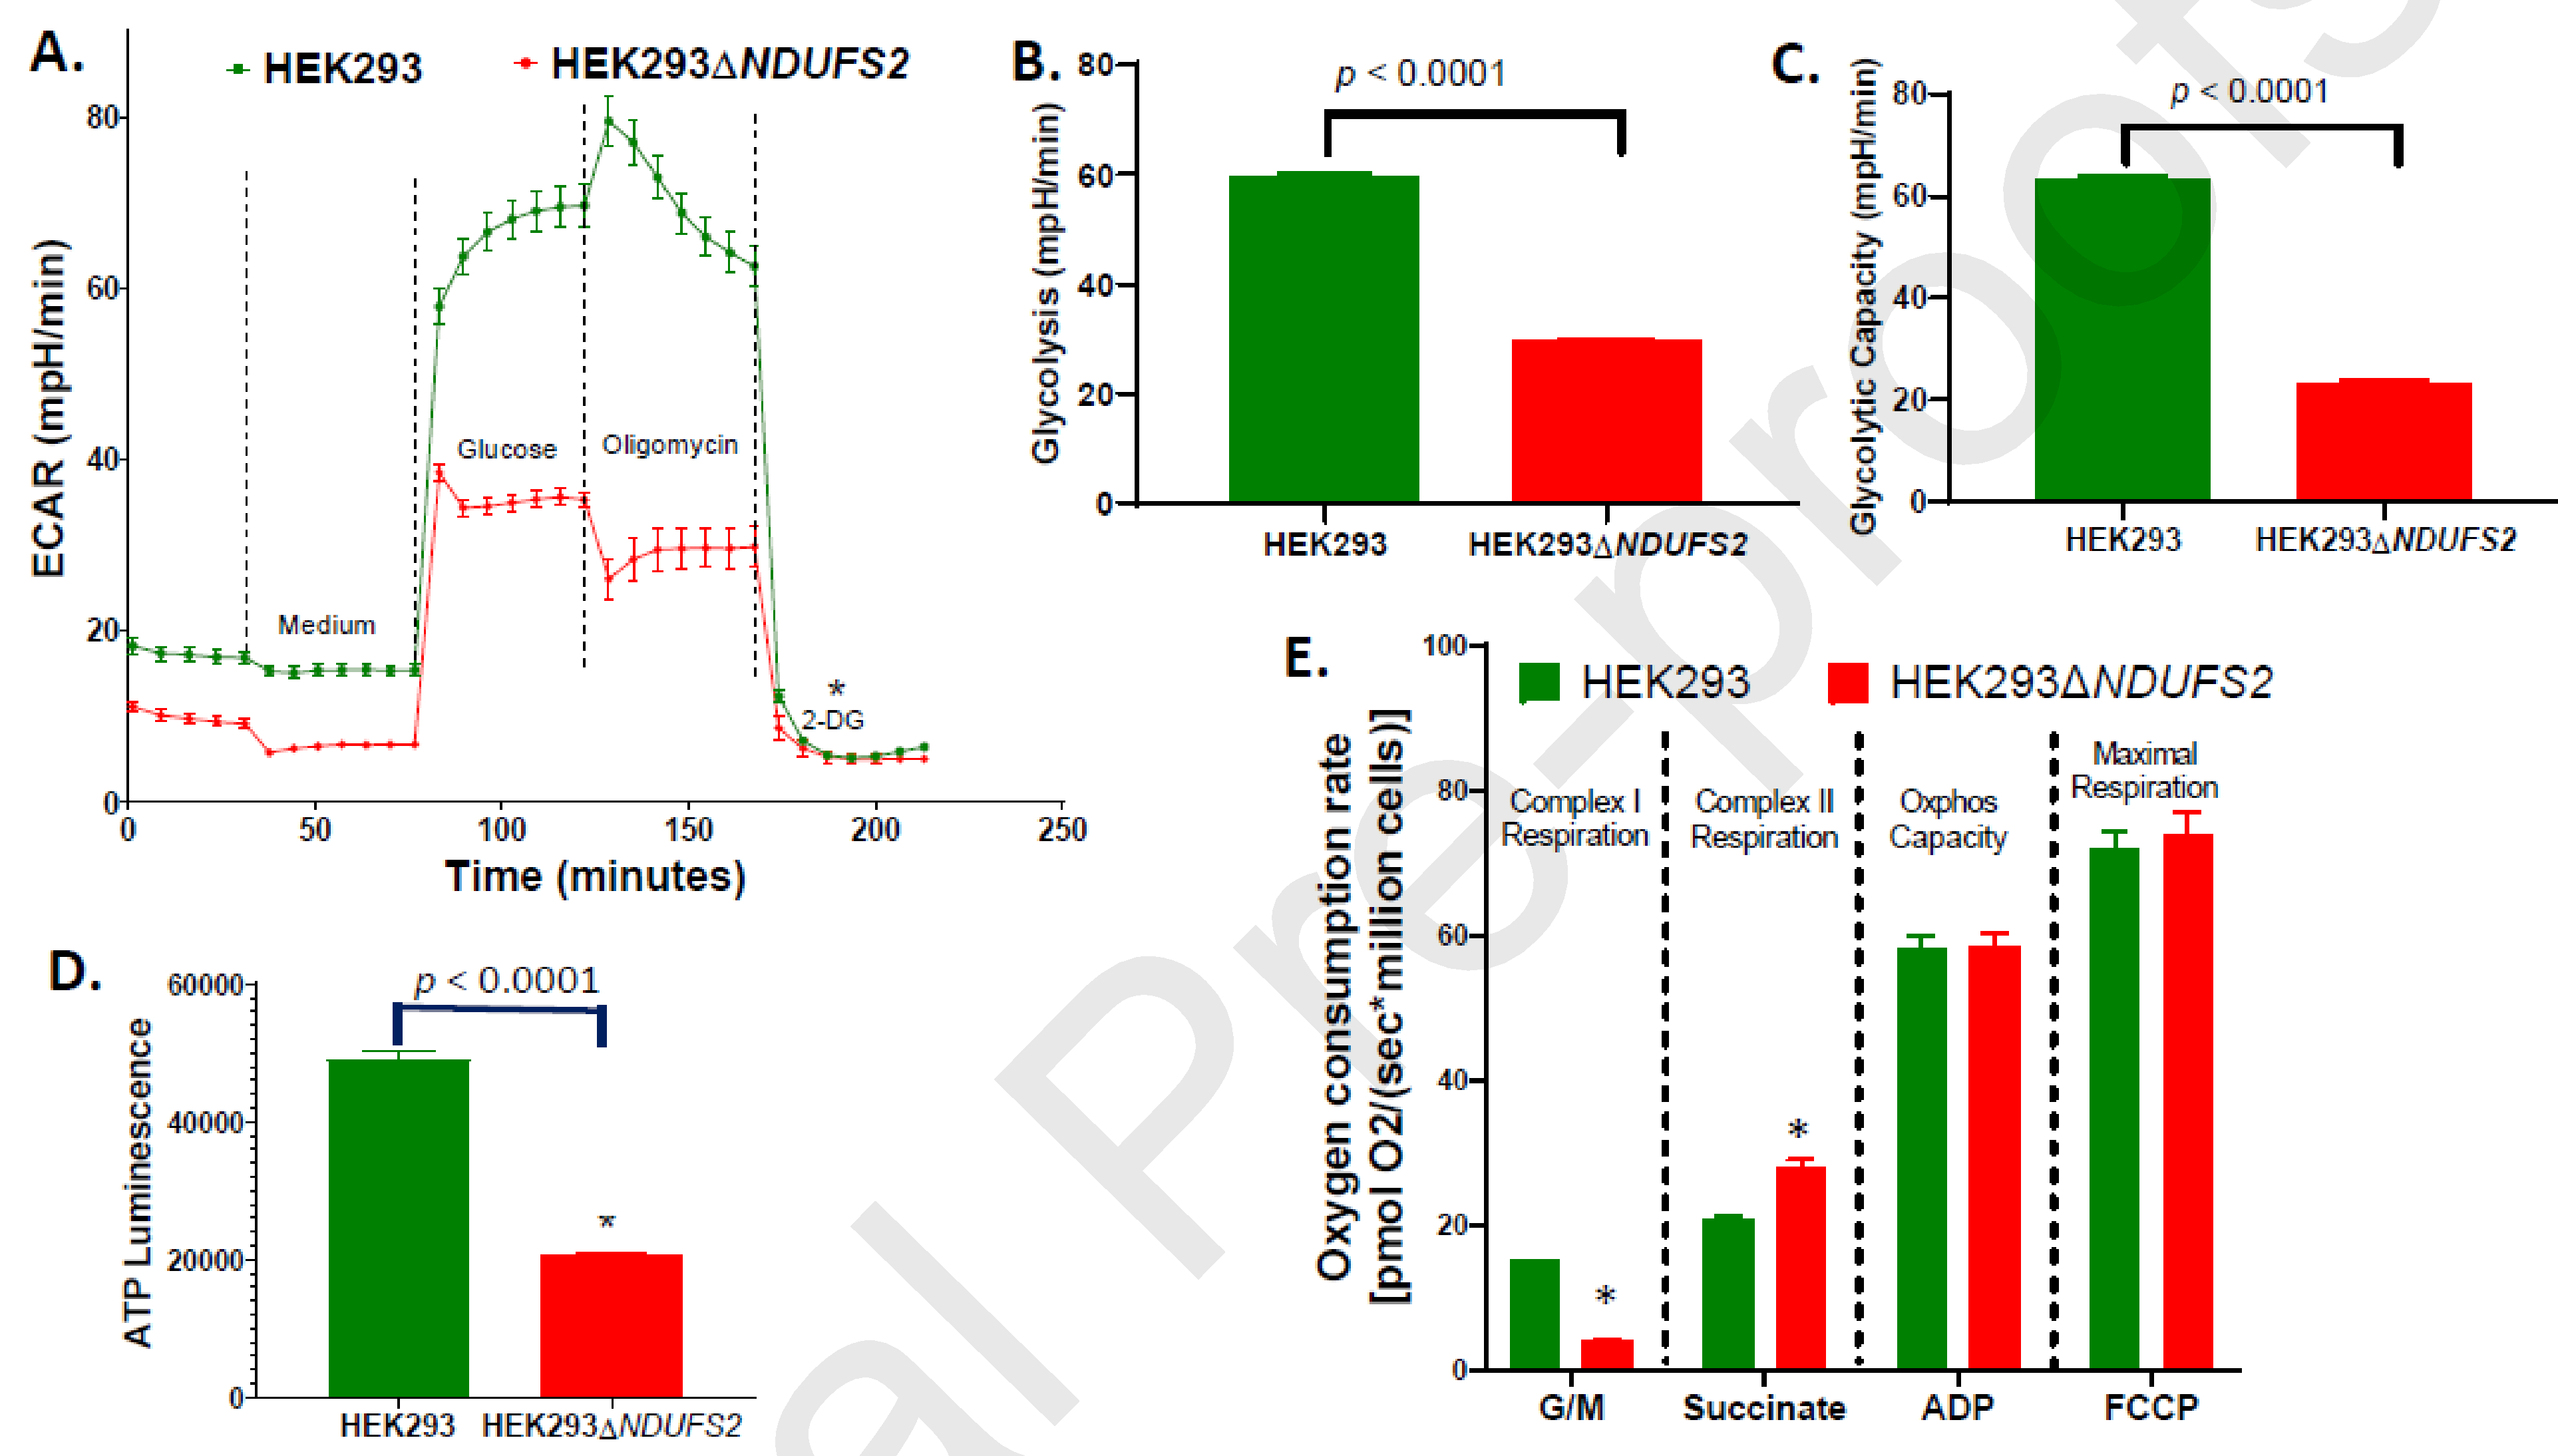
ECAR measured using Agilent Seahorse XFe96 analyzer of 20,000 live cells/well (A), and calculated glycolysis (B) and glycolytic capacity (C) are shown. The mean values were compared between the parent HEK293 and the mutant HEK293△NDUFS2. The number of wells per cell line is n = 12. ATP synthesis of parent and mutant cells measured using Mitochondrial ToxGlo Assay (D) is shown. The measurements are expressed as total luminescence per 10,000 cells. The number of wells per cell line is n = 12. Oxygen consumption measured using Oroboros O2k per million saponin-repermeabilized cells of the parent or the mutant in response to exposure of glutamate-malate (G/M), succinate, ADP, and FCCP is shown (E). The number of chambers per cell line is n = 6. The p values for the differences between the mean values were < 0.0001, 0.001, 0.747, and 0.645 respectively for complex I respiration, complex II respiration, OXPHOS capacity, and maximal respiration. The mean values significantly different between two cell lines are indicated by *. Error bars represent the SE of the mean.
3.4. Disruption of NDUFS2 impaired oxygen consumption.
Oxygen consumption rate was measured using Oroboros Oxygraph 2k. Oxygen consumption was collected at each step along ETC (Fig. 3E). Disruption of NDUFS2 decreased Complex I respiration by 75% (p < 0.0001), highlighting the vitality of this subunit for Complex I respiration. Nevertheless, the Complex II respiration of the mutant increased by 40% (p = 0.001), reflecting a possible compensatory regulation by the Complex II in a scenario of a functional deficiency of Complex I (Fig. 3E). OCR of permeabilized cells was also assessed using an Agilent Seahorse XFe96 Analyzer (Fig 4A). In the mutant, basal respiration (p <0.0001; Fig. 4B) and maximal respiratory capacity (p <0.0001; Fig. 4D) decreased significantly, whereas reserve respiratory capacity decreased numerically (p = 0.2611; Fig 6C). Oroboros O2k and Seahorse OCR assays collectively indicate an impairment of cellular respiration.
Figure 4. Respiration of cell lines measured by Seahorse assay.

Oxygen consumption rate (OCR) was measured using Agilent Seahorse XFe96 of parent HEK293 cells treated DMSO (Parent+DMSO), parent cells treated 1μM idebenone (Parent+ldeb), mutant HEK293△NDUFS2 cells treated DMSO (Mutant+DMSO), and mutant cells treated 1μM idebenone (Mutant+ldeb). OCR per 20,000 permeabilized cells (A), and the calculated basal respiration (B), reserve respiratory capacity (C) and maximal respiratory capacity (D) are shown. The number of wells per cell line is n = 12. The mean OCR values were compared between the parent versus the mutant or DMSO treatment versus idebenone treatment. Error bars represent the SE of the mean.
Figure 6. Restoration or improvements of growth and respiration of cell lines.

Oxygen consumption per million permeabilized cells of the mutant HEK293△NDUFS2 treated with DMSO or idebenone was measured by Oroboros O2k respirometry (A). The number of chambers per cell line is n = 6. The p values for the differences between the mean values of DMSO control versus idebenone treatment were 0.3215, <0.0001, 0.0078, 0.0018, and 0.0046, respectively. Representative O2k oxygraphs of mutant cells treated with DMSO (B top) or 1 μM idebenone (B bottom) are shown. In this assay, permeabilized mutant cells were treated with DMSO or idebenone for 30 min prior to loading them into the O2k chambers. O2 slope neg. [pmol/(s*mL)] presented in red line was collected subsequent to injection of glutamate+malate (G/M), rotenone (Rot), succinate (Succ), ADP, and FCCP into the chamber. ATP pools of the mutant cells treated with idebenone for six days is shown (C). The measurements are expressed as luminescence normalized to the values of DMSO control. The number of wells per cell line is n = 12. The p value for the difference between DMSO control and idebenone treatment was 0.0101. The growth of DMSO or idebenone treated cells was measured (D). The number of cells recovered from the mutant cultures treated with 0.5, 1, or 5 μM idebenone or DMSO control is shown. The number of flasks per cell line is n = 3. The p value for the differences in cell numbers between DMSO control versus treatment with idebenone at 0.5, 1 and 5 μM were 0.0011, 0.9577 and 0.9954, respectively. Oxygen consumption per million permeabilized cells of the parent HEK293 treated with DMSO or idebenone was measured by Oroboros O2k respirometry (E). The number of chambers per cell line is n = 6. The p values for the differences between the mean values of DMSO control versus idebenone treatment were 0.1292, 0.0028, 0.0015, 0.0013, and 0.0023 for complex I respiration, respiration after DMSO/idebenone treatment, complex II respiration, OXPHOS capacity, and maximal respiration. The mean values significantly different between treatments are indicated by *. Error bars represent the SE of the mean.
3.5. Disruption of NDUFS2 impaired growth.
After four days of incubation, 62% fewer number of cells were recovered from the mutant compared to the parent (p = 0.019; Fig. 5A). After six days of incubation, 82% fewer number of cells were recovered from the mutant (p = 0.027; Fig. 5A). The doubling time of the mutant between the days 0 and 4 was 197.4% longer than that of the parent (p = 0.0477; Fig. 5B). Impaired oxygen consumption and glycolysis of the mutant may have decreased the cell proliferation capacity.
Figure 5. Growth of cell lines.
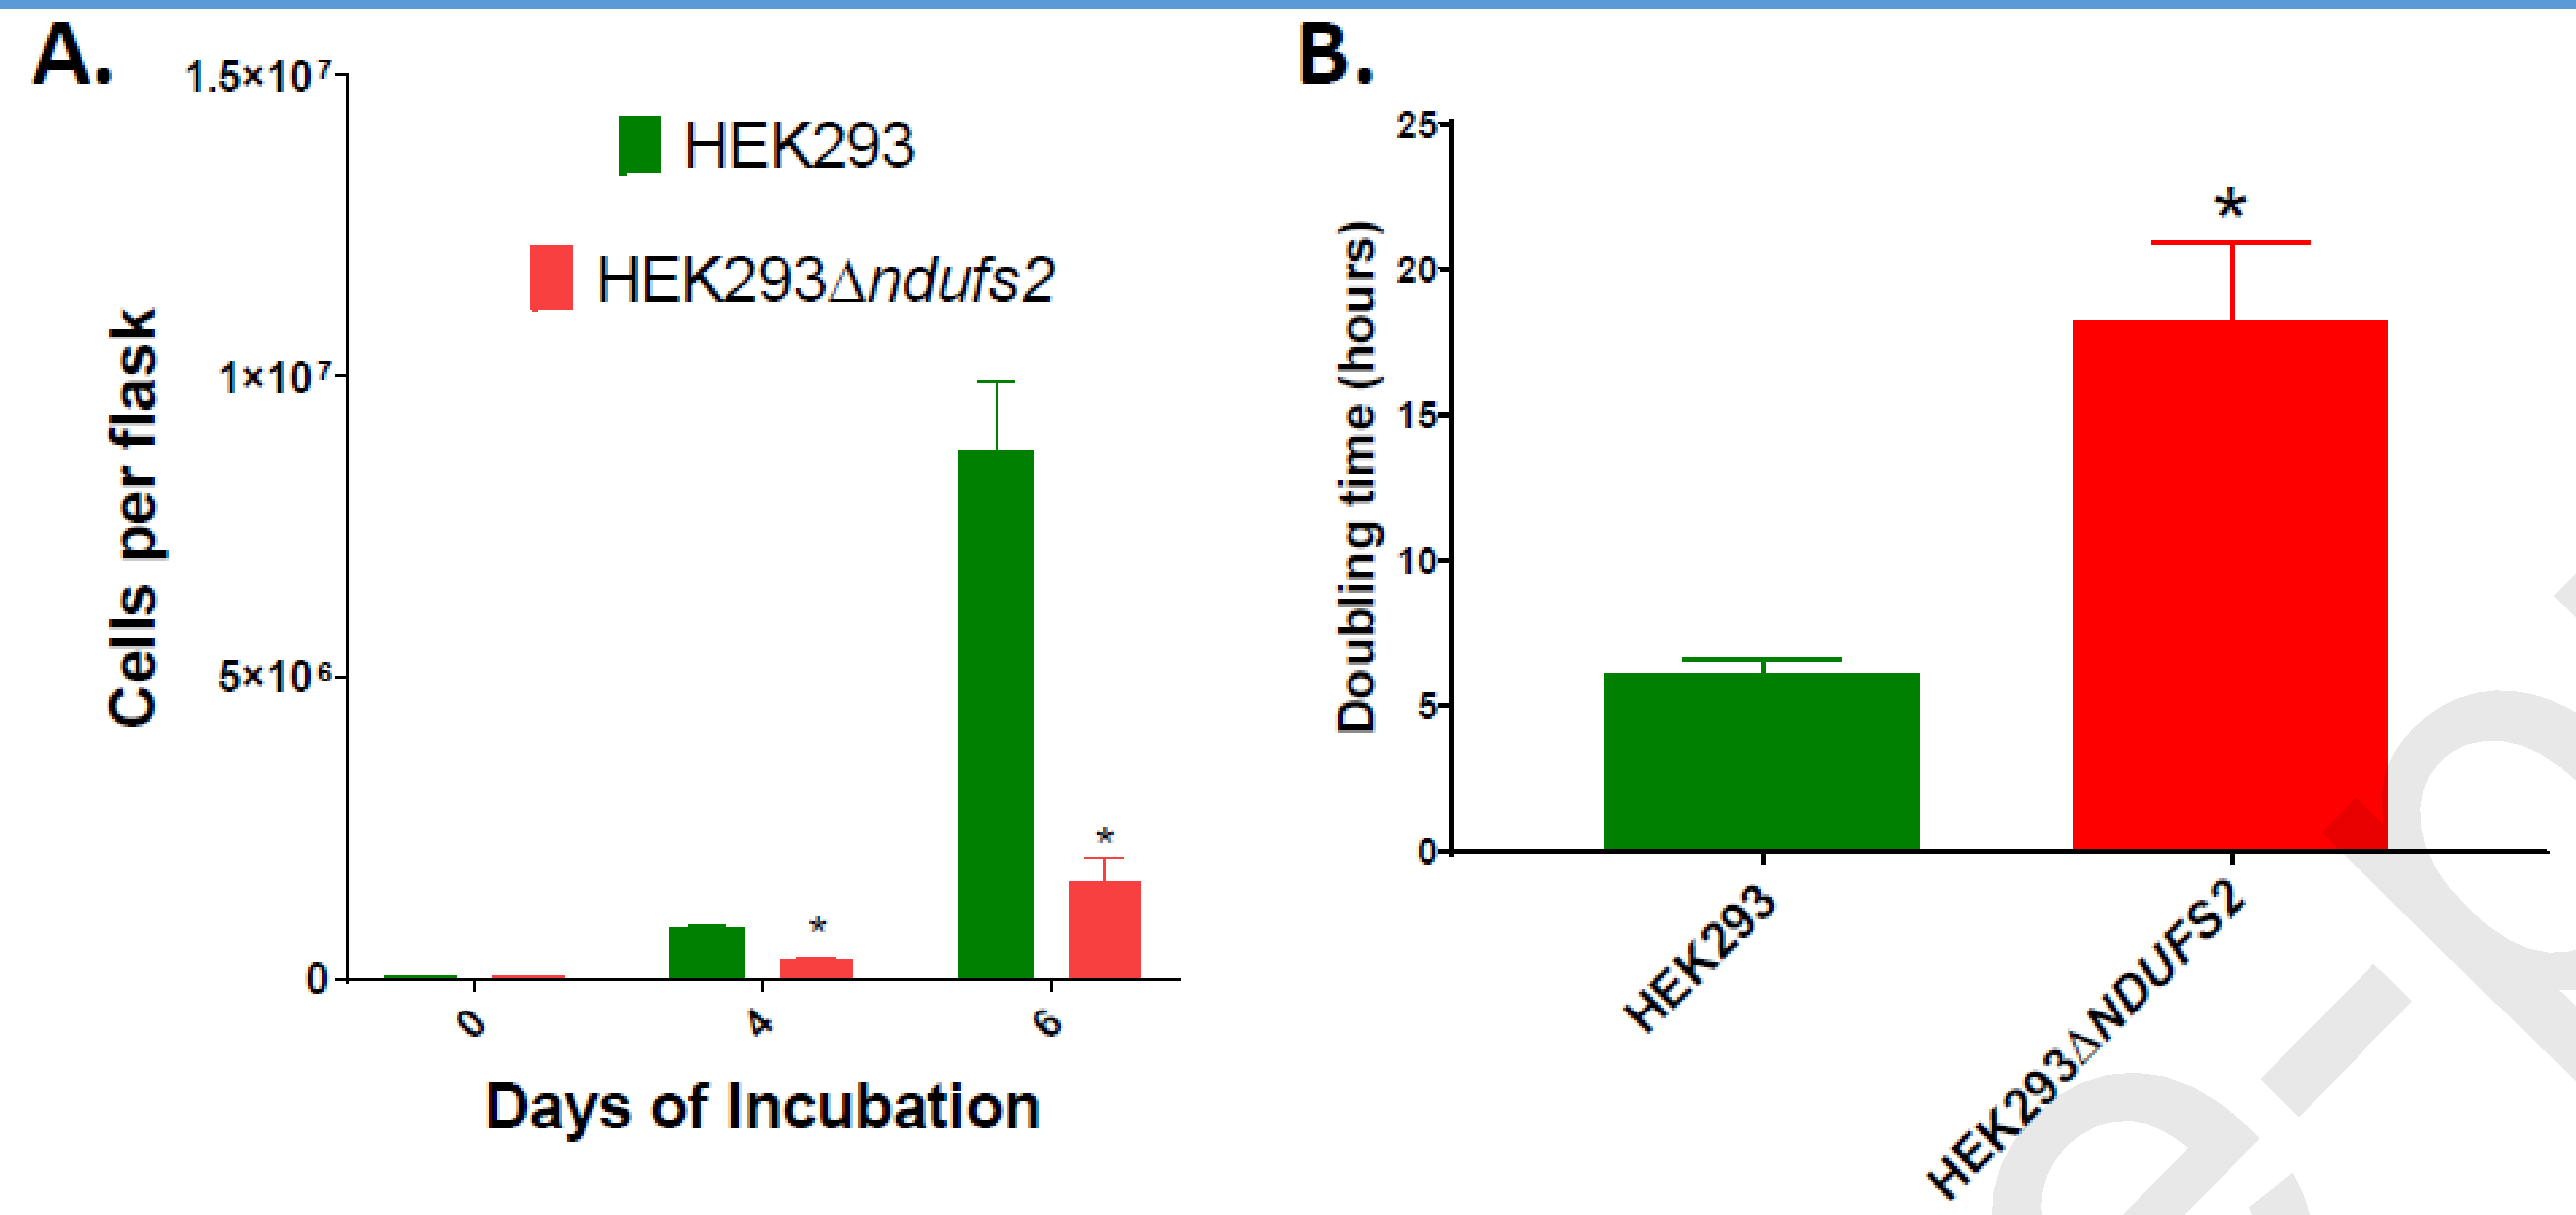
The number of cells harvested after four and six days of culture (A) and doubling times (B) of parent HEK293 and mutant HEK293△DUFS2 cell lines are shown. The p values for the differences between the means of two cell lines were 0.019 for cell numbers at day 4, 0.027 for cell numbers at day 6, and 0.0477 for doubling time. The number of cells recovered from the mutant cultures treated with 0.5, 1, or 5 μM idebenone or DMSO control are shown (C). The p value for the differences in cell numbers between DMSO control versus treatment with idebenone at 0.5, 1 and 5 μM were 0.0011, 0.9577 and 0.9954, respectively. The number of flasks per cell line is n = 3. The mean values significantly different between cell lines/treatments are indicated by *. Error bars represent the SE of the mean.
3.6. Treatment with idebenone restored altered phenotypes of the mutant.
Idebenone is a short-chain benzoquinone with greater hydrophilicity [19], which has shown promise as a therapeutic for mitochondrial dysfunction [19–21]. We tested whether idebenone modified oxygen consumption of mutant cells by Seahorse XFe96 and O2k respirometry. In Seahorse assay, treatment of permeabilized mutant cells with 1 μM idebenone significantly increased basal respiration (p <0.0001; Fig. 4B), reserved respiratory capacity (p = 0.0285; Fig. 4C), and maximal respiratory capacity (p <0.0001; Fig. 4D). In O2k respirometry assay, when idebenone was injected at 1 μM final concentration into the chamber carrying permeabilized mutant cells, Complex I respiration, Complex II respiration, OXPHOS capacity, and maximal respiration were improved significantly (p = <0.0001, 0.0078, 0.0018, and 0.0046, respectively; Fig. 6A). Fig. 6B depicts representative O2k oxygraphs of mutant cells treated with DMSO (top) or 1 μM idebenone (bottom). In this assay, the permeabilized mutant cells were treated with DMSO or idebenone for 30 min prior to loading them into the O2k chambers. O2 slope neg. [pmol/(s*mL)] presented in red line was collected subsequent to injection of glutamate+malate (G/M), rotenone (Rot), succinate (Succ), ADP, and FCCP into the chamber. We also tested whether long-term idebenone treatment modified ATP synthesis of mutant cells using Mitochondrial ToxGlo Assay. Compared to the mutant cells treated with DMSO, those treated with 1 μM idebenone produced significantly greater amount of ATP (p = 0.0101; Fig. 6C). We next examined whether long-term idebenone treatment would influence cell growth. Due to the slow growth of mutant, cells were grown for 10 days in growth media added 0.5, 1, 5, or 10 μM idebenone. After 10 days, 32.1% more cells were recovered from cells treated with 0.5 μM idebenone compared to the DMSO control (p = 0.0011; Fig. 6D). However, treatment with 1 or 5 μM idebenone did not improve growth of the mutant (Fig. 6D), whereas treatment with 10 μM idebenone caused cell death (not shown). Overall, our findings suggest that the therapeutic idebenone is effective in partially restoring the growth and respiratory defects of the mutant cells.
We then studied whether idebenone treatment improves the respiration of parent cells. In Seahorse OCR assay, treatment with 1 μM idebenone significantly increased basal respiration (p <0.0001; Fig. 4B) and maximal respiratory capacity (p <0.0001; Fig. 4C), and numerically increased reserved respiratory capacity (p = 0.2364; Fig. 4B) of parent cells. When idebenone was injected at 1 μM final concentration into the O2k chamber carrying permeabilized parent cells Complex I respiration, Complex II respiration, OXPHOS capacity, and maximal respiration improved significantly (p = 0.0028, 0.0015, 0.0013, and 0.0023, respectively; Fig. 6E). Our findings suggest that the therapeutic idebenone is effective in enhancing the bioenergetics of the parent cell lines.
4. DISCUSSION
Isolated complex I deficiency caused by the genetic mutations in ETC Complex I is the most frequently observed OXPHOS defect among children with mitochondrial disease [22, 23]. NDUFS2 is a constituent of the metabolically important interface region of the mitochondrial Complex I [8, 9]. Due to the reported importance of this protein subunit to Complex I respiration and associated disease pathologies [24–31], a thorough examination of molecular level contribution of NDUFS2 to cellular respiration is required. Cabello-Rivera et al., [32] constructed a conditional knockout mouse model with suppressed NDUFS2 expression in radial glial cells and in neural stem cells. ATP synthesis and proliferation of neural stem cells were severely affected by this mutation. These mice also displayed markedly inhibited perinatal brain development, and all animals died before the tenth postnatal day [32]. Gene silencing has been employed to characterize the functional importance of NDUFS2. Hypoxic pulmonary vasoconstriction (HPV) in pulmonary artery smooth muscle cells regulates the systemic oxygen delivery by a process of matching ventilation to perfusion. By using lung-targeted siRNA treatments, Dunham-Snary et al., [33] reported that NDUFS2 activity is essential for acute oxygen-sensing HPV in rats. The NDUFS2 function has also been studied using non-mammalian models. NCUM is the homolog of human NDUFS2 in yeast Yarrowia lipolytica. Mutations in NCUM in Y. lipolytica resulted in complete absence of Complex I expression and moderate reduction in Complex I activity [28]. Nevertheless, studies on organization and functionality on NDUFS2 have been hampered by the lack of knockout cell culture or mouse models.
A defined and reliable NDUFS2 knockout cell line is essential for understanding the critical roles played by this subunit protein in OXPHOS and mitochondrial diseases. We successfully used a CRISPR/Cas9 approach to mutate the NDUFS2 of HEK293. Two separate sites of HEK293 genome were targeted for mutating. The efforts to mutate the 1002-bp site of NDUFS2 gene produced six clones with disrupted NDUFS2 expression. The online guide tool of Integrated DNA Technologies had predicted this site as reliable and specific for mutating this gene. Nevertheless, the efforts to mutate the 970-bp site of the gene failed to produce any clones with disrupted NDUFS2 expression. The online guide tool named CRISPOR had predicted this (second) site as suitable for mutagenesis. The failure to mutate the 970-bp site can be attributed to two possible reasons: (i) the sequence in this site may not be compatible for the CRISPR/Cas9 insertion/deletion (indel) mechanism; and/or (ii) the disruption in this site of the gene may be lethal for the cell line, and therefore, the clones may not have survived upon mutagenesis. The INDEL recombination events at the 1002-bp site disrupted the whole amino acid sequence downstream of the targeting site. And, mutagenesis procedure did not create any detectable off-target genetic alterations.
In agreement with the observed alteration of the NDUFS2 DNA sequence, amino acid level expression of the protein NDUFS2 was totally disrupted in the mutant. Moreover, as a result of the NDUFS2 mutation, expression of another complex I subunit (NDUFB8) decreased significantly suggesting interdependency in expression among different subunits of this complex. Quite interestingly, the expression of a complex II subunit (SDHB) and a complex V subunit (ATP5A) also decreased significantly in the mutant suggesting an association in protein expression between complex I and other complexes. Nevertheless, the NDUFS2 mutation did not alter expressions of subunits other two ETC complexes (UQCRC2 of complex III and MT-CO1 of complex IV) suggesting independency of these two complexes from complex I in terms of protein expression.
We investigated the impact of NDUFS2 disruption on cellular ROS generation. ROS act as signaling molecules and can cause cell damage or cell death when available in excess amounts [34]. The NDUFS2 mutant generated significantly increased ROS levels over a period of 72 hours. This observation was anticipated since mutation of NDUFS2 must have partially disrupted or impaired the electron flow in ETC causing electrons to leak out of the ETC. In general, electrons that do not follow the normal order of the ETC pathway and instead leaked out are eventually transferred directly to O2 to generate ROS [35, 36]. ETC Complex I is believed to be the main ROS production site of mitochondria [37, 38], and defective Complex I produces greater ROS amounts [39].
We also investigated the potential association of NDUFS2 disruption with cell-membrane integrity, apoptosis, and necrosis of HEK293. The mutant displayed increased cell porousness highlighting an association between membrane integrity and ETC functionality. NDUFS2 mutation also led to increased apoptosis and necrosis. Taken together, these observations highlight an association between NDUFS2 dysfunction, membrane porousness, apoptosis, and necrosis.
Our NDUFS2 knockout cell line was impaired in Complex I respiration. This was predicted since NDUFS2 is a subunit of Complex I and a constituent of the interfacial region of this complex. Nevertheless, quite interestingly, the mutant exhibited a greater Complex II respiration than the parent possibly because Complex II functions at a greater rate in the mutant to compensate the overall oxygen consumption. Glycolysis and glycolytic capacity decreased significantly of the mutant cells. It is possible that decreased demand for the Complex I substrate NADH lowered the necessity of pyruvate imposing a potential negative feedback on glycolysis. The mutant also produced a significantly less amount of ATP possibly as a result of decreased respiration and glycolysis. The mutant cells proliferated slower than the parent. This was anticipated since NDUFS2 dysfunction decreased respiration and glycolysis resulting in less abundance of ATP used in cell growth.
We then investigated whether effects of NDUFS2 disruption could be corrected with use of mitochondrial therapeutics. Idebenone, a short-chain benzoquinone that is more hydrophilic than ubiquinone [19], has potential as a therapeutic for conditions associated with oxidative stress and mitochondrial dysfunction [19–21, 40–47]. Acute treatment with idebenone improved oxygen consumption all along the ETC of the mutant, suggesting that this ubiquinone analog can be a useful substitute for Complex I as an electron donor in ETC. Specifically, the idebenone treatment contributed to enhance the Complex I respiration substantially. Moreover, long-term treatment with idebenone improved the ATP pool and enhanced the cell proliferation. We then evaluated whether idebenone is effective in inducing the bioenergetics of the parent cell line as well. Acute treatment with this drug enhanced the oxygen consumption all along the ETC of the parent cell line. These observations highlight the potential use of idebenone in bypassing the ETC defects of mutant cells as well as in enhancing bioenergetics of healthy cells.
We contributed to science by constructing a knockout CRISPR mutant of NDUFS2 and using the constructed mutant to evaluate the effectiveness of a mitochondrial therapeutic candidate. Nevertheless, further work is needed to characterize the contribution of NDUFS2 protein on structural assembly of Complex I. Moreover, ideal types/concentrations of therapeutics and treatment conditions to rescue the effects of NDUFS2 mutation need to be identified and evaluated.
5. CONCLUSIONS
Functions of NDUFS2 are associated with growth, cell-membrane integrity, ROS generation, apoptosis, necrosis, Complex I respiration, glycolysis, and ATP synthesis of HEK293. The respiratory defects of NDUFS2 disruption can be partially restored by treatment with the potential therapeutic idebenone. The constructed mutant is a useful tool for studying the isolated complex I deficiency and an effective platform for evaluating the efficacy of novel mitochondrial therapeutics.
ACKNOWLEDGEMENTS
The authors would like to thank Dr. Joseph Ruiz of Enzerna Biosciences for the mammalian cell line HEK293, Nicholas Catanzaro of the Virginia Maryland College of Veterinary Medicine (VMCVM) for the valuable support with western immuno-blotting, and Harini Sooryanarain of VMCVM for the support with the fluorescence and luminescence assays. This study was funded by the Start-up Funds from Virginia Tech for Dr. David A. Brown (VT Fund #235170) NIH NHLBI R01 HL132236 to JWS and F31 HL140909 to CCJ.
Glossary
- Abbreviations:
- ETC
Electron transport chain
- OXPHOS
oxidative phosphorylation
- ATP
adenosine
triphosphate
- NADH
reduced nicotinamide adenine dinucleotide
- DMSO
dimethyl sulfoxide
- ROS
reactive oxygen species
- OCR
oxygen consumption rate
Footnotes
Publisher's Disclaimer: This is a PDF file of an unedited manuscript that has been accepted for publication. As a service to our customers we are providing this early version of the manuscript. The manuscript will undergo copyediting, typesetting, and review of the resulting proof before it is published in its final form. Please note that during the production process errors may be discovered which could affect the content, and all legal disclaimers that apply to the journal pertain.
COMPETING INTERESTS
Authors declare no competing interests.
REFERENCES
- 1.Carroll J, Fearnley IM, Skehel JM, Shannon RJ, Hirst J, Walker JE: Bovine complex I is a complex of 45 different subunits. J Biol Chem 2006, 281(43):32724–32727. [DOI] [PubMed] [Google Scholar]
- 2.Carroll J, Fearnley IM, Shannon RJ, Hirst J, Walker JE: Analysis of the subunit composition of complex I from bovine heart mitochondria. Mol Cell Proteomics 2003, 2(2):117–126. [DOI] [PubMed] [Google Scholar]
- 3.Sazanov LA, Peak-Chew SY, Fearnley IM, Walker JE: Resolution of the membrane domain of bovine complex I into subcomplexes: implications for the structural organization of the enzyme. Biochemistry 2000, 39(24):7229–7235. [DOI] [PubMed] [Google Scholar]
- 4.Grigorieff N: Three-dimensional structure of bovine NADH:ubiquinone oxidoreductase (complex I) at 22 A in ice. J Mol Biol 1998, 277(5):1033–1046. [DOI] [PubMed] [Google Scholar]
- 5.Walker JE: The NADH:ubiquinone oxidoreductase (complex I) of respiratory chains. Q Rev Biophys 1992, 25(3):253–324. [DOI] [PubMed] [Google Scholar]
- 6.Stoc k D, Leslie AG, Walker JE: Molecular architecture of the rotary motor in ATP synthase. Science 1999, 286(5445):1700–1705. [DOI] [PubMed] [Google Scholar]
- 7.Baradaran R, Berrisford JM, Minhas GS, Sazanov LA: Crystal structure of the entire respiratory complex I. Nature 2013, 494(7438):443–448. [DOI] [PMC free article] [PubMed] [Google Scholar]
- 8.Efremov RG, Baradaran R, Sazanov LA: The architecture of respiratory complex I. Nature 2010, 465(7297):441–445. [DOI] [PubMed] [Google Scholar]
- 9.Hunte C, Zickermann V, Brandt U: Functional modules and structural basis of conformational coupling in mitochondrial complex I. Science 2010, 329(5990):448–451. [DOI] [PubMed] [Google Scholar]
- 10.Tocilescu MA, Fendel U, Zwicker K, Kerscher S, Brandt U: Exploring the ubiquinone binding cavity of respiratory complex I. J Biol Chem 2007, 282(40):29514–29520. [DOI] [PubMed] [Google Scholar]
- 11.Tocilescu MA, Zickermann V, Zwicker K, Brandt U: Quinone binding and reduction by respiratory complex I. Biochim Biophys Acta 2010, 1797(12):1883–1890. [DOI] [PubMed] [Google Scholar]
- 12.Stroud DA, Surgenor EE, Formosa LE, Reljic B, Frazier AE, Dibley MG, Osellame LD, Stait T, Beilharz TH, Thorburn DR et al. : Accessory subunits are integral for assembly and function of human mitochondrial complex I. Nature 2016, 538(7623):123–126. [DOI] [PubMed] [Google Scholar]
- 13.Ran FA, Hsu PD, Wright J, Agarwala V, Scott DA, Zhang F: Genome engineering using the CRISPR-Cas9 system. Nat Protoc 2013, 8 (11):2281–2308. [DOI] [PMC free article] [PubMed] [Google Scholar]
- 14.Ryall JG: Simultaneous Measurement of Mitochondrial and Glycolytic Activity in Quiescent Muscle Stem Cells. Methods Mol Biol 2017, 1556:245–253. [DOI] [PubMed] [Google Scholar]
- 15.Rafikov R, Sun X, Rafikova O, Louise Meadows M, Desai AA, Khalpey Z, Yuan JX, Fineman JR, Black SM: Complex I dysfunction underlies the glycolytic switch in pulmonary hypertensive smooth muscle cells. Redox Biol 2015, 6:278–286. [DOI] [PMC free article] [PubMed] [Google Scholar]
- 16.Hahn D, Kumar RA, Ryan TE, Ferreira LF: Mitochondrial respiration and H2O2 emission in saponin-permeabilized murine diaphragm fibers: optimization of fiber separation and comparison to limb muscle. Am J Physiol Cell Physiol 2019, 317(4):C665–C673. [DOI] [PMC free article] [PubMed] [Google Scholar]
- 17.Alleman RJ, Tsang AM, Ryan TE, Patteson DJ, McClung JM, Spangenburg EE, Shaikh SR, Neufer PD, Brown DA: Exercise-induced protection against reperfusion arrhythmia involves stabilization of mitochondrial energetics. Am J Physiol Heart Circ Physiol 2016, 310(10):H1360–1370. [DOI] [PMC free article] [PubMed] [Google Scholar]
- 18.Goswami I, Perry JB, Allen ME, Brown DA, von Spakovsky MR, Verbridge SS: Influence of Pulsed Electric Fields and Mitochondria-Cytoskeleton Interactions on Cell Respiration. Biophys J 2018, 114(12):2951–2964. [DOI] [PMC free article] [PubMed] [Google Scholar]
- 19.Erb M, Hoffmann-Enger B, Deppe H, Soeberdt M, Haefeli RH, Rummey C, Feurer A, Gueven N: Features of idebenone and related short-chain quinones that rescue ATP levels under conditions of impaired mitochondrial complex I. PLoS One 2012, 7(4):e36153. [DOI] [PMC free article] [PubMed] [Google Scholar]
- 20.Haefeli RH, Erb M, Gemperli AC, Robay D, Courdier Fruh I, Anklin C, Dallmann R, Gueven N: NQO1-dependent redox cycling of idebenone: effects on cellular redox potential and energy levels. PLoS One 2011, 6(3):e17963. [DOI] [PMC free article] [PubMed] [Google Scholar]
- 21.Heitz FD, Erb M, Anklin C, Robay D, Pernet V, Gueven N: Idebenone protects against retinal damage and loss of vision in a mouse model of Leber’s hereditary optic neuropathy. PLoS One 2012, 7(9):e45182. [DOI] [PMC free article] [PubMed] [Google Scholar]
- 22.Kirby DM, Crawford M, Cleary MA, Dahl HH, Dennett X, Thorburn DR: Respiratory chain complex I deficiency: an underdiagnosed energy generation disorder. Neurology 1999, 52(6):1255–1264. [DOI] [PubMed] [Google Scholar]
- 23.Triepels RH, VanDen Heuvel LP, Trijbels JM, Smeitink JA: Respiratory chain complex I deficiency. Am J Med Genet 2001, 106(1):37–45. [DOI] [PubMed] [Google Scholar]
- 24.Tuppen HA, Hogan VE, He L, Blakely EL, Worgan L, Al-Dosary M, Saretzki G, Alston CL, Morris AA, Clarke M et al. : The p.M292T NDUFS2 mutation causes complex I-deficient Leigh syndrome in multiple families. Brain 2010, 133(10):2952–2963. [DOI] [PMC free article] [PubMed] [Google Scholar]
- 25.Haack TB, Madignier F, Herzer M, Lamantea E, Danhauser K, Invernizzi F, Koch J, Freitag M, Drost R, Hillier I et al. : Mutation screening of 75 candidate genes in 152 complex I deficiency cases identifies pathogenic variants in 16 genes including NDUFB9. J Med Genet 2012, 49(2):83–89. [DOI] [PubMed] [Google Scholar]
- 26.Haack TB, Haberberger B, Frisch EM, Wieland T, Iuso A, Gorza M, Strecker V, Graf E, Mayr JA, Herberg U et al. : Molecular diagnosis in mitochondrial complex I deficiency using exome sequencing. J Med Genet 2012, 49(4):277–283. [DOI] [PubMed] [Google Scholar]
- 27.Loeffen J, Elpeleg O, Smeitink J, Smeets R, Stockler-Ipsiroglu S, Mandel H, Sengers R, Trijbels F, van den Heuvel L: Mutations in the complex I NDUFS2 gene of patients with cardiomyopathy and encephalomyopathy. Ann Neurol 2001, 49(2):195–201. [DOI] [PubMed] [Google Scholar]
- 28.Gerber S, Ding MG, Gerard X, Zwicker K, Zanlonghi X, Rio M, Serre V, Hanein S, Munnich A, Rotig A et al. : Compound heterozygosity for severe and hypomorphic NDUFS2 mutations cause nonsyndromic LHON-like optic neuropathy. J Med Genet 2017, 54(5):346–356. [DOI] [PubMed] [Google Scholar]
- 29.Rubrecht A, Clapp W, Shenoy A: Liver Pathology in Mitochondrial Complex I Deficiency from Bi-Allelic Mutations in NDUFS2: A Report of Findings at Autopsy. Fetal Pediatr Pathol 2019:1–4. [DOI] [PubMed] [Google Scholar]
- 30.Bugiani M, Invernizzi F, Alberio S, Briem E, Lamantea E, Carrara F, Moroni I, Farina L, Spada M, Donati MA et al. : Clinical and molecular findings in children with complex I deficiency. Biochim Biophys Acta 2004, 1659(2–3):136–147. [DOI] [PubMed] [Google Scholar]
- 31.Distelmaier F, Koopman WJ, van den Heuvel LP, Rodenburg RJ, Mayatepek E, Willems PH, Smeitink JA: Mitochondrial complex I deficiency: from organelle dysfunction to clinical disease. Brain 2009, 132(Pt 4):833–842. [DOI] [PubMed] [Google Scholar]
- 32.Cabello-Rivera D, Sarmiento-Soto H, López-Barneo J, Muñoz-Cabello AM: Mitochondrial Complex I Function Is Essential for Neural Stem/Progenitor Cells Proliferation and Differentiation. Front Neurosci 2019, 13:664. 10.3389/fnins.2019.00664. eCollection 2019. [DOI] [PMC free article] [PubMed] [Google Scholar]
- 33.Dunham-Snary KJ, Wu D, Potus F, Sykes EA, Mewburn JD, Charles RL, Eaton P, Sultanian RA, Archer SL: Ndufs2, a Core Subunit of Mitochondrial Complex I, Is Essential for Acute Oxygen-Sensing and Hypoxic Pulmonary Vasoconstriction. Circ Res 2019, 124(12):1727–1746. [DOI] [PMC free article] [PubMed] [Google Scholar]
- 34.Wittmann C, Chockley P, Singh SK, Pase L, Lieschke GJ, Grabher C: Hydrogen peroxide in inflammation: messenger, guide, and assassin. Adv Hematol 2012, 2012:541471. [DOI] [PMC free article] [PubMed] [Google Scholar]
- 35.Turrens JF: Mitochondrial formation of reactive oxygen species. J Physiol 2003, 552(Pt2):335–344. [DOI] [PMC free article] [PubMed] [Google Scholar]
- 36.Cadenas E, Davies KJ: Mitochondrial free radical generation, oxidative stress, and aging. Free Radic Biol Med 2000, 29(3–4):222–230. [DOI] [PubMed] [Google Scholar]
- 37.Kowaltowski AJ, de Souza-Pinto NC, Castilho RF, Vercesi AE: Mitochondria and reactive oxygen species. Free Radic Biol Med 2009, 47(4):333–343. [DOI] [PubMed] [Google Scholar]
- 38.Brand MD: The sites and topology of mitochondrial superoxide production. Exp Gerontol 2010, 45(7–8):466–472. [DOI] [PMC free article] [PubMed] [Google Scholar]
- 39.Raha S, Robinson BH: Mitochondria, oxygen free radicals,disease and ageing. Trends Biochem Sci 2000, 25(10):502–508. [DOI] [PubMed] [Google Scholar]
- 40.Palecek T, Fikrle M, Nemecek E, Bauerova L, Kuchynka P, Louch WE, Spicka I, Rysava R: Contemporary treatment of amyloid heart disease. Curr Pharm Des 2015, 21(4):491–506. [DOI] [PubMed] [Google Scholar]
- 41.Strawser CJ, Schadt KA, Lynch DR: Therapeutic approaches for the treatment of Friedreich’s ataxia. Expert Rev Neurother 2014, 14(8):949–957. [DOI] [PubMed] [Google Scholar]
- 42.Lynch DR, Perlman SL, Meier T: A phase 3, double-blind, placebo-controlled trial of idebenone in friedreich ataxia. Arch Neurol 2010, 67(8):941–947. [DOI] [PubMed] [Google Scholar]
- 43.Buyse GM, Goemans N, van den Hauwe M, Thijs D, deGroot IJ, Schara U, Ceulemans B, Meier T, Mertens L: Idebenone as a novel, therapeutic approach for Duchenne muscular dystrophy: results from a 12 month, double-blind, randomized placebo-controlled trial. Neuromuscul Disord 2011, 21(6):396–405. [DOI] [PubMed] [Google Scholar]
- 44.Buyse GM, Voit T, Schara U, Straathof CS, D’Angelo MG, Bernert G, Cuisset JM, Finkel RS, Goemans N, Rummey C et al. : Treatment effect of idebenone on inspiratory function in patients with Duchenne muscular dystrophy. Pediatr Pulmonol 2017, 52(4):508–515. [DOI] [PMC free article] [PubMed] [Google Scholar]
- 45.McDonald CM, Meier T, Voit T, Schara U, Straathof CS, D’Angelo MG, Bernert G, Cuisset JM, Finkel RS, Goemans N et al. : Idebenone reduces respiratory complications in patients with Duchenne muscular dystrophy. Neuromuscul Disord 2016, 26(8):473–480. [DOI] [PubMed] [Google Scholar]
- 46.Buyse GM, Voit T, Schara U, Straathof CSM, D’Angelo MG, Bernert G, Cuisset JM, Finkel RS, Goemans N, McDonald CM et al. : Efficacy of idebenone on respiratory function in patients with Duchenne muscular dystrophy not using glucocorticoids (DELOS): a double-blind randomised placebo-controlled phase 3 trial. Lancet 2015, 385(9979):1748–1757. [DOI] [PubMed] [Google Scholar]
- 47.Fiebiger SM, Bros H, Grobosch T, Janssen A, Chanvillard C, Paul F, Dorr J, Millward JM, Infante-Duarte C: The antioxidant idebenone fails to prevent or attenuate chronic experimental autoimmune encephalomyelitis in the mouse. J Neuroimmunol 2013, 262(1–2):66–71. [DOI] [PubMed] [Google Scholar]