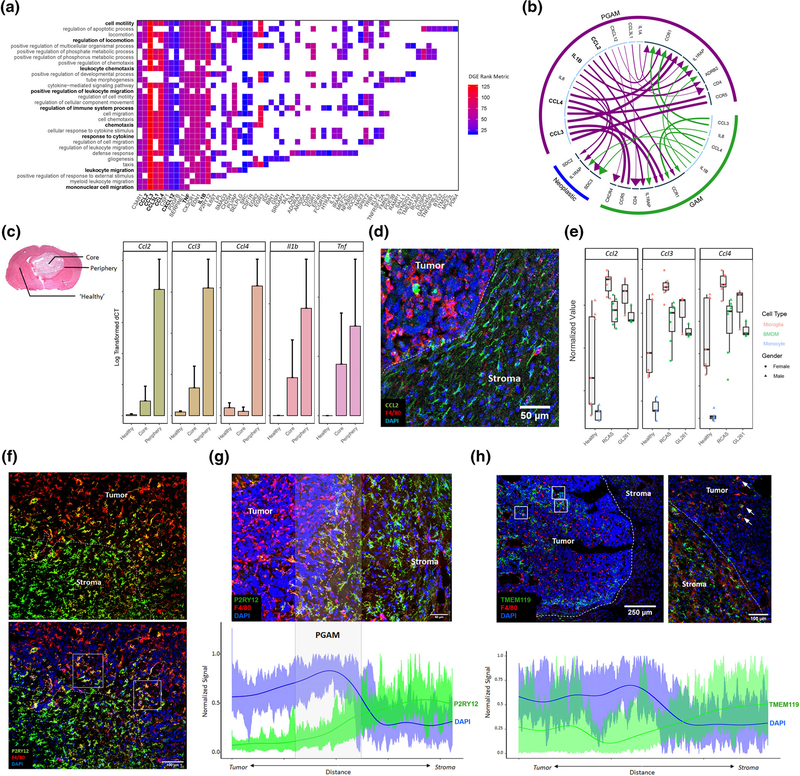
FIGURE 2.
Peritumoral glioma-associated microglia (PGAM) are chemotactic and pro-inflammatory, and PGAM markers localize at the tumor–stroma interface in glioma. (a) Transcripts identified from differential gene expression are plotted against their associated GO terms from Gene Set Enrichment Analysis (GSEA) p val <.01 FDR <0.05. Axes are sorted such that highly overlapping transcripts and GO terms group together. Tiles are colored by fold change rank metric, relative to tumor core glioma-associated microglia/macrophages (GAM) expression. (b) Using the iTALK package, receptor-ligand pairs are predicted based on relative expression, between PGAM, GAM, and neoplastic cells. Arrows are colored by cellular population. Arrow lines are scaled by ligand expression, arrow heads are scaled by receptor expression. Inner circle: light blue denotes ligands; dark blue denotes receptor. (c) Left, representative H&E image of GL261 murine glioma, indicating where contralateral healthy, tumor core, and tumor peripheral tissues were sampled. Right, qRT-PCR log transformed ΔCT values of PGAM markers detected in (a), across sample region. n = 2–3. (d) CCL2+ cells populate peritumoral space in GL261 glioma samples. F4/80 is a pan macrophage/microglia marker. n = 3. (e) Bulk RNAseq samples from Bowman et al, and Haage et al. were combined, and PGAM markers were plotted against FACS sorted cell types, and murine glioma models GL261 and RCAS. PGAM markers associate with microglia populations, over BMDM and monocytes in both models. n = 3–6. (f) P2RY12 staining at the tumor–stroma border in GL261 murine glioma, Day 21. White dotted line represents tumor leading edge, white boxes highlight P2RY12+F4/80High microglia. Scale bar = 100 μm. (g) Semiquantitative analysis of spatial distribution of P2RY12 expression across the tumor–stroma interface in glioma, as in (f). Spatial signal from imaging technical replicates were scaled and combined, generating an average expression curve. The highly nucleated tumor, marked by high DAPI expression, correlates with the tumor border. n = 4. Scale bar = 50 μm. (h) Semiquantitative analysis of spatial distribution of TMEM119 expression inside the tumor core (left) and across the tumor–stroma interface (right) in glioma, as in (g,f). White boxes highlight patches of intratumoral TMEM119+F4/80High microglia. White arrows mark TMEM119+F4/80High microglia at tumor–stroma interface. n = 3. Scale bar = 250 and 100 μm

