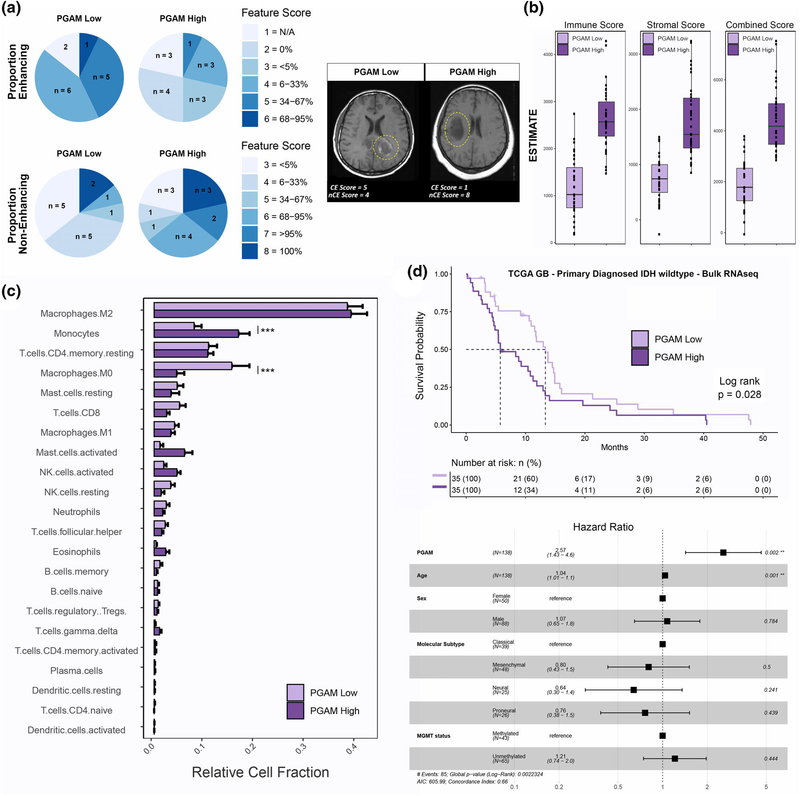
FIGURE 5.
Peritumoral glioma-associated microglia (PGAM) correlate with clinical covariates of Glioma-associated microglia/macrophages (GBM). (a) Patients were split into high/low PGAM signature scoring groups. Left, pie charts of feature scores, by PGAM group. n represents the number of patients with each feature score, and are colored by increasing feature score severity. Proportion of enhancing, and noncontrast enhancing tumor regions are shown. Right, representative MRI images from each PGAM group, and their corresponding feature score. CE, contrast enhancing; nCE, noncontrast enhancing. Yellow dotted line demarks primary lesion. n = 14 per group. (b–d) Primary diagnosed GBM IDH wild-type patients from TCGA-GBM cohort were scored for PGAM gene signature, and split into high/low scoring groups. n = 35 per group. (b) Boxplot of ESTIMATE immune and stromal scores, stratified by PGAM signature scoring. (c) Patient transcriptomes from PGAM high/low groups were analyzed by CIBERSORT. Plotted are the predicted relative fractions of 22 immune cell subpopulations ±SEM. Two-way analysis of variance (ANOVA) with Tukey’s post hoc comparison. p < .001***. (d) Top, Kaplan–Meier survival curve, stratified by PGAM group. Dotted line marks median survival. MS PGAM low = 5.7, MS PGAM high = 13.3. Log rank p val = .028. Bottom, Cox proportional hazards regression model was conducted, using covariates of survival. Forrest plot of the resulting corrected hazard ratios, following regression

