Abstract
Natural hazards can be prominent and powerful mechanisms that impact the remediation and restoration of contaminated sites and the revitalization of communities associated with these sites. The potential for hazardous material releases following a natural disaster can exacerbate the impact of contaminated sites by causing the release of toxic or hazardous materials and inhibiting the restoration of the site as well as altering the long-term sustainable revitalization of adjacent communities. Disaster-related hazardous releases, particularly in population-dense areas, can create problems as difficult as the original site clean-up. Similarly, exposure of contaminated sites to natural hazards can enhance the probability of future issues associated with the site. This manuscript addresses the co-occurrence of 12 natural hazards (singly and in combination) and individual Superfund sites.
Keywords: Superfund, Natural Hazards, Exposure, Toxic Releases
Introduction
Natural hazard events (e.g., hurricanes, tornadoes, wildfires, earthquakes) can exacerbate the likelihood of releases from contaminated sites. These releases can threaten the environment and human health by exposing individuals to hazardous materials or secondary hazards (e.g., explosions, fires) when flammable materials are impacted (Binder and Sanderson 1987). Releases of hazardous materials from contaminated sites have been documented after earthquakes (Showalter and Myers, 1992, 1994; Krausmann et al. 2010), floods (Smith 2001, Associated Press 2007), hurricanes (Cruz et al. 2001, Pielke et al. 2008) and wildfires (Turetsky et al. 2006, Rothwell et al. 2007, Evangeliou et al. 2014).
Approximately 17,000 toxic material releases between 1990 and 2010 were caused by natural hazards (Sengul et al. 2012). Flooding events (inland and coastal) were most numerous and caused about 26 percent of the total number of releases. Similarly, another 20% were the result of hurricane exposure, many resulting from major episodes in 2005 and 2008. Storms, wind events, wildfires, earthquakes and temperature-related events were responsible for releases of toxic materials (Sengul et al. 2012).Earthquakes have resulted in contaminant releases (Lindell and Perry, 1996a, 1996b, 1998; Krausman et al. 2010) impacting major geographic areas in the US. Many of these areas are susceptible to multiple serious natural hazards (Abbott, 2004). Combined with population growth in these regions, the result is a trend towards greater losses due to natural hazards (Van der Vink et al. 1998) such as hurricanes (Pielke et al. 2008) or floods (Young et al. 2004). Overall, the number of contaminant releases resulting from natural hazard exposures has increased over the past three decades co-occurring with enhanced potential for serious human and environmental impacts.
In the United States, the U.S. Environmental Protection Agency’s (EPA) Superfund program investigates and cleans up hazardous contaminated sites. Thousands of contaminated sites exist nationally due to hazardous waste being left out in the open, dumped or otherwise improperly managed (EPA Superfund Priority List of Sites; US EPA 2020). Superfund sites include processing plants, manufacturing facilities, mining sites and landfills. To deal with this contamination problem, Congress passed the Comprehensive Environmental Response, Compensation and Liability Act (CERCLA) in 42 U.S.C. Chapter 103 (Legal Information Institute 1980). The legislation provides EPA the authority to clean up contaminated sites and holds the parties responsible for the contamination to either complete cleanups or pay the EPA for the cleanup activities. A 1986 CERCLA amendment stressed the need for permanent and innovative clean-up treatments, provided enhanced enforcement tools, increased treatment foci on human health issues resulting from the sites and promoted increased citizen participation in the clean-up decision making process. Similar contaminated sites exist in Europe (Panagos et al. 2013) and are addressed by the European Environment Agency (EEA 2019); however, this manuscript will focus on the United States and its Superfund Program.
In addition to site remediation, the Superfund Program does not only seek to clean up sites—the program is meant to return these sites to productive use serving their local community (U.S. Senate Committee on Environment and Public Works 2020). Remediation, restoration or revitalization is incomplete unless it is sustainable and resilient. Restoration plans should be developed for contaminated sites, whether they be Superfund or some other site, in the context of potential continuing exposure to natural hazards like flooding, sea level rise, hurricanes, tornadoes or wildfires (Showalter and Myers, 1992, 1994; Crus et al. 2001; Smith 2001; Turetsky et al. 2006; Evangeliou et al. 2014). Superfund and other non-Superfund toxic contaminant site managers and remediation planners (e.g., those in Europe and Asia) are certainly aware that these types of natural hazards may occur in their geographic areas of concern. Unfortunately, these managers and planners rarely, if ever, incorporate the potential occurrence of these types of events into their remediation or restoration plans. In general, they may only be required to state how they plan to remediate the condition or restore the habitat or site to a particular level of use. As stated earlier, the Superfund Program is now much more interested in ensuring remediated or restored sites are sustainable and resilient so that they can contribute to the revitalization of their adjacent communities (U.S. Senate Committee on Environment and Public Works 2020).
Superfund sites are, in essence, no different than any other site exposed to natural hazards except that these sites contain significant toxic contaminates. Having the ability to estimate potential site exposures during remediation or restoration is critical for the sustainability of EPA, regional, state and local restoration plans and revitalization of communities. The Cumulative Resilience Screening Index provides these types of natural hazard exposure information and has been described in detail in Summers et al. (2017a, b; 2018, 2020). The CRSI examines the history of natural hazard events throughout the United States as well as the economic, environmental, social and governance characteristics associated with resilience to these events. Twelve (12) natural hazards were selected from a review of the National Climate Assessment (Melillo et al. 2014) and the 100 Resilient Cities report (ARUP 2014) and are included in CRSI:
|
|
This study examines the likelihood of Superfund site exposure to one or more of these natural hazards. In the development of the CRSI model (Summers et al. 2017b, 2018, 2020), one of the domains (risk) includes exposure metrics, which describe the spatial distribution of these natural hazards. There is extensive research examining the impact of extreme weather events on the management of remediation sites (Maco et al. 2018). Violent storms, fires, hail, earthquakes, and landslides pose structural threats to sites that could slow clean-up or cause subsequent releases (Burger and Gochfeld 2016; Pease et al. 2007). Drought, floods, and temperature extremes can alter the transport of chemicals or change their bioavailability in the environment (Hooda and Alloway 1993; Nadal et al. 2015). Knowledge of potential exposures can help planning for and mitigation of future hazard exposures, potentially limiting the vulnerability of communities nearby. Exposure to one or more of the hazards during restoration or community revitalization could present a significant problem involving potential re-exposure to the contaminants involved with the sites.
The assessment presents the creation of a database that includes the location of all existing and planned Superfund sites, the location of exposure information for the listed natural hazards, and the juxtapositioning of two sets of information spatially. The objective of the assessment is to address the challenges for restoration and revitalization resulting from natural hazard exposures at contaminated sites for all (or as many as possible) counties in the United States.
Methods
The approach used to conduct this assessment was relatively simple and straightforward. It consisted of six steps focused on the extraction of relevant data from existing data sources for natural hazard exposure and Superfund site information (EPA databases) as well as U.S. Census data, the joining of these data based on a common spatial unit binning each site-exposure combination into quartiles, and mapping the resulting information. The steps include:
Location and extraction of 2000–2015 natural hazard exposure information for the twelve natural hazards listed above from EPA’s Cumulative Resilience Screening Index (CRSI) database (Summers et al. 2020);
Location and extraction of the latest Superfund site information (name and location) from EPA’s GeoPlatform for all existing and planned sites (US EPA 2020)
Location and extraction of 2018 county boundary and 2015 core-based statistical area information with population estimates from US Census;
Normalization of exposure estimates for each type of natural hazard on a 0–100 scale
Merging of these sets of information based on common spatial scale (i.e., county); and,
Mapping of the merged information to depict the Superfund site location with its level of exposure for each of the natural hazard types, the sites with the highest exposure for each hazard type and the integration of all 12 hazards, and potential level of impact of the highest exposures at core-based statistical areas of varying population.
Natural hazard exposure estimates in this study are created from the Patterns of Risk using an Integrated Spatial Multi-Hazard (PRISM) approach (Buck 2019) and used in the construction of the Cumulative Resilience Screening Index (CRSI) (Summers et al. 2017, 2020). This approach creates spatial extents for each hazard-type using historic and modeled data from 2000–2015. Data from the National Land Cover Database (NLCD) is used to estimate natural hazard vulnerability by projected land-use (Homer et al. 2015). Land-area hazard exposures are modeled at the county level and combined to represent multi-hazard exposure probability. The data created represents proportional county acreage exposed to natural hazards. These county exposure estimates form the base metrics of the CRSI risk domain and are used here to approximate the location of natural hazards across the US.
Spatial data for Superfund sites on the National Priority List (NPL) (U.S. EPA 2020) were retrieved from the EPA’s GeoPlatform (https://epa.maps.arcgis.com/home/index.html; last updated 2020). All active and proposed sites were joined to their respective county and Core-Based Statistical Areas (CBSAs), enabling county hazard exposure metrics and relevant demographic data to be combined with the Superfund sites for analysis. Only 3 out of the 1,364 defined Superfund sites did not receive corresponding county boundary data because they did not fall completely within a county boundary. To mitigate this, the previous output’s attribute table was edited. Information from the nearest county was manually entered for each of the 3 sites. Once these edits were completed, the revised attribute table was exported. CRSI exposure data was then joined to this exported table in Microsoft Excel. The final output, which contained 1,364 active and proposed Superfund sites with CRSI exposure estimates, was brought back into ArcMap for mapping purposes (the 22 sites located in Puerto Rico were eliminated from the assessment because no corresponding CRSI data exists for Puerto Rico).
Hazard vulnerability is attributed to Superfund sites through both the assessment of exposure probability (site vulnerability) and potential population impacts (population vulnerability). In both conceptualizations, vulnerability represents the likelihood of harm resulting from an exposure. A higher probability of exposure at a Superfund Site translates to higher vulnerability. Similarly, a high population density surrounding a Superfund Site will increase the likelihood of health impacts following a release. Site vulnerability is represented for each hazard as a score (1–99), where the original land proportion exposures from the county are converted to a scaled estimate of exposure likelihood based on a distribution of normalized values.
To investigate the potential integrated exposure of existing and planned Superfund sites within the U.S., a series of Excel formulas were used to highlight those sites with high exposure to multiple hazards. The minimum, maximum, and quartiles were calculated for each of the twelve metrics to represent magnitude of exposure. Each exposure-site combination was “binned” to represent the magnitude of potential exposure. For example, if a site had a metric score of 99 for hurricane exposure, then that site would receive a “binned” score of 4, because it fell into the fourth or highest exposure quartile. A final exposure count of the natural hazards with the highest probability of exposure at each site were determined by summing the total number of hazards with a “binned” score of 3 or 4 to represent total exposure. For example, a site that might be highly exposed to hurricanes, earthquakes, and drought would receive a final exposure score of 3. Only hazards with a “binned” score of 3 or 4 at each site were counted because emphasis should be placed on those sites with a high likelihood of exposure to multiple hazards.
The 2015 population estimate data per CBSA were mapped in relation to sites with potentially high exposure to multiple hazards. Definition queries within ArcMap were used to limit the 917 CBSAs to specified population ranges, these being: 0–50,000, 50,000–250,000, 250,000–1,000,000, and 1,000,000+.
Results
Natural hazard vulnerability at existing and proposed Superfund sites are shown in Figures 1 and 2. These maps show the co-occurrence of the likelihood of exposure of each of the twelve individual natural hazards and the location of the existing and planned 1,364 Superfund sites. Likelihood is depicted on a scale from 1–99 for each natural hazard exposure based on normalization of each data set, where 1.0 indicates no likelihood of the specific hazard co-occurring at the site and 99.0 represents high likelihood that the Superfund site would experience the hazard. Categories within each legend on these figures represent ArcMap-generated divisions based on natural breaks classification. Darker colors indicate higher vulnerability to each natural hazard.
Figure 1.
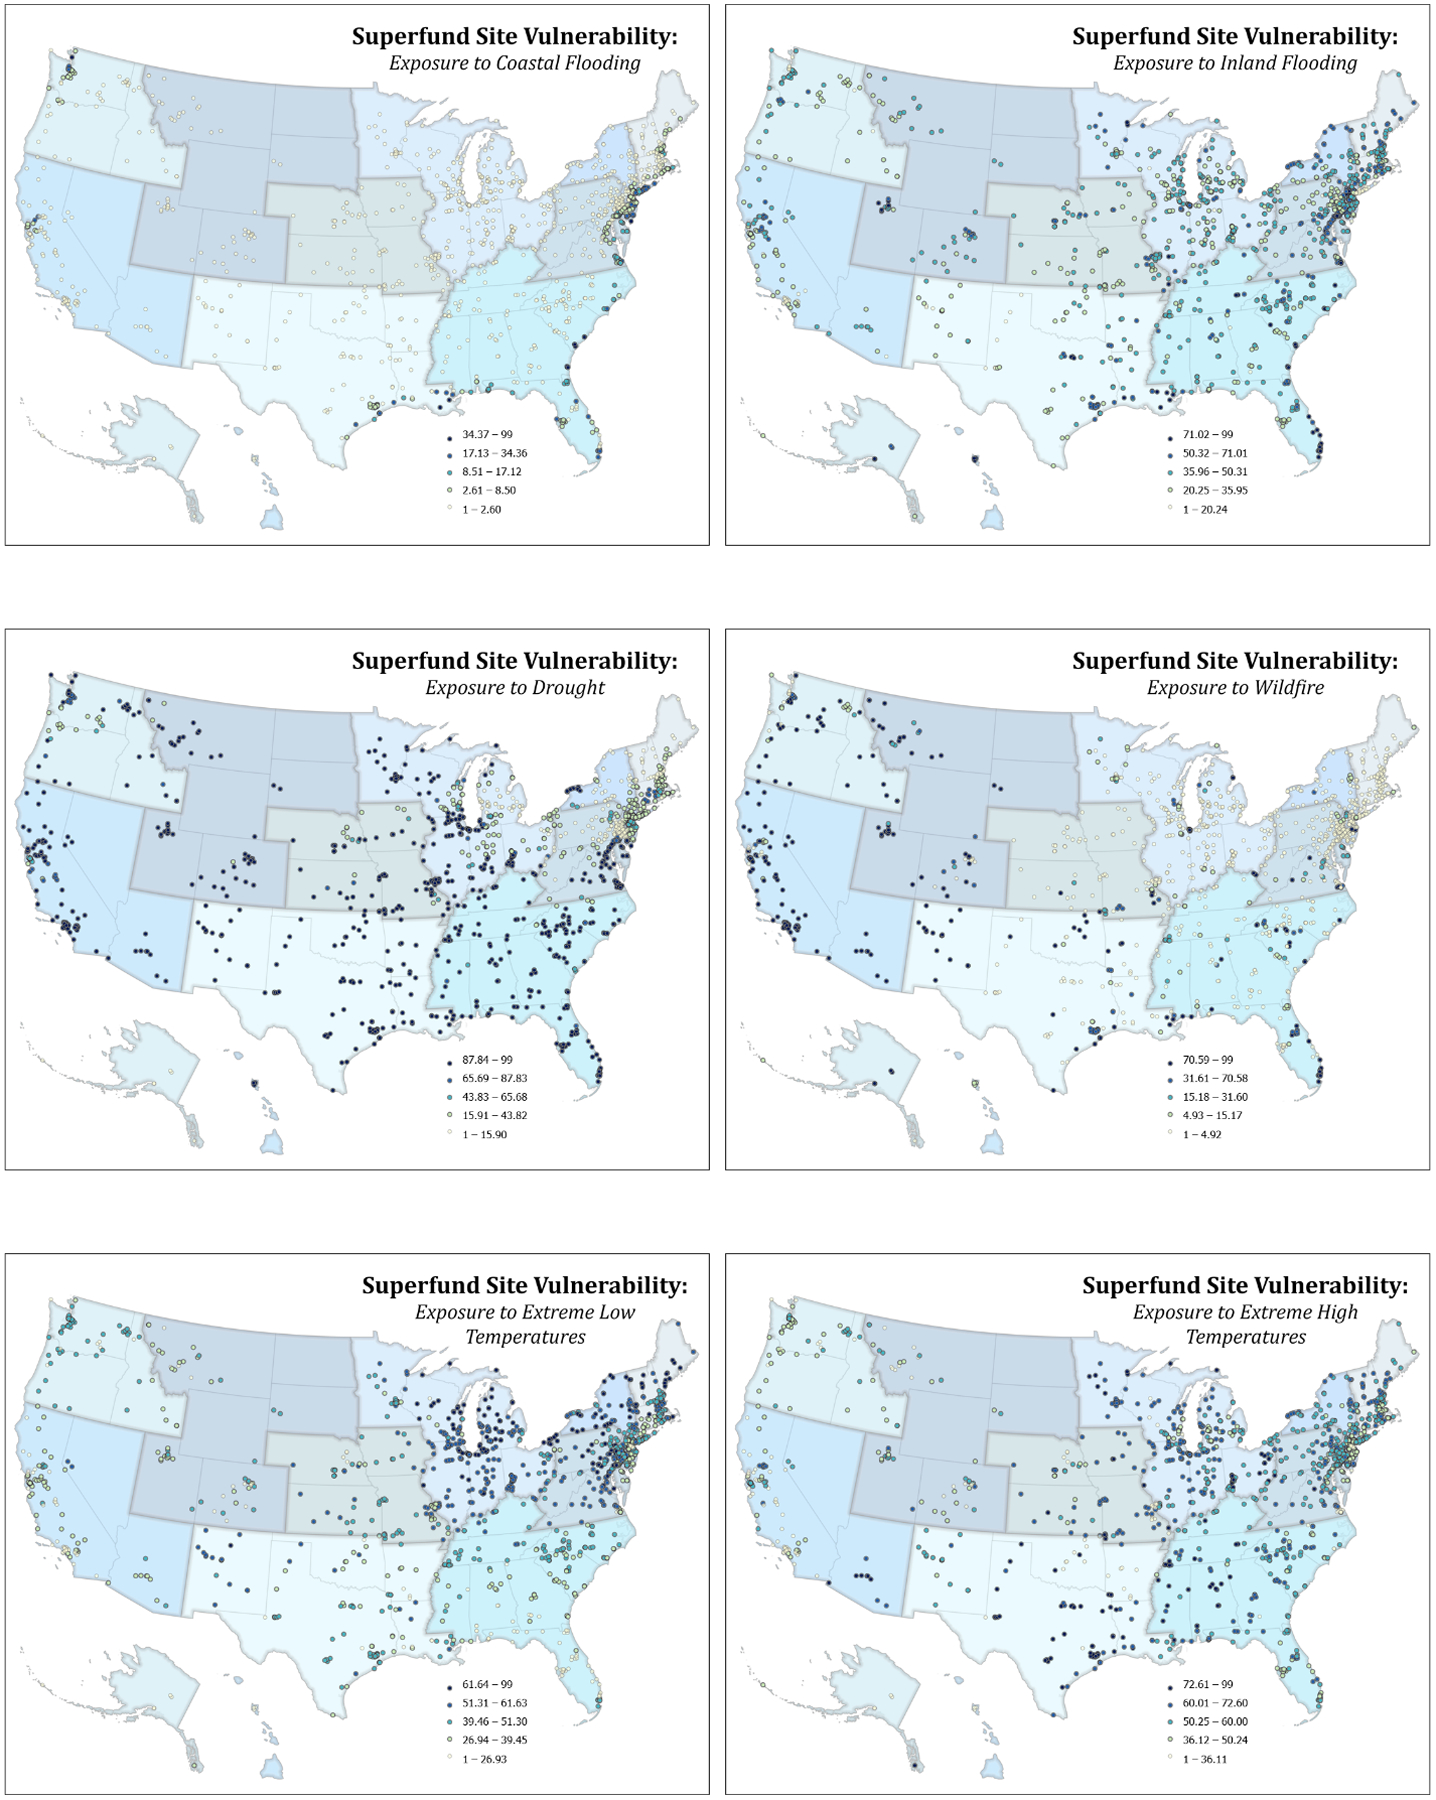
Superfund site vulnerability for indicated natural hazard. Darker colors indicate higher probability of hazard exposure.
Figure 2.
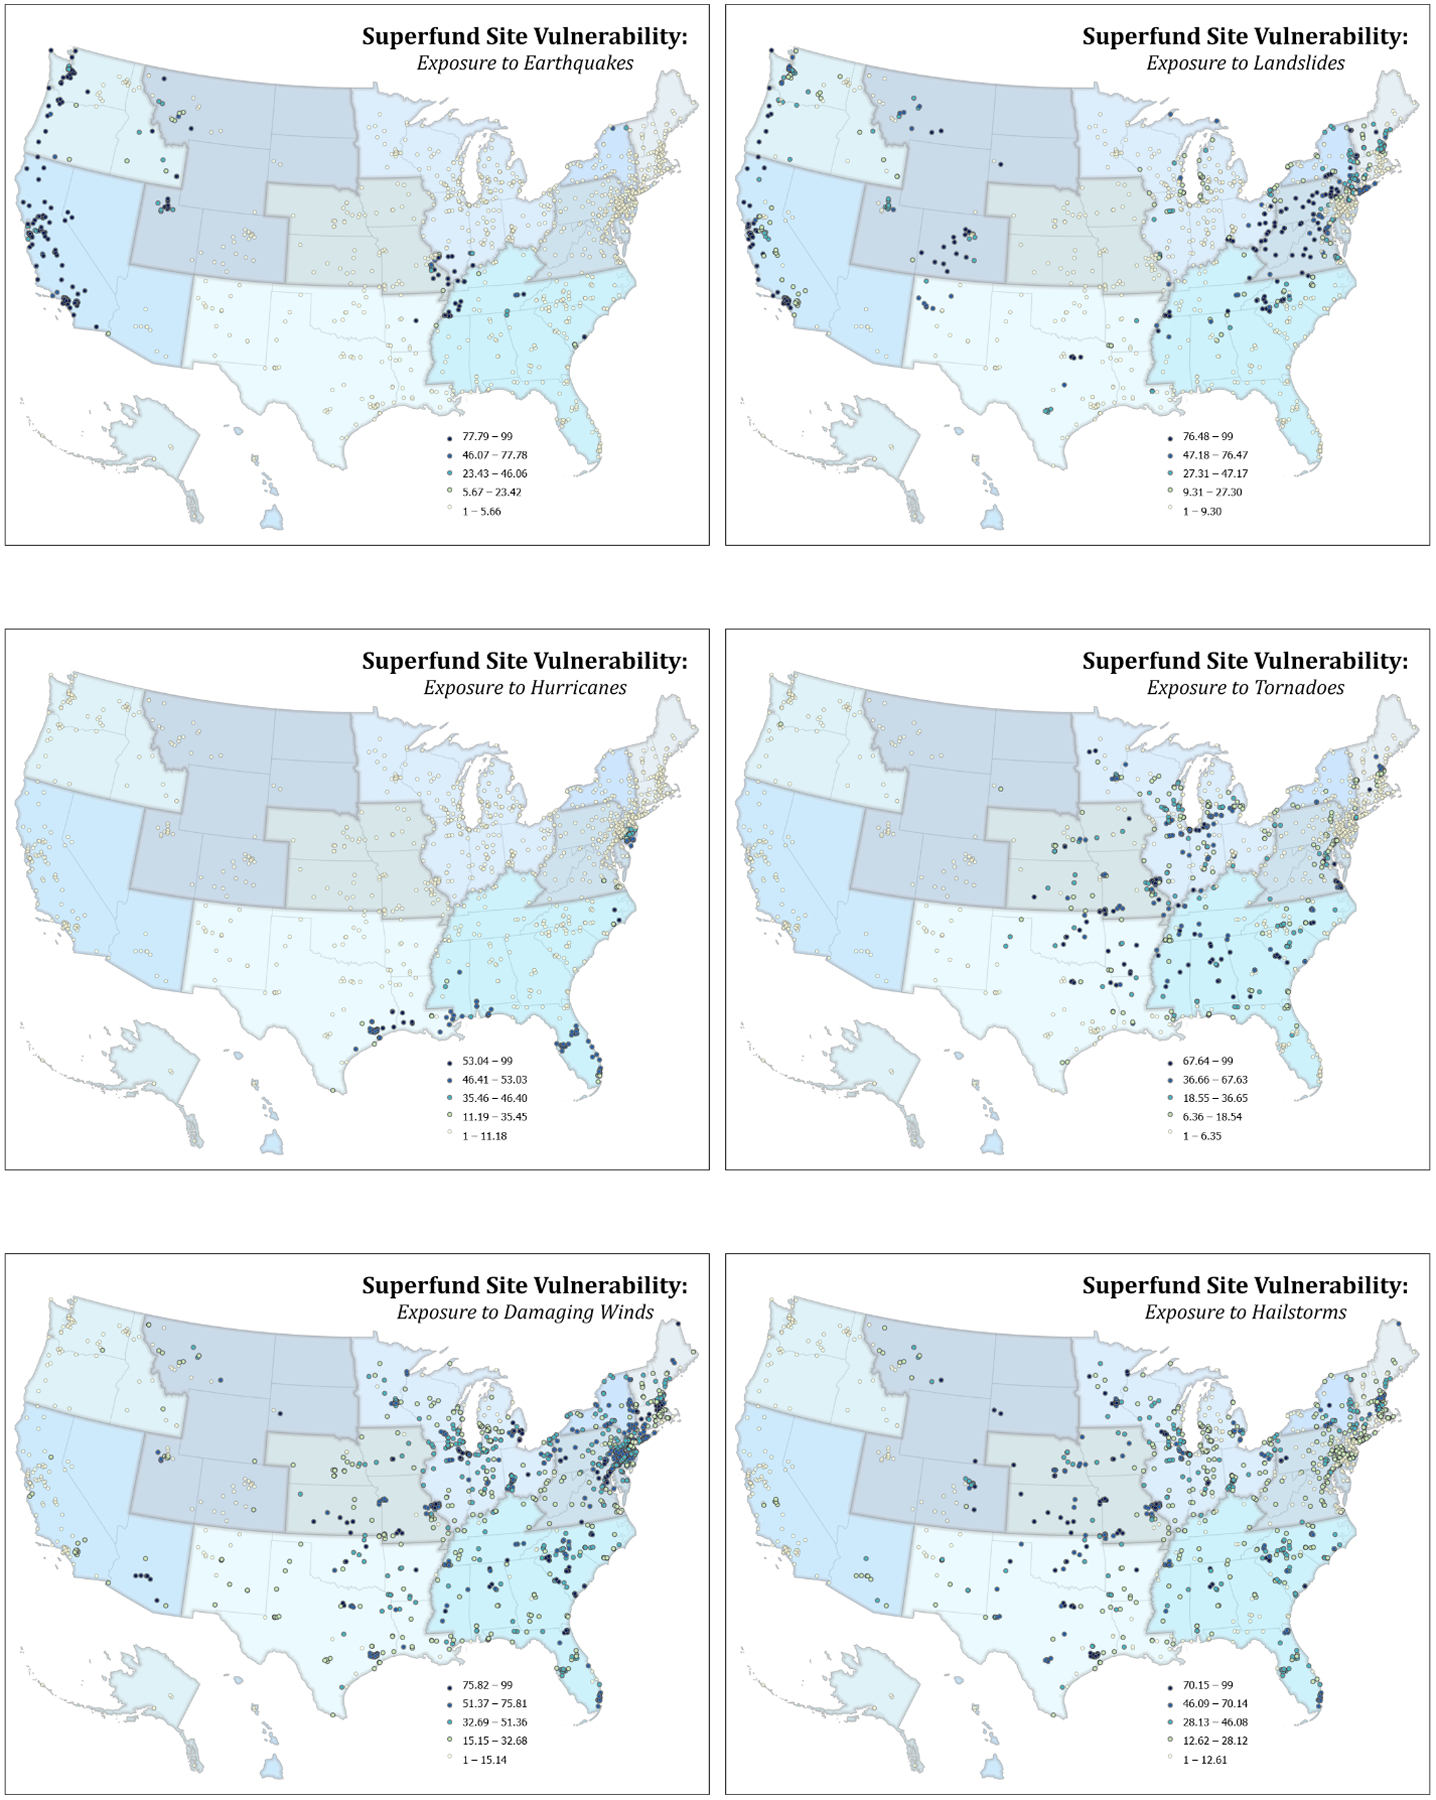
Superfund site vulnerability for indicated natural hazard. Darker colors indicate higher probability of hazard exposure.
Flood exposures are divided into two categories – coastal (includes sea level rise) and inland. Coastal flooding, as expected, is most likely along the southeastern coastline, the Gulf of Mexico, and the west coast in the areas of the San Francisco Bay and Puget Sound (Figure 1). Secondary levels of coastal flooding occur along the coastlines of the Mid-Atlantic and the northeast. Inland flooding is spread throughout the U.S. but most site vulnerability appears to be concentrated in northern Utah, the southern tip of Great Lakes Superior and Michigan, southeastern coastal Florida, the Mississippi River delta (Figure 1).
Drought and wildfires are spread throughout the United States with drought being much more pervasive (Figure 1). Less probability of drought exposure appears to occur at sites in the northeast, northern Ohio and Indiana and lower Michigan. High likelihood of wildfire is illustrated at most Superfund sites in the western states as well as some concentrations in the Carolinas, Oklahoma, northwestern and southeastern Florida, and the Louisiana-Mississippi coast.
Extremes in temperature, as would be expected, are pervasive throughout the country but some regions indicate a higher probability of extreme temperature exposures at Superfund site locations (Figure 1). The highest likelihood of extreme low temperatures at Superfund sites occur around the Great Lakes (particularly along the coastlines) and the northeast. Extreme low temperatures occur in all other regions of the country but with lower probabilities. Extreme high temperature occurrences at Superfund sites are generally found in the south and southwest with isolated sites located in Minnesota, Upper Michigan and Ohio (temperatures as high as 100 degrees are not uncommon for short periods in these areas).
Some likelihood of earthquakes at Superfund sites occur throughout the U.S. but the highest likelihood of co-occurrence at Superfund sites is in western California, Oregon and Washington, the states associated with the central Mississippi River (i.e., Tennessee, Kentucky, Missouri and Illinois), and single locations in South Carolina, Arkansas and eastern Tennessee (Figure 2). Similarly, landslides are most common at Superfund sites along the Appalachian Mountains, the Mid-Atlantic states, Colorado, and in the western states (particularly at sites near San Francisco and Los Angeles) (Figure 2). Isolated co-occurrence of landslides and Superfund sites occur in the Memphis, TN area, Dallas, TX region, Montana and South Dakota.
Hurricanes and tornadoes have high probabilities of occurring at Superfund sites along the Gulf of Mexico coastline, southeastern Florida coastline, and North Carolina (Figure 2). A secondary pocket of moderate to high probability of hurricanes at Superfund sites occurs in New Jersey. Tornadoes have the highest likelihood in “Tornado Alley” stretching from northern Louisiana and Texas to Nebraska and Iowa (Figure 2). Secondary regions of high probability occur at Superfund sites throughout the south except in Florida, southern Lake Michigan coastline and the Norfolk-Hampton Roads area of Virginia.
Damaging winds and hailstorms occur at Superfund sites throughout the U.S. (Figure 2). The highest probability of damaging winds at these sites occurs, as expected, in Tornado Alley, central Arizona, Chicago, IL, lower Michigan, the Carolinas, and northern Chesapeake Bay. The highest occurrences of destructive hailstorms at Superfund sites are seen in the central U.S, from Texas to Minnesota (Figure 2).
The highest rates in integrated exposure (CSRI indicator) and integrated risk (CSRI domain) – multi-hazard exposure natural hazards and multi-hazard risk - at Superfund sites co-occur in western states near Los Angeles and San Francisco, CA, Portland, OR and Seattle, WA (Figure 3). Other areas of high multi-hazard exposure probability are seen at Superfund sites in central Colorado and northern Utah, Missouri, Illinois (including Chicago), Houston and Dallas, TX, Charlotte, NC, Miami, FL, the Baltimore-Washington, DC corridor, Ohio, Indiana, and northern Alabama.
Figure 3.
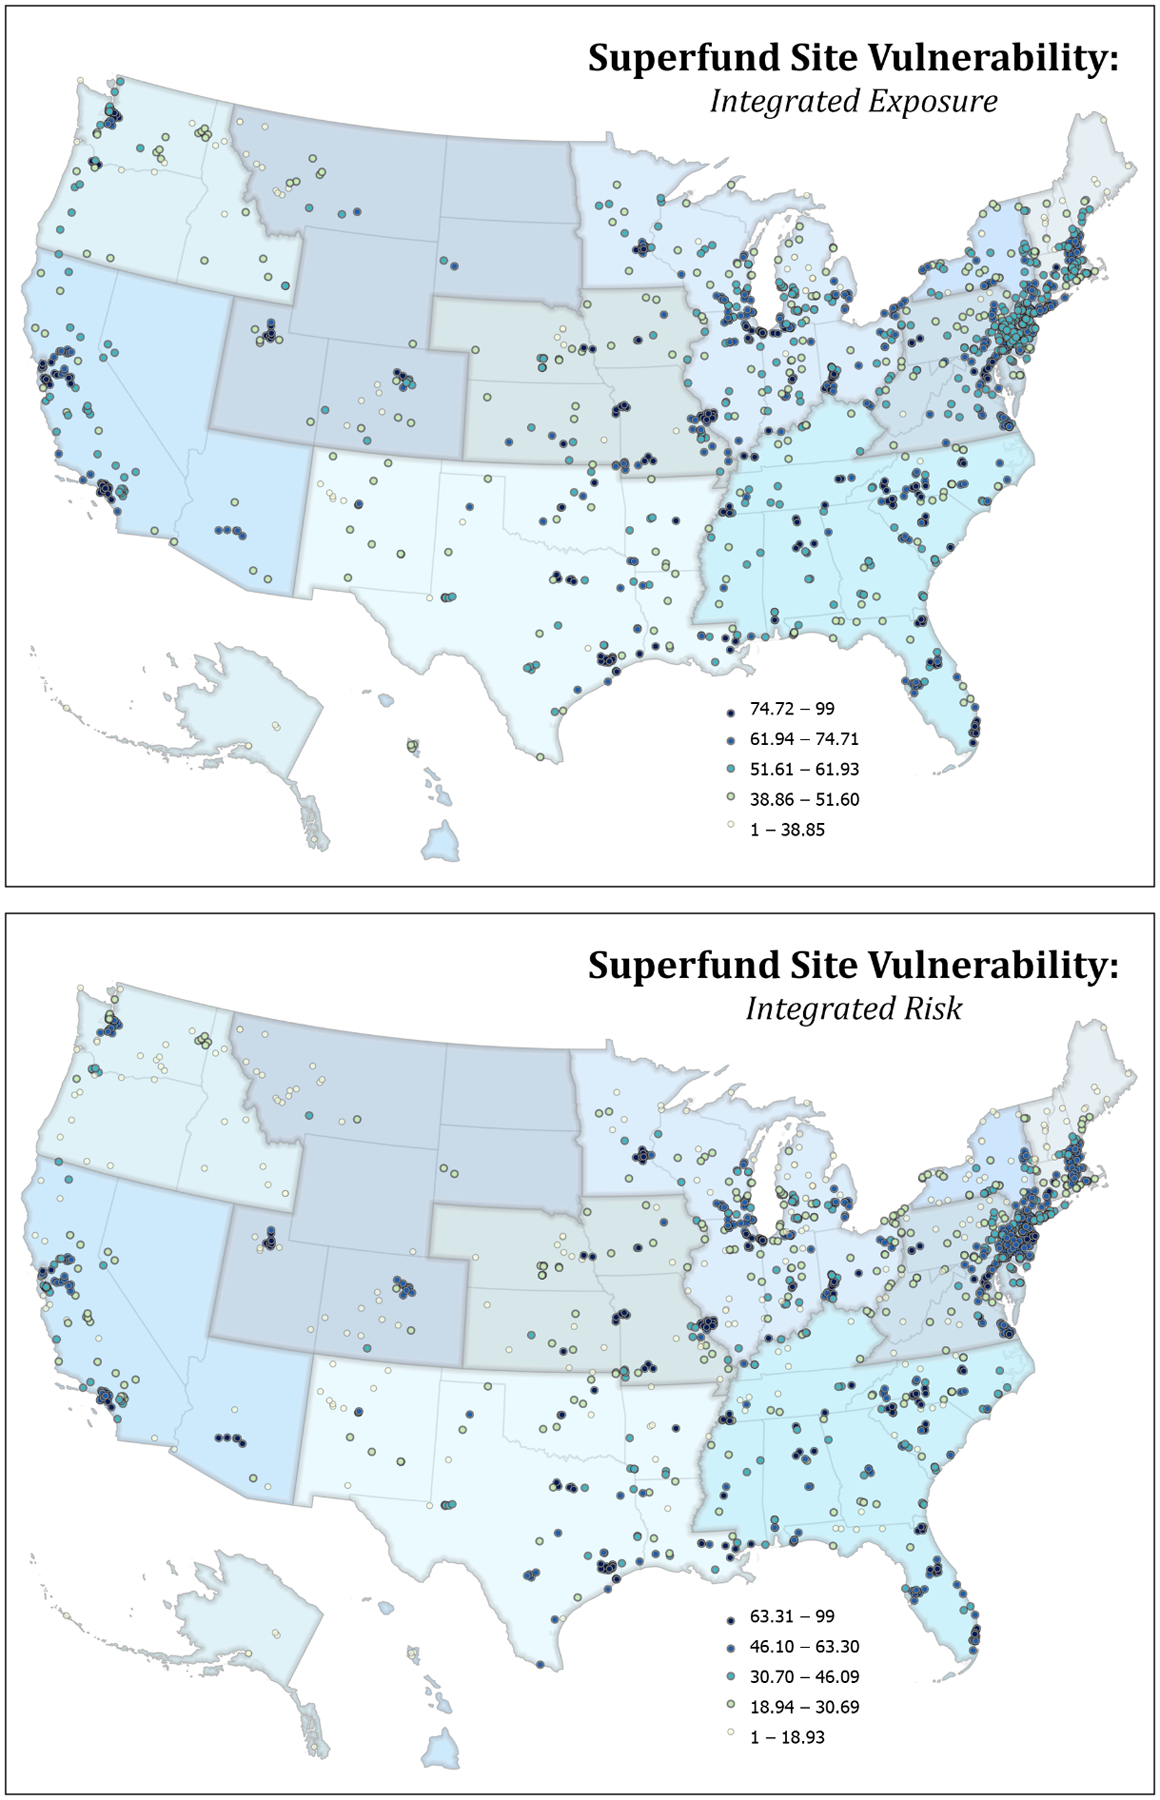
Superfund site vulnerability for integrated exposure (multiple hazard) and CRSI Risk Domain. Darker colors indicate higher probability of hazard exposure.
The highest site vulnerability (greater than 75) to coastal flooding occurs in southern Louisiana (Figure 4). Sites highly vulnerable to inland flooding sites occur in Houston, TX, around Salt Lake City, UT, southern Louisiana, the southeastern coast of Florida, St. Louis, MO, Duluth. MN, several locations in the Carolinas and Tennessee, Washington, DC and New York, NY (Figure 4). The highest likelihoods of drought at Superfund sites are spread throughout all states in the U.S. except Maine, New Hampshire, Vermont, South Dakota, Wyoming and Alaska (Figure 4). Unlike one of its causes – drought, the highest incidences of wildfires at Superfund sites are seen in California, Oregon and Washington with Texas, Oklahoma, New Mexico, Arizona, Colorado, Montana, Idaho and Utah. Additional single sites with high vulnerability to wildfires are located throughout the southeast. Extremes of cold temperature co-occur at sites located in Michigan, Wisconsin and Minnesota while extreme high temperatures co-occur at Superfund sites in the southwest, Texas and Oklahoma, and the south (Figure 4). Co-occurrence of extreme high temperatures at Superfund sites is also seen in Minnesota, Iowa, Michigan and Ohio.
Figure 4.
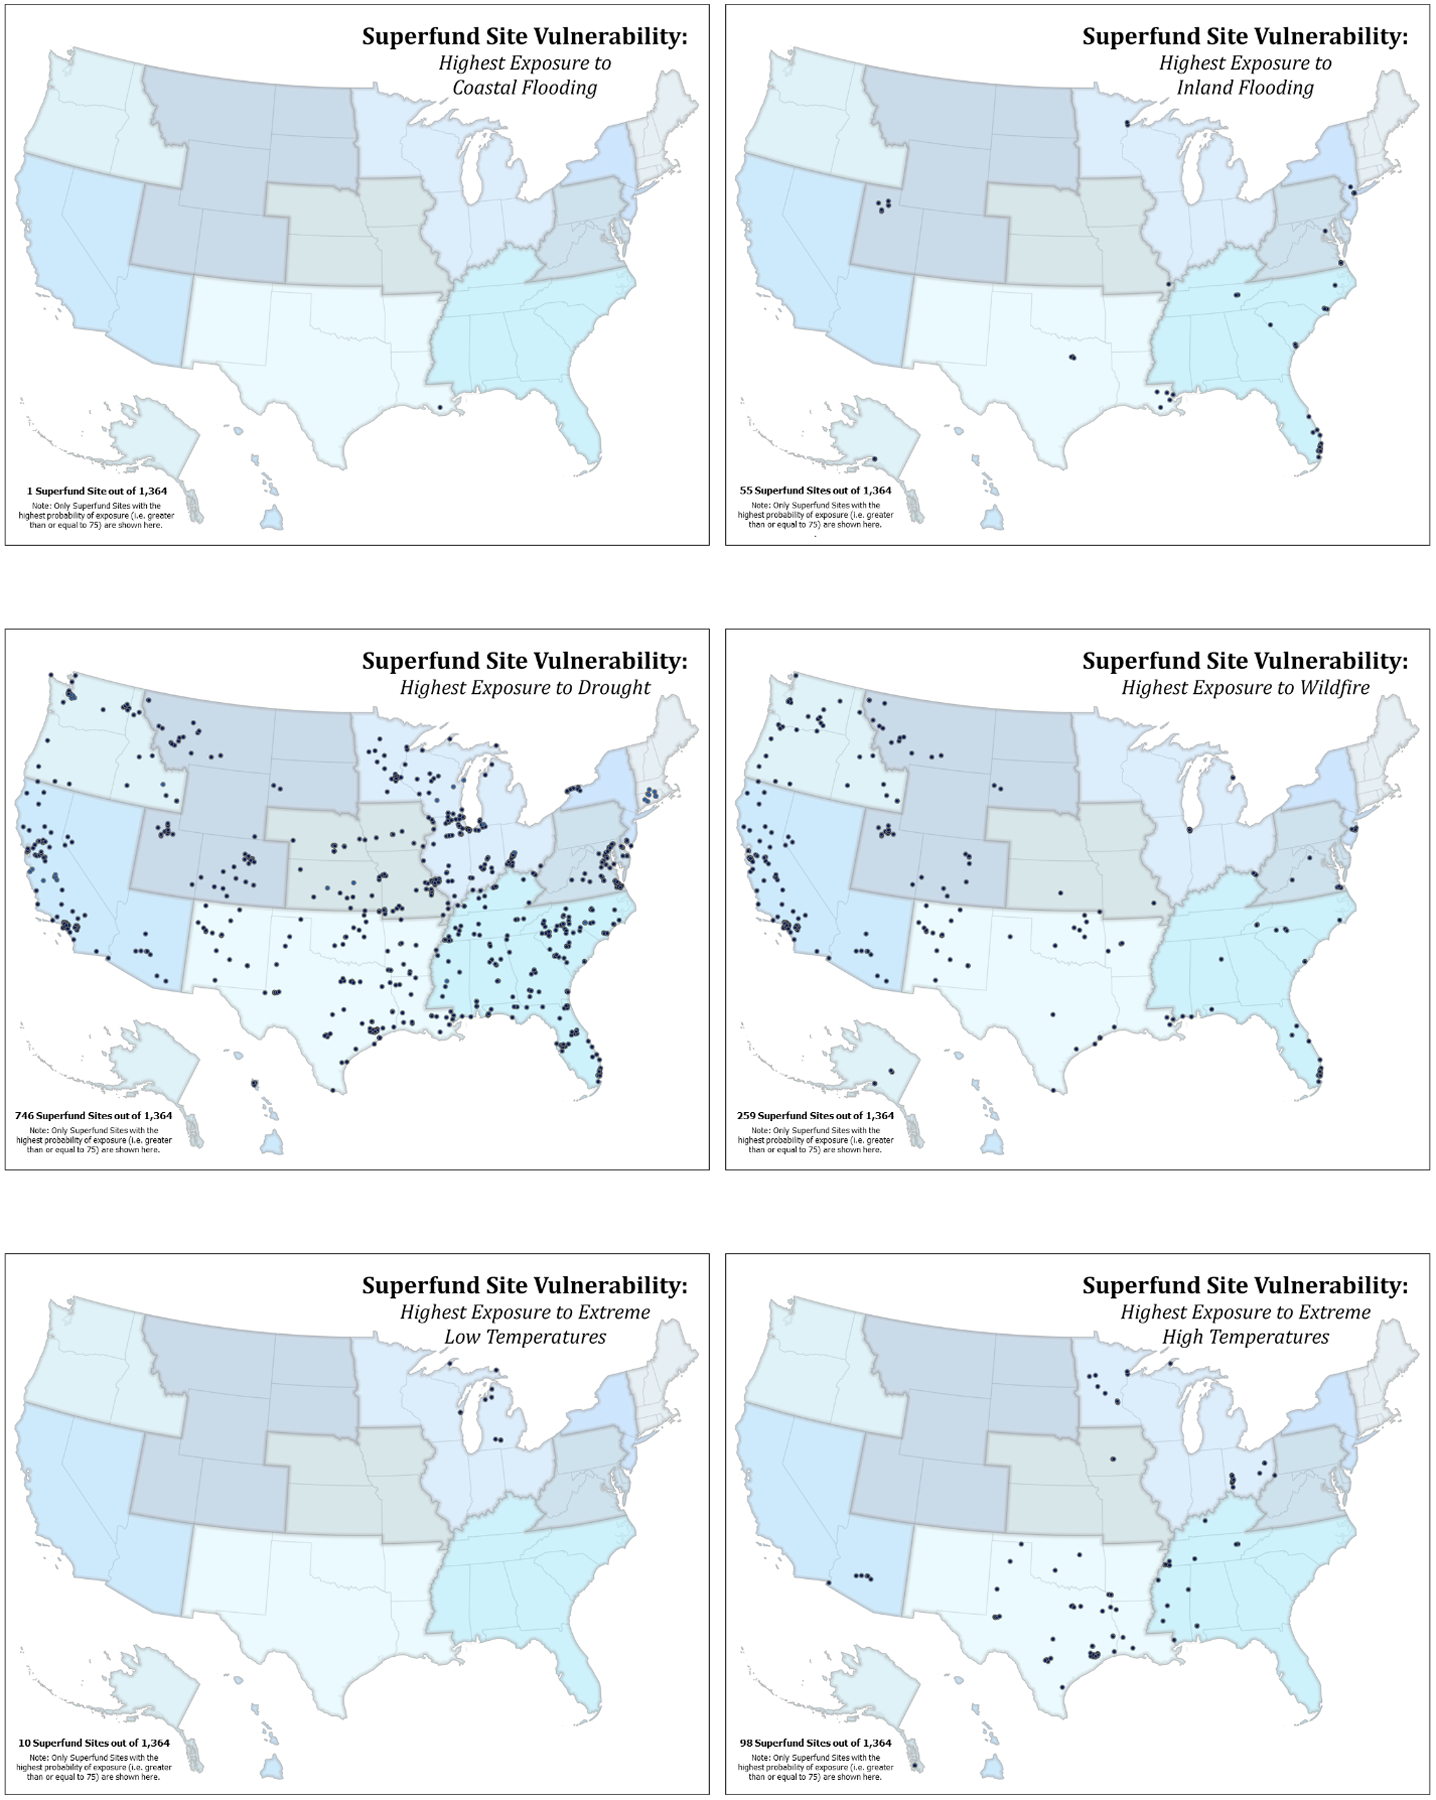
Superfund site vulnerability for indicated natural hazard for sites with scores > 75.
Unlike other natural hazards, the most vulnerable sites to earthquakes and landslides occur in clusters (Figure 5). The most vulnerable sites to earthquakes are located along the west coast, although a secondary cluster of highly vulnerable sites occurs near the confluence of the Mississippi and Ohio Rivers in Illinois, Ohio, Kentucky and Tennessee. Similarly, the highest vulnerability to landslides at Superfund sites appears in the states encompassing the Appalachian Mountains, Colorado and the west coast (Figure 5). Isolated sites with highest vulnerability to landslides occur in Houston, TX and Memphis, TN as well as in South Dakota and Montana. The highest vulnerability to hurricanes at Superfund sites occurs in northeastern Texas, southwestern Louisiana, and coastal North Carolina (Figure 5). The most vulnerable Superfund sites to tornadoes are distributed through the central U.S., the southeastern U.S., northern Indiana along the coast of Lake Michigan, and areas of the mid-Atlantic along the coast of the Chesapeake Bay (Figure 5). Superfund sites exposed to the highest probability of damaging winds and hailstorms are scattered throughout much of the continental U.S. (Figure 5).
Figure 5.
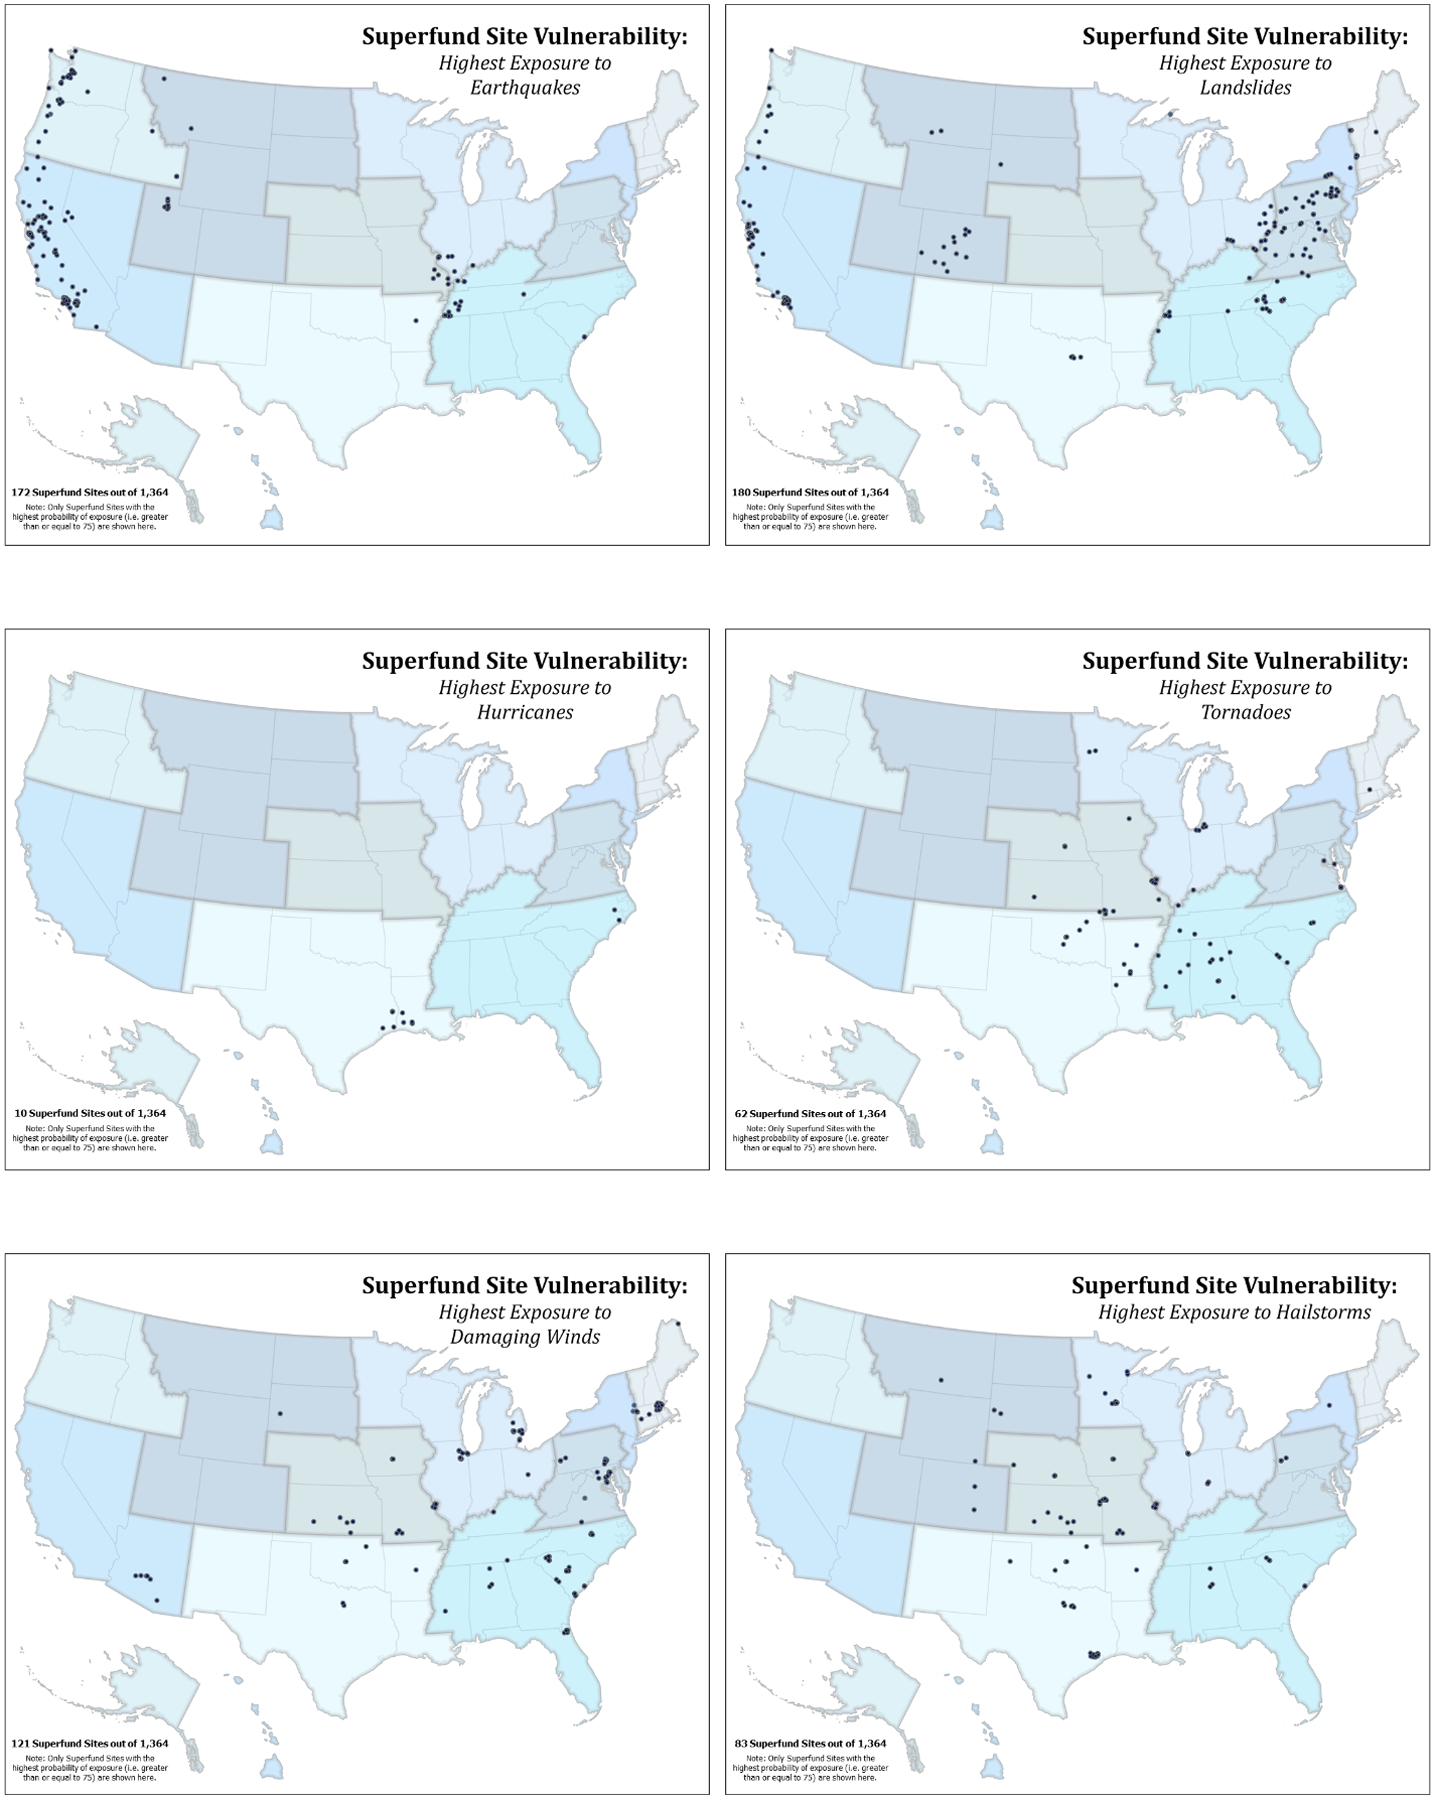
Superfund site vulnerability for indicated natural hazard for sites with scores > 75.
Superfund sites showing the highest likelihood of multi-hazard exposure (scores > 75) are clustered in many major metropolitan areas (Los Angeles and San Francisco, CA, Portland, OR, Seattle, WA, Chicago, IL, Kansas City, KS/MO, St. Louis, MO, Houston and Dallas, TX, Orlando, Miami and Jacksonville, FL, the Baltimore-Washington, DC corridor, the Carolinas, and cities along the Ohio River (Figure 6). Superfund sites with a high probability of exposure to multiple natural hazards almost exclusively occur in the eastern half of the United States (Figure 7) with two sites in North Charleston, SC being highly exposed to 9 of the twelve categories of natural hazards. The greatest impact from natural hazards is likely to be in major metropolitan areas. Superfund sites in the Houston and Chicago (including Gary, IN) metropolitan areas represent the greatest likelihood of exposure to multiple natural disasters for areas with populations of greater than three million (Figure 8). Metropolitan areas with similar population sizes (Dallas, Miami, and Baltimore/Washington, DC) also showed likely exposure of multiple hazards at their Superfund sites.
Figure 6.
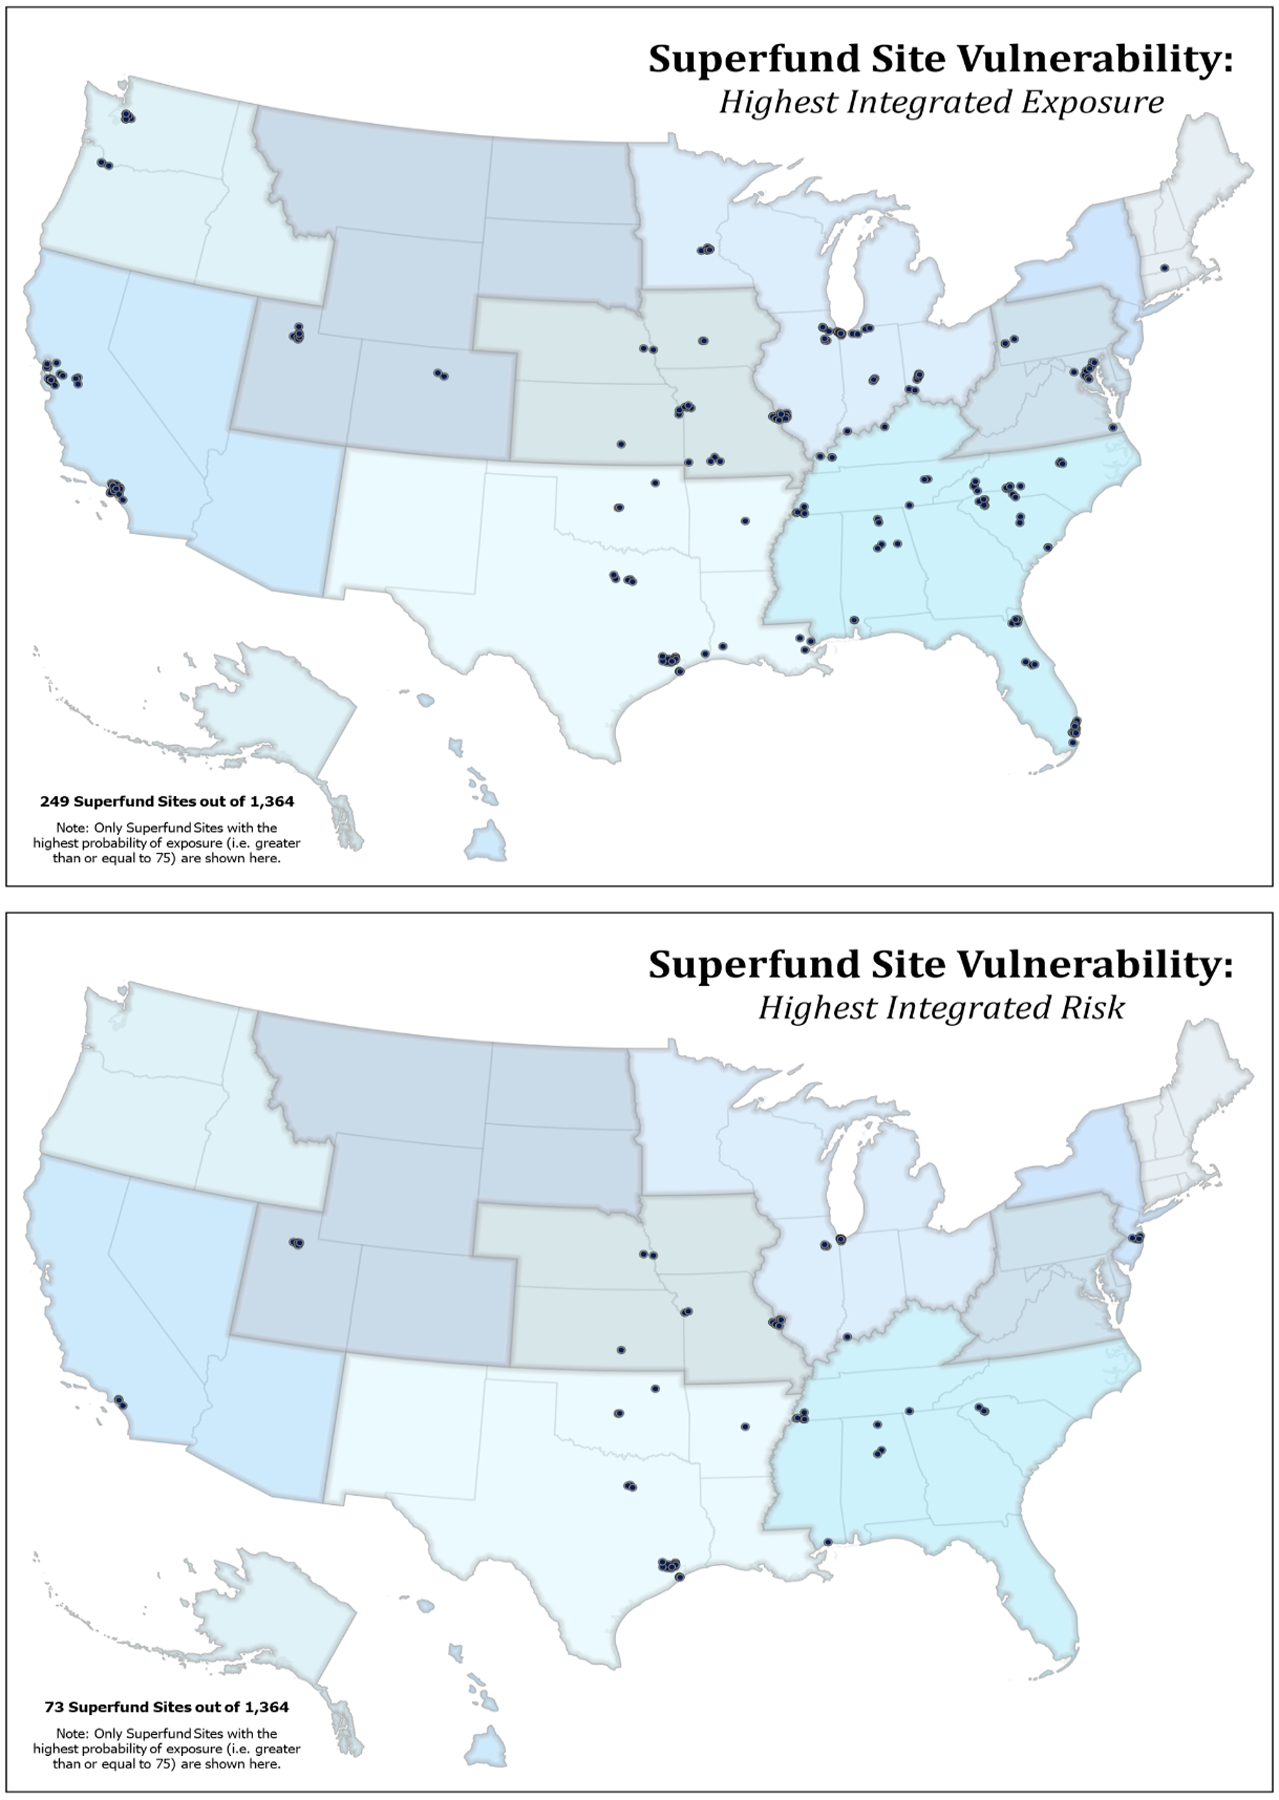
Superfund site vulnerability for integrated exposure and integrated risk (CRSI Domain) for sites with scores > 75.
Figure 7.
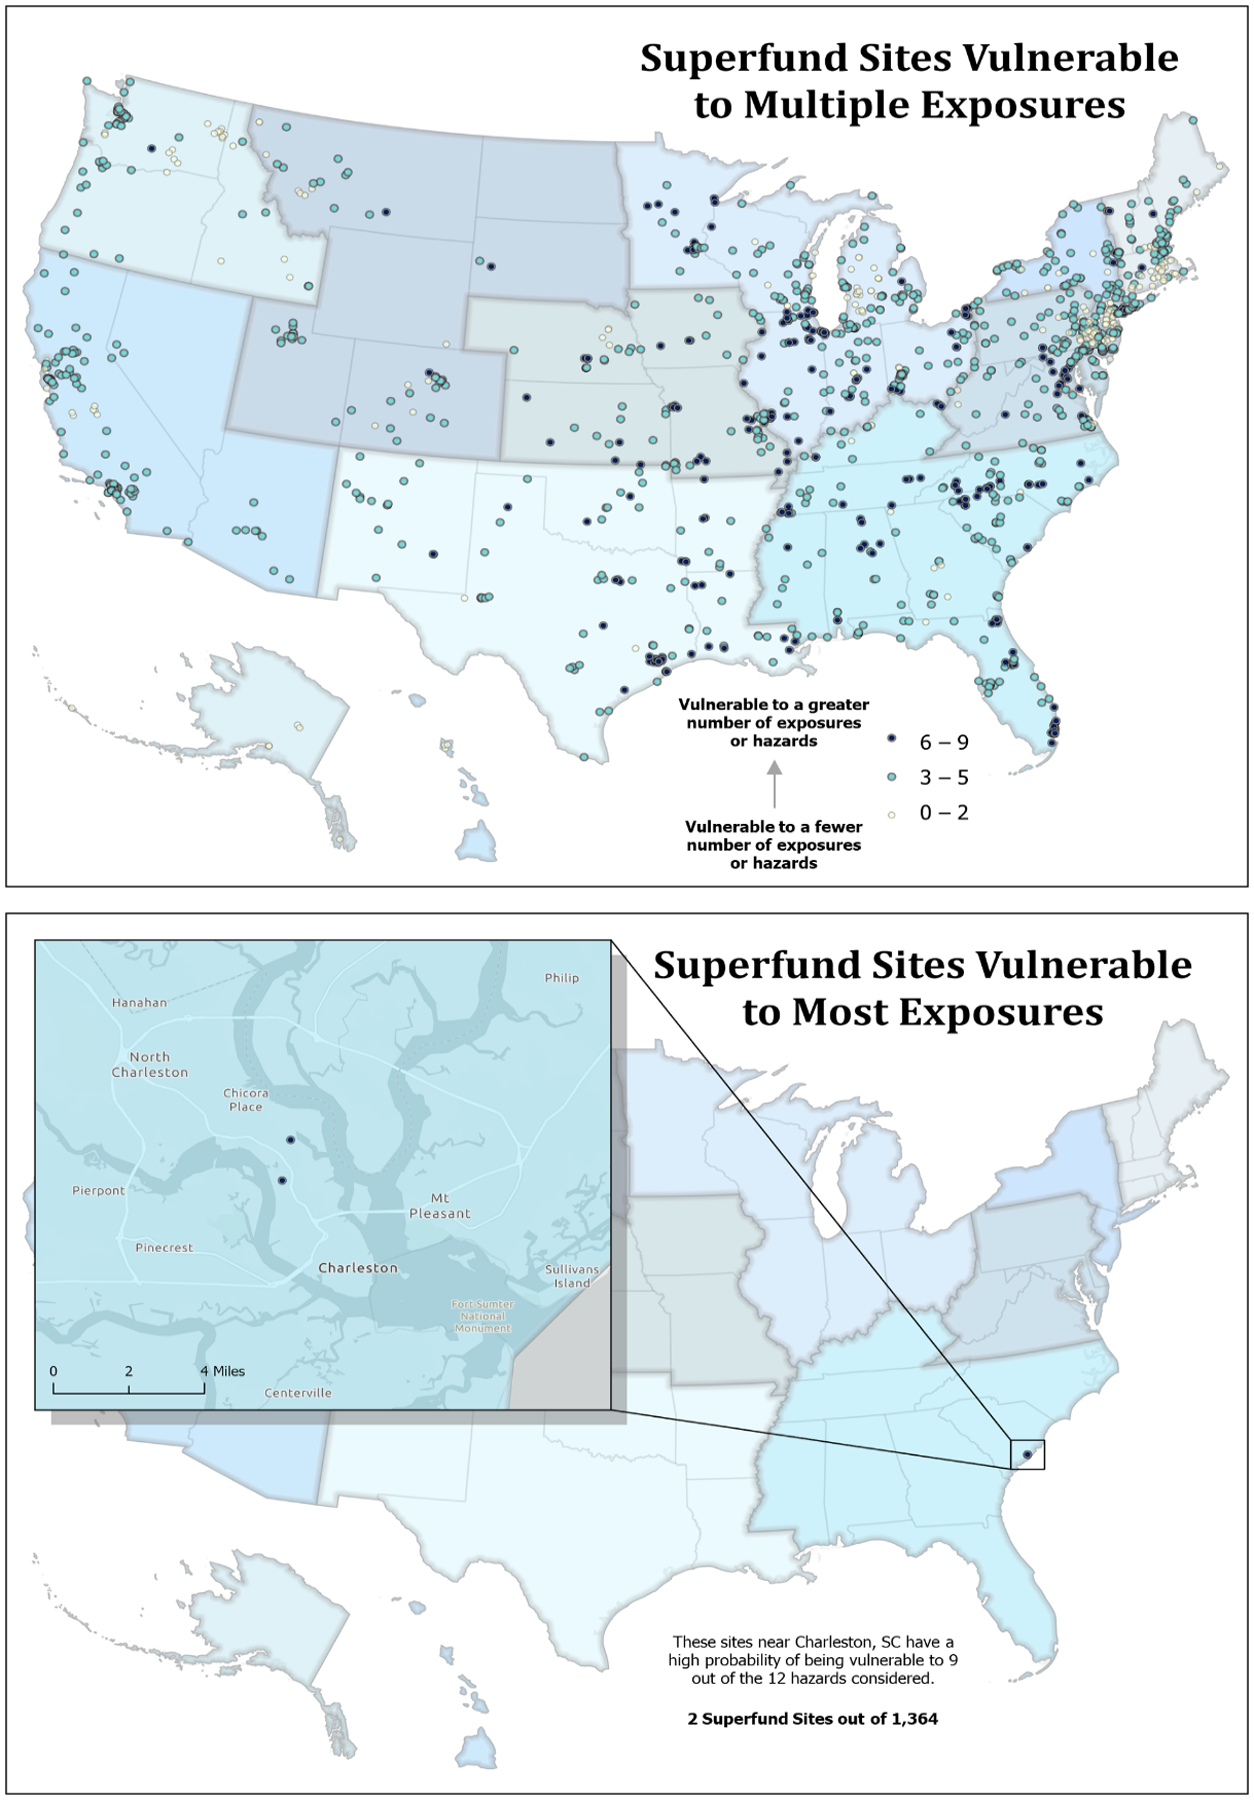
Superfund sites with high vulnerability to multiple natural hazards. Darker colors represent high risk of exposure to 6–9 natural hazards.
Figure 8.
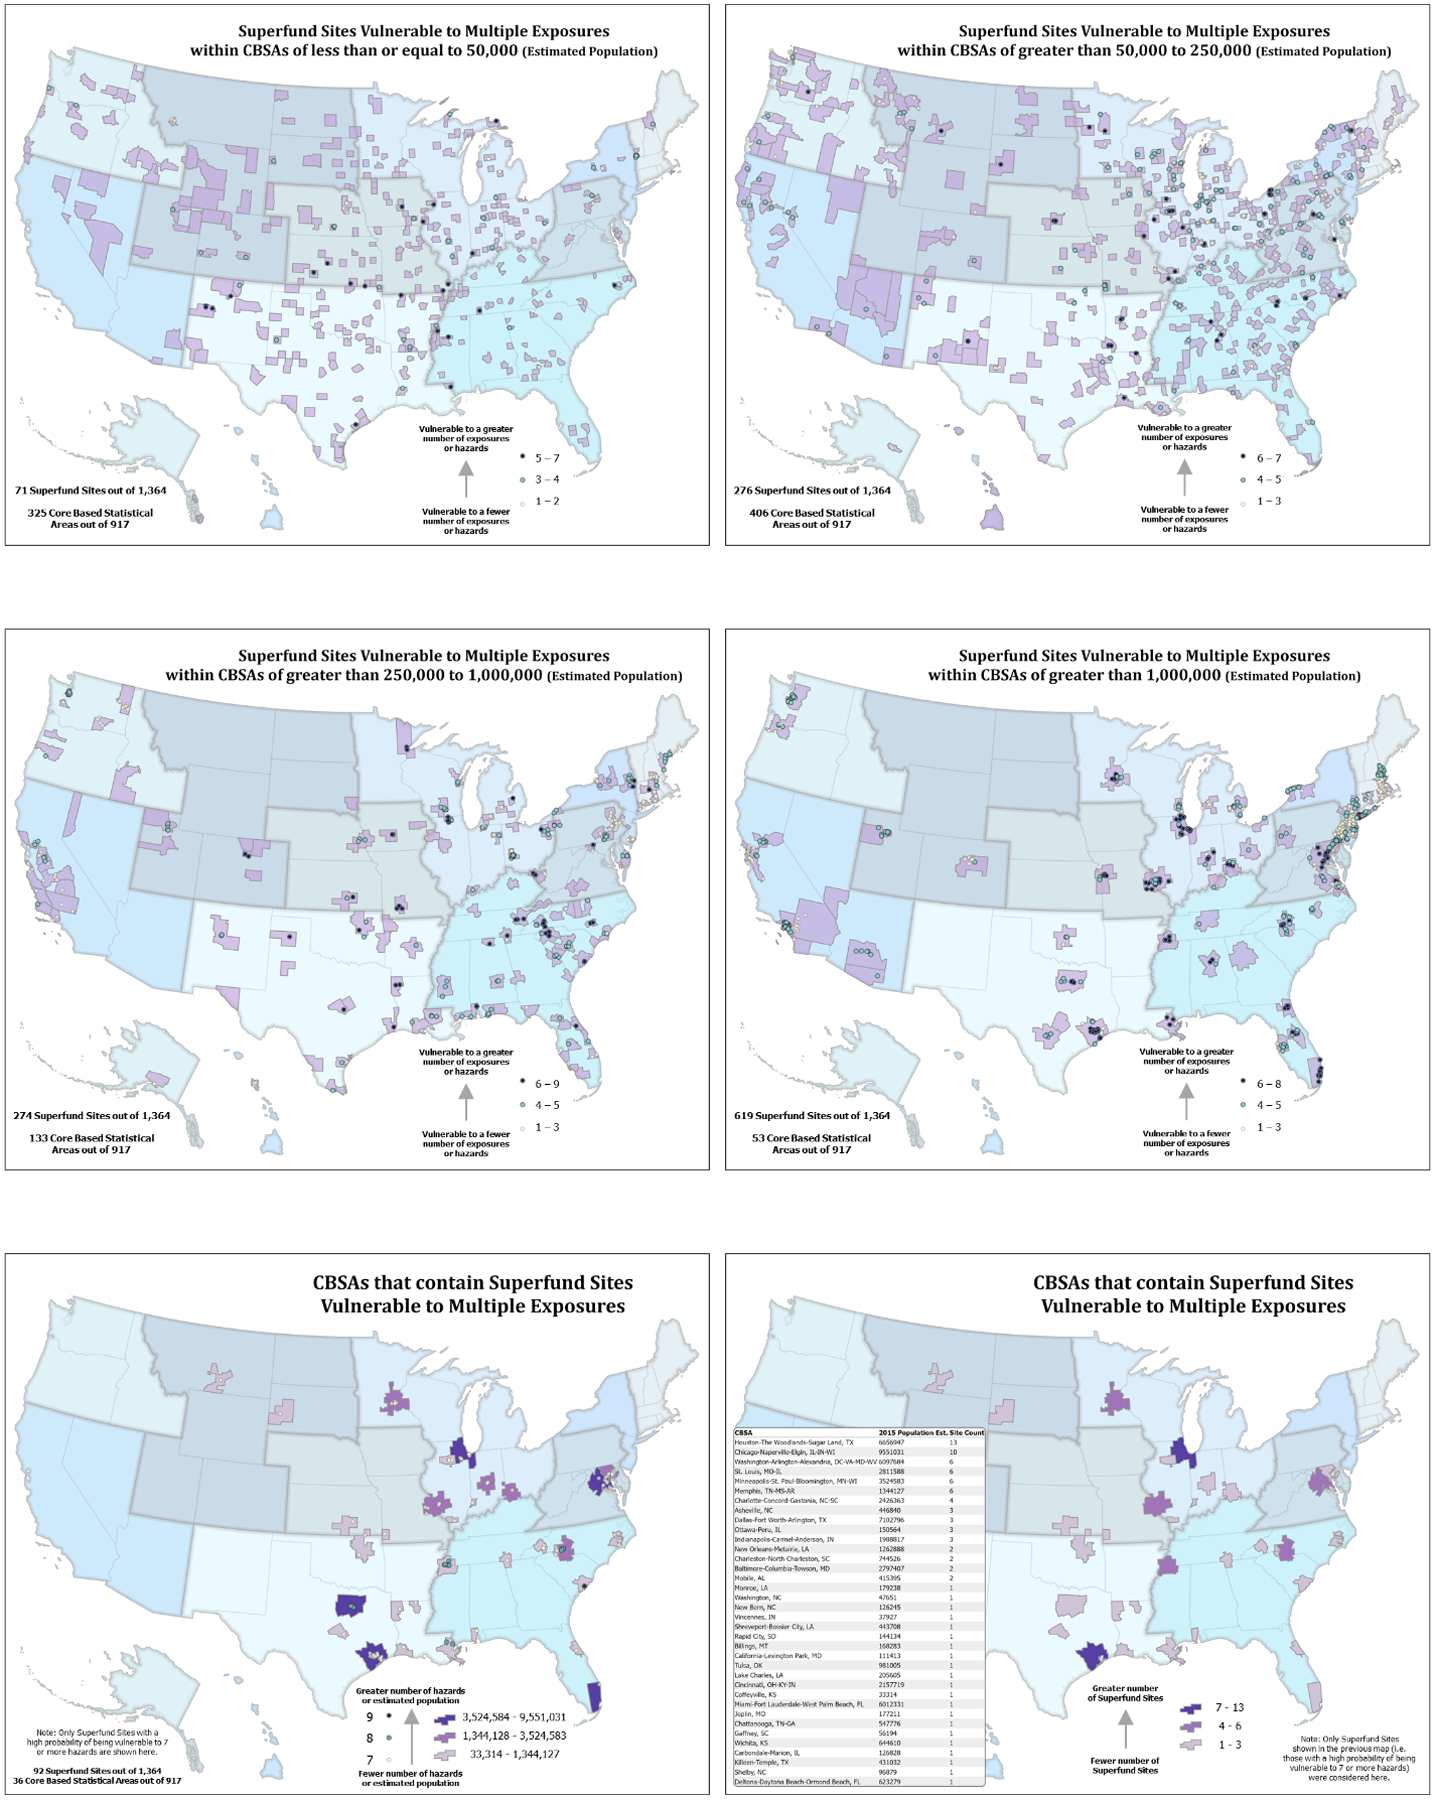
Superfund sites with high vulnerability to multiple natural hazards across US CBSAs.
Any study of this type has limitations based on the quality of information and availability of exact types of information. This study is no different. The assumptions and limitations of the exposure data are explicitly listed in the PRISM manuscript (Buck et al. 2018) and in CRSI manuscripts (Summers et al. 2017a, 2017b, 2018, 2020). One specific limitation of the mapping effort involves the combination of individual natural hazard exposures into a map representing multiple hazard exposures (Figure 7). This figure treats each hazard equally; however, some hazards can create more impact than others. The figure simply depicts the number of highly likely exposure types co-occurring at a site. It is not the intent of this exercise to assess the impacts of different combinations of exposures which would rely on specific remediation technologies at a site and the specific combinations of natural hazard exposures. The intent of the multiple exposure assessment is simply to ascertain that some sites can be exposed to multiple different natural hazards and any planning, remediation or restoration should examine the totality of potential exposures as they relate to the reincorporation of the site into its adjacent community.
Not all sites and remediation technologies have the same intrinsic characteristics. Toxic contamination of soil, sediment or groundwater are fundamentally different and do not have the same vulnerabilities. Natural hazards can interact with toxic contaminant sites is many ways. Mine drainage sites can release contaminants to adjacent ecosystems via flooding (Lin et al. 2007, Wright et al. 2018). Drought and high temperature can either volatize contaminants from holding ponds, enhance contaminant uptake (Patra et al. 2015), or dry out soil/sediment and with excessive winds distribute toxic dust into the local atmosphere (Labunska et al. 2013, Wang et al. 2018). Hurricanes can re-distribute toxic contaminants through coastal flooding, high wind and excessive rain (Bera et al. 2019, Dellapenna et al. 2020). Earthquakes can breach contained systems distributing contaminants (Kato et al. 2012). Therefore, local conditions should be examined in light of local situations and likelihood of exposures. Finally, the hazard data is county-based while the site location data represents a specific location within the county. The CRSI data represents a screening likelihood of exposure and may require some more specific investigation.
Discussion
The recovery and remediation of Superfund sites can clearly be impacted by exposure to natural hazards. These natural hazard exposures, by altering the remediation plans, can impact the long-term success of the restoration of these sites and impact the incorporation of these revitalized sites into their adjacent communities. Flooding, wildfires, hurricanes, tornadoes and earthquakes represent the greatest risks to revitalization.
The Government Accounting Office (GAO) reported that sixty percent of the nation’s Superfund sites are at risk from the impacts of inland flooding and hurricane storm surges that could re-distribute their toxic materials into communities (GAO 2019). Over two million people in the U.S. live within one mile of a Superfund site. Toxic contaminants associated with these sites can spread into nearby communities when flooded. Extreme floods, both coastal storm surges and inland flooding, are expected to increase in frequency and intensity in the future, potentially increasing the likelihood of flooding at Superfund sites and the chances that more people may be exposed to flood waters contaminated with hazardous materials (Carter and Kalman 2019). People most vulnerable to contaminated floodwater exposures from Superfund sites tend to be low-income and minority populations who make up a greater proportion of individuals living near these sites (Carter and Kalman 2019). The information and maps reported in this manuscript identify locations with highest site and population vulnerabilities to help with the incorporation of mitigation efforts in revitalization planning.
Superfund sites near New Orleans, LA, coastal North Carolina and Houston, TX have all been affected by coastal surges due to hurricanes (Katrina, Florence, and Harvey, respectively). A contaminated site in South Carolina, Shipyard Creek and the adjacent Superfund site, are undergoing remediation. The adjacent industrial facility produced ferrochromium steel that leached chromium into the estuary. Runoff from the site flowed into Shipyard Creek, a tributary of the Cooper River, and into an adjacent wetland. Based on the analysis presented here, this site is among the sites most likely to be exposed to multiple natural disasters (9 of the measured 12 natural hazards) (Figure 7) making its remediation more difficult and the incorporation of the end result of the remediation into the North Charleston, SC community more problematic. The most recent five year review (EPA, Region 4 2015) found that the site protects human health and the environment in the short-term. In May 2006, institutional controls and restrictive covenants were executed to limit future use of this site to commercial/industrial purposes and prohibit the use of groundwater underlying the property.
Seven Superfund sites in the greater Houston metropolitan area are potentially exposed to a majority of the categorized natural hazards and could expose millions of people to toxic releases from the sites in the event of extreme flooding, hurricanes, wildfires, extreme temperatures, and wind events (Figure 8). These sites include a foundry (with large numbers of abandoned drums of catalyst waste), petrochemical facilities, wood treating and preserving facilities, transformer salvage and recycling facilities, a herbicide production facility, and a dry cleaning facility. Many of the facilities were affected by flooding during Hurricane Harvey (Olsen 2017) damaging earlier remediation activities such as loosening protective caps for toxic materials or exacerbating groundwater exposure.
Smoke and direct chemical releases from fire can impact ecosystems and human health, even at great distances from the burned area. If the burned area includes a Superfund site even greater issues associated with airborne toxicants are possible. Recent studies have shown that extreme weather conditions, including wildfires, can induce the undesired transport of contaminated sediments into surrounding areas (Turetsky et al. 2006). EPA is supporting communities in the assessment of their vulnerabilities and preparedness to these natural hazards, including unintended releases of toxic chemicals from Superfund, hazardous waste disposal, storage and treatment sites, and industrial sites due to wildfires and flooding (Pugh et al. 2019). Superfund sites often contain legacy pollution from multiple industrial sources or landfills. They require complex and resource-intensive remediation, which can take years to complete. Communities living in close proximity to contaminated sites may be affected by wildfire related environmental stressors such as airborne toxic contamination which can pose health risks. The assessment conducted here shows over 250 Superfund sites throughout the U.S., but with many concentrated in the west, displaying high likelihood for exposure to fire. These sites include military bases, mining facilities and smelters, chemical production facilities, and wood treating facilities. Wildfires could volatilize toxicants from any of these types of remediation sites.
As storms and extreme rainfall events have become more frequent and more intense in recent years, the extent to which these storms will spawn tornadoes is not yet clear (U.S. Climate Change Program 2008). However, if there is more water vapor evaporating, more energy in the atmosphere, and a greater likelihood for stronger heating events that lead to stronger thunderstorms, super cells can be produced that can lead to tornados (Science Daily 2008). While there is no conclusive evidence that climate change is related to small scale phenomena such as tornadoes, lightning, dust storms and hail, there is ample anecdotal information documenting the increased frequency and intensity of tornadoes (Mooney 2008). Several of these extreme weather events have affected Superfund toxic waste sites (Science Daily 2008). For example, on May 10, 2008, a serious Category EF 4 tornado hit the mining town of Picher located in the heart of one of the country’s largest Superfund sites, the Tar Creek Site. Picher is characterized by lead dust from massive piles of mining waste called “chat”. Covering acres, these “chat” waste piles contain lead, zinc and other metals. In 2004, The Superfund Program and the state of Oklahoma spent more than $40 million in a cleanup of the site which included a voluntary house buy-out. Unfortunately, those who stayed behind were there when the tornado hit the town four years later further distributing toxics through the air and water. The assessment conducted in this manuscript demonstrates that the Tar Creek site has high general exposure to natural hazards that includes wildfires, drought and wind events as well as tornadoes. The potential occurrence of multiple natural hazards should be considered when planning remediation and restoration at Superfund sites to protect human health and the environment.
Conclusions
The assessment of the co-occurrence of natural hazards and active and proposed Superfund site locations demonstrates that there is significant probability of one or more natural hazards interacting with the majority of Superfund sites. As EPA’s Administrator and leaders from the Office of Land and Emergency Management (OLEM) stated in testimony to the Senate (U.S. Senate Committee on Environment and Public Works. 2020), the Superfund Program has progressed beyond basic remediation of its sites to revitalization of the sites into productive and important elements of the local community. Because natural hazard exposure may impact Superfund site remediation, considering their occurrence is prudent when developing remediation plans. There is ample evidence that these types of natural hazards can impact remediation planning, processes, and, even, after the fact remediation completion. The information provided in this manuscript enables Superfund remediation planners to incorporate natural hazard exposure into their specific plans. In addition, this information enables multi-exposure considerations, which may be important where mitigation for one type of exposure may interact with the mitigation strategy for a different exposure.
Acknowledgements
All research activities for this effort were funded through general U.S. Environmental Protection Agency funding in FY20 to the Office of Research and Development. The authors express their appreciation to Dr. Joel Hoffman for review of an early draft of the manuscript.
Footnotes
Publisher's Disclaimer: Disclaimer
Publisher's Disclaimer: The views expressed in this manuscript are those of the authors and do not necessarily represent the views or policies of the U.S. Environmental Protection Agency. Any mention of trade names, products, or services does not imply an endorsement by the U.S. Government or the U.S. Environmental Protection Agency. The EPA does not endorse any commercial products, services, or enterprises.
References
- Abbott PL (2004) Natural Disasters. Fourth Edition. McGraw Hill, New York, NY. [Google Scholar]
- ARUP. (2014). City Resilience Framework. The Rockefeller Foundation, ARUP Development International. [Google Scholar]
- Associated Press (2007) Judge OKs deal over Katrina-related oil spill. 30 January 2007. http://www.msnbc.com/id/16892313/ns/us_news-life/t/judge-oks-deal-over-katrina-related-oil-spill/
- Bardos P, Couon F, Erickson-Mulanax E, Hansen LJ, Maco B, Harclerode M, Hou D, et al. (2018). Resilient Remediation: Addressing Extreme Weather and Climate Change, Creating Community Value. Remediation 29(1): 7–18. [Google Scholar]
- Bera G, Camargo K, Sericano JL, Liu Y, Sweet ST, Horney J, Jun M, Chiu W, Rusyn I, Wade T, Knap AH (2019). Baseline data for distribution of contaminants by natural disasters: results from a residential Houston neighborhood during Hurricane Harvey flooding. Heliyon, 5: e2860. [DOI] [PMC free article] [PubMed] [Google Scholar]
- Binder S, Sanderson LM (1987) The role of the epidemiologist in natural disasters. Annals of Emergency Medicine 16: 1081–1084. [DOI] [PubMed] [Google Scholar]
- Buck KD, Summers JK, Smith LM (2018). Development of a Multi-Hazard Landscape for Exposure and Risk Interpretation: The PRISM Approach. Current Environmental Engineering 6(1): 74–94. [DOI] [PMC free article] [PubMed] [Google Scholar]
- Burger J, Gochfeld M (2016). Initiating events, functional remediation, and assessment of risk to ecological resources. Ecological Indicators 71: 32–40. [Google Scholar]
- Carter JM, Kalman C (2019) Future Floods & Superfund Sites: Toxic Contamination Risks in Coastal Communities. Presented American Geophysical Union, Fall Meeting 2019. https://ui.adsabs.harvard.edu/abs/2019AGUFMIN44B..07C/abstract [Google Scholar]
- Cruz AM, Steinberg LJ, Luna R (2001) Identifying hurricane-induced hazardous material release scenarios in a petroleum refinery. Natural Hazards Review 2: 203–210. [Google Scholar]
- Dellapenna TM, Hoelscher C, Hill L, Al Mukaimi ME, Knap A (2020). How tropical cyclone flooding caused erosion and dispersal of mercury-contaminated sediment in an urban estuary: The impact of Hurricane Harvey on Buffalo Bayou and the San Jacinto Estuary, Galveston Bay, USA. Science of The Total Environment 748: 141226. [DOI] [PMC free article] [PubMed] [Google Scholar]
- EEA (European Environment Agency) (2019). Progress in Management of Contaminated Sites. https://www.eea.europa.eu/data-and-maps/indicators/progress-in-management-of-contaminated-sites-3/assessment
- Evangeliou N, Balkanski Y, Cozic A, Hao WM, Møller AP (2014). Wildfires in Chernobyl-contaminated forests and risks to the population and the environment: A new nuclear disaster about to happen?. Environment International 73: 346–358. [DOI] [PubMed] [Google Scholar]
- GAO (U.S. Government Accounting Office). (2019). SUPERFUND - EPA Should Take Additional Actions to Manage Risks from Climate Change. GAO-20–73. https://www.gao.gov/assets/710/702158.pdf [Google Scholar]
- Homer C, Dewitz J, Yang L, Jin S, Danielson P, Xian G, et al. (2015). Completion of the 2011 National Land Cover Database for the conterminous United States-Representing a decade of land cover change information. Photogrammetric Engineering and Remote Sensing 81(5): 345–354. [Google Scholar]
- Hooda PS, Alloway BJ (1993). Effects of Time and Temperature on the Bioavailability of Cd and Pb from Sludge Amended Soils. Journal of Soil Science 44(1): 97–110. [Google Scholar]
- Kato H, Onda Y, Teramage M (2012). Depth distribution of 137Cs, 134Cs, and 131I in soil profile after Fukushima Dai-ichi Nuclear Power Plant Accident. Journal of Environmental Radioactivity 111: 59–64. [DOI] [PubMed] [Google Scholar]
- Krausmann E, Cruz AM, Affeltranger B (2010) The impact of the 12 May 2008 Wenchuan earthquake on industrial facilities. Journal of Loss Prevention in the Process Industries 23: 242–248 [Google Scholar]
- Labunska I, Harrad S, Santillo D, Johnston P, Brigden K (2013). Levels and distribution of polybrominated diphenyl ethers in soil, sediment and dust samples collected from various electronic waste recycling sites within Guiyu town, southern China. Environmental Science: Processes & Impacts 15: 503–511. [DOI] [PubMed] [Google Scholar]
- Legal Information Institute. 2020. 42 U.S. Code Chapter 103—Comprehensive Environmental Response, Compensation, and Liability. https://www.law.cornell.edu/uscode/text/42/chapter-103
- Lin C, Wu Y, Lu W, Chen A, Liu Y (2007). Water chemistry and ecotoxicity of an acid mine drainage-affected stream in subtropical China during a major flood event. Journal of Hazardous Materials 142: 199–207. [DOI] [PubMed] [Google Scholar]
- Lindell M, Perry J (1996a) Addressing gaps in environmental emergency planning: hazardous materials releases during earthquakes. Journal of Environmental Planning and Management. 39: 529–543. [Google Scholar]
- Lindell M, Perry R (1996b) Identifying and managing conjoint threats: earthquake-induced hazardous materials releases in the US. Journal of Hazardous Materials Releases. 50: 31–46. [Google Scholar]
- Lindell M, Perry R (1998) Earthquake impacts and hazard adjustments of acutely hazardous materials facilities following the Northridge earthquake. Earthquake Spectra. 14: 285–299. [Google Scholar]
- Melillo JM, Richmond T, and Yohe GW (2014). Climate Change Impacts in the 11 United States: The Third National Climate Assessment. U.S. Global Change Research Program, 12. http://nca2014.globalchange.gov/report [Google Scholar]
- Mooney C (2008) Is climate change causing an upsurge in US tornadoes? New Scientist 2667, 30 July 2008. https://www.newscientist.com/article/mg19926671-800-is-climate-change-causing-an-upsurge-in-us-tornadoes/ [Google Scholar]
- Nadal M, Marques M, Mari M, Domingo J (2015). Climate change and environmental concentrations of POPs: A review. Environmental Research 143A: 177–185. [DOI] [PubMed] [Google Scholar]
- Olsen L (2017) EPA says Harvey flooded or may have damaged 13 Superfund sites. Houston Chronicle, September 2, 2017. https://www.chron.com/news/houston-weather/hurricaneharvey/article/EPA-says-only-13-Superfund-sites-flooded-and-or-12169602.php [Google Scholar]
- Panagos P, Van Liedekerke M, Yigini Y, Montanarella L (2013) Contaminated Sites in Europe: Review of the Current Situation Based on Data Collected through a European Network. Journal of Environmental and Public Health, 2013:158764. 10.1155/2013/158764 [DOI] [PMC free article] [PubMed] [Google Scholar]
- Pease P, Lecce S, Gares P, Rigsby C (2007). Heavy metal concentrations in sediment deposits on the Tar River floodplain following Hurricane Floyd. Environmental Ecology 51(7): 1103–1111. [Google Scholar]
- Pielke RA Jr, Gratz J, Landsea CW, Collins D, Saunders MA, Musulin R (2008). Normalized hurricane damage in the United States: 1900–2005. Natural Hazards Review 9: 29–42. [Google Scholar]
- Pugh C, Whung PY, Barber J, Essoka J and Priester N (2019) EPA Research Highlights -Research to Advance Community Resilience. em – The Magazine for Environmental Managers. https://www.epa.gov/sites/production/files/2019-09/documents/research_to_advance_community_resilience.pdf [Google Scholar]
- Rothwell JJ, Evans MG, Liddaman LC, Allott TEH (2007). The role of wildfire and gully erosion in particulate Pb export from contaminated peatland catchments in the southern Pennines, UK. Geomorphology, 88: 276–284. [Google Scholar]
- Science Daily (2008) “Tornados, Flooding May Warn of Climate Change,” Science Daily, June 4. http://www.sciencedaily.com/releases/2008/06/08062231312.htm. [Google Scholar]
- Sengul H, Santella N, Steinberg LJ, Cruz AM (2012). Analysis of hazardous material releases due to natural hazards in the United States. Disasters, 36(4), 723–743. [DOI] [PubMed] [Google Scholar]
- Showalter PS, Myers MF (1992) Natural Disasters as the Cause of Technological Emergencies: A Review of the Decade 1980–1989, Working Paper 78. Natural Hazards Research Center, Boulder CO. [Google Scholar]
- Showalter PS, Myers MF (1994) Natural disasters in the United States as release agents of oil, chemicals, or radiological materials between 1980–1989. Analysis and recommendations. Risk Analysis 14: 169–182. [DOI] [PubMed] [Google Scholar]
- Smith K (2001) Environmental Hazards: Assessing Risk and Reducing Disasters. Routledge Press: New York, NY. [Google Scholar]
- Summers JK, Smith LM, Harwell LC and Buck KD. (2017a). Conceptualizing holistic community resilience to climate events: Foundation for a climate resilience screening index. GeoHealth 1: 151–164. [DOI] [PMC free article] [PubMed] [Google Scholar]
- Summers JK, Harwell LC, Buck KD Smith LM, Vivian DN, Bousquin JJ, Harvey JE, Hafner SF, McLaughlin MD (2017b). Resilience Screening Index (CRSI): An Assessment of Resilience to Acute Meteorological Events and Selected Natural Hazards. EPA600/R-17/238.
- Summers JK, Harwell LC, Smith LM, Buck KD (2018). Measuring Community Resilience to Natural Hazards - The Natural Hazard Resilience Screening Index (NaHRSI): Development and Application to the U.S. GeoHealth 2, 372–394. doi: 10.1029/2018GH000160 [DOI] [PMC free article] [PubMed] [Google Scholar]
- Summers JK, Harwell LC, Buck KD Smith LM, Vivian DN, Bousquin JJ, Harvey JE, Hafner SF, McLaughlin MD, McMillion CA (2020). Development of a Cumulative Resilience Screening Index (CRSI) for Natural Hazards: An Assessment of Resilience to Acute Meteorological Events and Selected Natural Hazards. EPA600/R-20/xxx.
- Turetsky MR, Harden JW, Friedli HR, Flannigan M, Payne N, Crock J, Radke L (2006). Wildfires threaten mercury stocks in northern soils. Geophysical Research Letters 33: L16403. [Google Scholar]
- US Climate Change Science Program (CCSP) (2008) Weather and Climate Extremes in a Changing Climate, Regions of Focus: North America, Hawaii, Caribbean, and U.S. Pacific Islands, Synthesis and Assessment Product 3.3, June. http://www.climatescience.gov/Library/sap/sap3-3/final-report/default.htm.
- U.S. Environmental Protection Agency (U.S. EPA), Region 4 (2015) Five-Year Review Report Second Five-Year Review Report for Macalloy Corporation SCD003360476 Charleston, Charleston County, South Carolina August 2015. https://semspub.epa.gov/work/04/11014572.pdf
- U.S. Environmental Protection Agency (U.S. EPA) (2020). Superfund National Priorities List (NPL) Sites with Status Information. https://epa.maps.arcgis.com/home/item.html?id=c2b7cdff579c41bbba4898400aa38815&view=list#overview
- U.S. Senate Committee on Environment and Public Works. 2020. Oversight of the Environmental Protection Agency. May 20, 2020. https://www.epw.senate.gov/public/index.cfm/2020/5/oversight-of-the-environmental-protection-agency
- Van der Vink G, Allen R, Chapin J, Crooks M, Fraley W, Krantz J, Lavigne A, LeCuyer A, MacColl E, Morgan W, Ries B, Robinson E, Rodriquez K Smith M, Sponberg K (1998) Why the United States is becoming more vulnerable to natural disasters. EOS Transactions. 79: 533–537. [Google Scholar]
- Wang Y, Sun H, Zhu H, Yao Y, Chen H, Ren C, Wu F, Kannan K (2018). Occurrence and distribution of organophosphate flame retardants (OPFRs) in soil and outdoor settled dust from a multi-waste recycling area in China. Science of the Total Environment 625: 1056–1064. [DOI] [PubMed] [Google Scholar]
- Wright IA, Paciuszkiewicz K, Belmer N (2018). Increased water pollution after closure of Australia’s longest operating underground coal mine: a 13-month study of mine drainage, water chemistry and river ecology. Water, Air, & Soil Pollution, 229: 1–20. [Google Scholar]
- Young S, Balluz L and Malilay J (2004) Natural and technologic hazardous material releases during and after natural disasters: a review. Science of the Total Environment. 322: 3–20. [DOI] [PubMed] [Google Scholar]


