Abstract
The human tympanic membrane (TM) and ossicles are generally considered to act as a linear system as they conduct low and moderate level environmental sounds to the cochlea. At intense stimulus levels (> 120 dB SPL) there is evidence the TM and ossicles no longer act linearly. The anatomical structures that contribute to the nonlinear responses and their level and frequency dependences are not well defined. We used cadaveric human ears to characterize middle-ear responses to continuous tones between 200 and 20000 Hz with levels between 60 and 150 dB SPL. The responses of the TM and ossicles are essentially sinusoidal, even at the highest stimulus level, but grow nonlinearly with increased stimulus level. The umbo and the stapes show different nonlinear behaviors: The umbo displacement grows faster than the stimulus level (expansive growth) at frequencies below 2000 Hz, while the stapes exhibits mostly compressive growth (grows slower than the stimulus level) over a wide frequency range. The sound pressure level where the nonlinearity first becomes obvious and the displacement at that level are lower at the stapes than at the umbo. These observations suggest the presence of multiple nonlinear processes within the middle ear. The existence of an expansive growth of umbo displacement that has limited effect on the stapes compressive growth suggests that the ossicular joints reduce the coupling between multiple nonlinear mechanisms within the middle ear. This study provides new data to test and refine middle-ear nonlinear models.
Keywords: Middle-ear nonlinear response, Middle-ear nonlinear model, High intensity sound, Compressive nonlinearity, Expansive nonlinearity
1. INTRODUCTION
In the absence of a working middle-ear muscle reflex (Nuttall, 1974), the human middle ear is generally considered to act as a linear system as it conducts low to moderate sound energy in the ear canal to the cochlea (Goode et al., 1994; Gan et al., 2004). Compressive nonlinear growth (a growth in response that is less than the growth in the stimulus) of the middle-ear response has been observed with high intensity sounds > 130 dB SPL (Guinan and Peake, 1967). It has been suggested that this compression of the acoustic signal helps protect the inner ear from intense sounds (Price and Kalb, 1991; Price, 2007), but such behavior has not been well studied (Kobrak, 1948; Rubenstein et al., 1966). Some studies have used the onset of measurable middle-ear harmonic distortions to quantify the presence of middle-ear nonlinear responses (Aerts and Dirckx, 2010; Gladiné et al., 2017). However, the relationship between harmonic distortion and nonlinear growth can be complicated as documenting the presence of distortion depends greatly on the measurement noise floor, and such distortions may be apparent at levels well below the onset of nonlinear growth.
A recent study that directly quantified the nonlinear growth of stapes displacement in response to intense sound levels is that of Greene et al. (2017), but the results were limited to frequencies below 2560 Hz. Another study by the same group (Greene et al., 2018) quantified intracochlear pressure during acoustic shock wave exposure. The results from both studies suggest that a compressive nonlinearity in the middle ear leads to a slower growth of cochlear sound pressure at high stimulus levels than what is predicted by a linear transformation of the sound pressure gain measured at moderate sound levels (Nakajima et al., 2009). Due to limited frequency ranges of these earlier studies, it remains unclear how nonlinear vibrations of the middle-ear structures, including the tympanic membrane (TM) and middle-ear ossicles, are related to the compressive nonlinear growth of intracochlear sound pressures.
To protect the vulnerable cochlea from damage by loud sounds, it is critical that we elucidate the mechanisms by which the middle ear transmits high-level sounds to the cochlea. A few existing models of the auditory periphery predict the consequences of brief intense sound stimuli on hearing and hearing loss (Price and Kalb, 1991; Pascal et al., 1998; Zagadou et al., 2016; Rosowski et al., 2019), but none of them is adequately validated due to a lack of experimental characterization of the middle-ear nonlinear responses to intense sounds. In this study we systematically quantified the level-dependent growth of the umbo and stapes displacements of the human ear in response to pure tones with levels between 60 and 150 dB SPL over the 200 to 20000 Hz range. The data describe differences in the frequency and level dependence of nonlinear responses of the umbo and the stapes to loud sounds. Our results (1) provide data to test and improve nonlinear models that assess the likelihood of damage to the human ear from intense sound exposures, and (2) guide the development of new hearing protection strategies (Price and Kalb, 1991; Zagadou et al., 2016).
2. METHODS
2.1. Temporal Bone Preparation and Laser Measurements
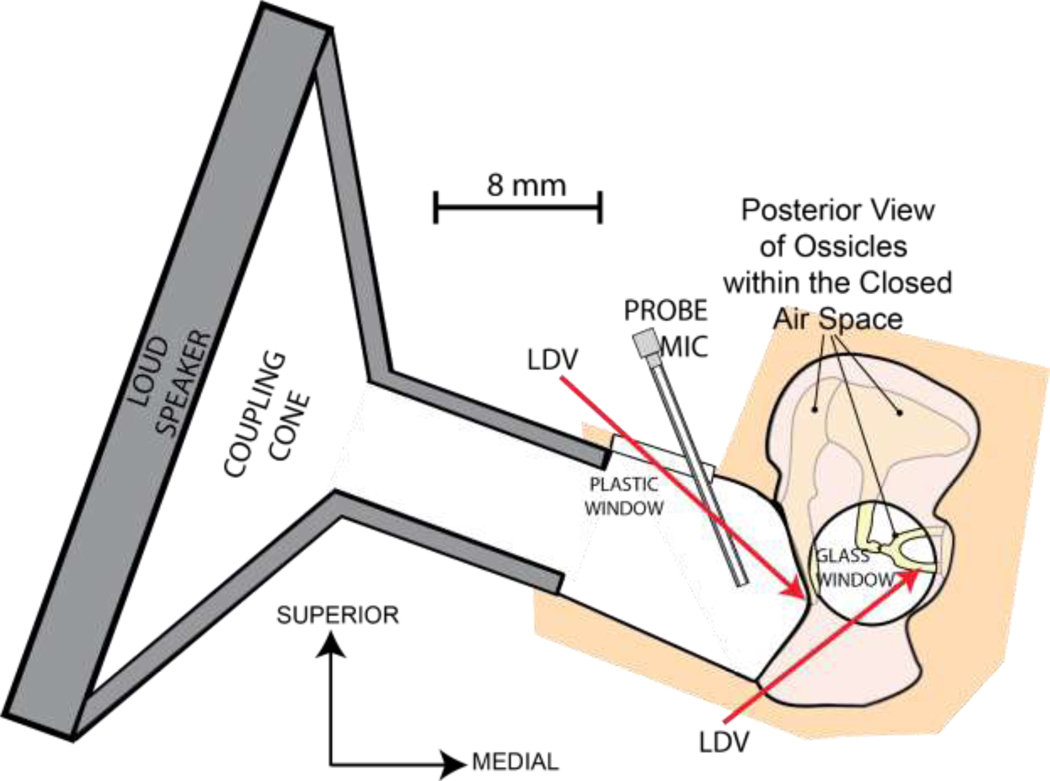
Four fresh human temporal bones (TB1~4: ages from 53 to 65 years old) without history of otologic diseases were used in this study. The preparation of the TB included opening of the facial recess to confirm normality of the middle-ear structures and gain access to the stapes for Laser Doppler Vibrometry (LDV) measurements. All measurements were made with the middle-ear air cavities re-closed by a cement-bound glass window over the opened facial recess that allowed us to focus the laser on the stapes (Voss et al., 2001). The bony external ear canal was shortened and part of the anterior-superior wall was replaced by a transparent plastic window to allow LDV measurement of umbo displacement (see Figure 1). Small pieces of retro-reflective tape (~100 μm × 100 μm × 60 μm in thickness) were attached to the lateral surface of the TM at the umbo and to the posterior crus of the stapes (Gan et al., 2004). The effect of tape mass on the vibration of the middle ear structures is negligible within the frequency range of our measurement. The TB was held tightly on an air-isolation table inside a sound proof booth. LDV measurements were performed at the umbo first, and then moved to the stapes without changing the TB setup. Vibration of the petrous bone near the oval window was also recorded to estimate the noise floor and stimulus artifact within the measured displacements; all of the umbo and stapes motion measurements we report are at least 20 dB above the driven vibration of the petrous bone.
Figure 1.
Experimental Setup. A loud speaker (Peavey Rx 22) with an inverted horn adapter is sealed to the ear canal opening to deliver sound. Part of the ear canal wall is replaced by a transparent plastic window which allows Laser Doppler Vibrometry (LDV) measurement of the umbo displacement. A probe microphone is inserted to the ear canal through a hole in the plastic window to monitor sound pressure (PEC) levels near the tympanic membrane (TM) surface. LDV measurement of the stapes displacement is performed through the glass-covered opening in the facial recess.
For sound stimulation, a loud speaker (Peavey Rx 22) with an inverted horn adapter was sealed to the ear canal opening (Figure 1) to deliver sound to the external ear. A calibrated probe microphone (PCB 377C10) monitored the sound pressures in the ear canal (PEC) within less than 2 mm of the TM surface (Figure 1). The hardware of the stimulus and recording system and its software control has been described previously (Ravicz and Rosowski, 2012). All measured voltages, displacements and sound pressures are reported as the root-mean-square magnitude of the stimulus-frequency component defined by Fourier transform of averaged (from 10 to 100 depending on stimulus level) time waveforms, which are essentially sinusoidal without large distortions even at the highest stimulus level (see Supplemental Materials C and D).
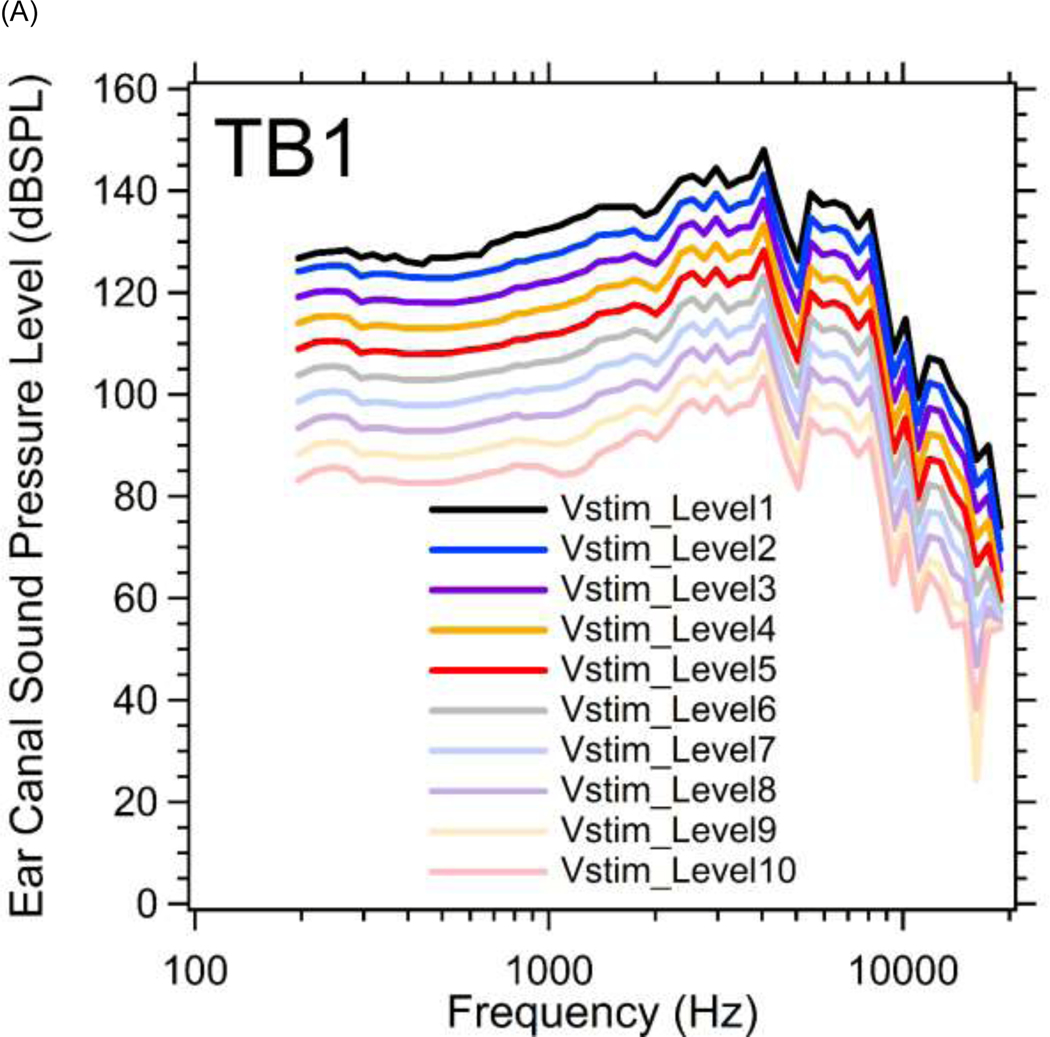
The basic stimulus was a sequence of 50 pure tones with frequencies logarithmically spaced between 200 and 20000 Hz. During each sequence the stimulus voltage to the loudspeaker was kept constant. The duration of each tone varied between 200 and 2000 ms (depending on the level of the stimulus). The tone sequence was repeated at 10 different stimulus levels while the LDV measured umbo motion, and the microphone measured the stimulus sound pressure. The entire stimulus series was repeated for stapes motion measurements. Stimulus Level 1 corresponded to the largest voltage that did not produce significant distortion (the amplitude of spectral harmonics was at least 20 dB below the spectral magnitude at the stimulus frequency, see Supplemental Material C for an example) in the ear canal sound pressure, while stimulus levels 2 through 10 decreased in steps of 5 dB. Depending on stimulus frequency, the lowest ear canal sound pressures (stimulus level 10) varied from 60 to 105 dB SPL, while the highest ear canal sound pressures (stimulus level 1) varied between 100 and 150 dB SPL (Figure 3).
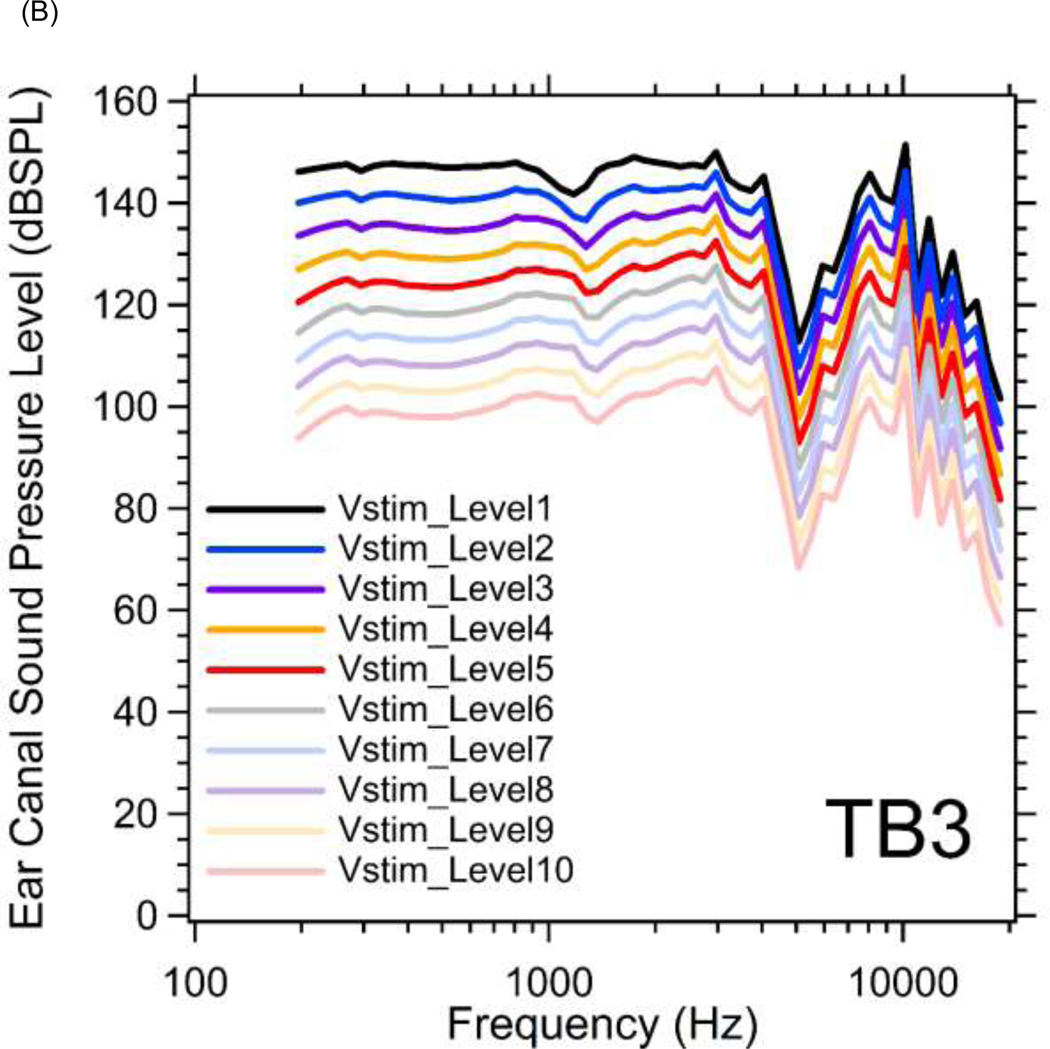
Figure 3.
(A) Magnitudes of ear canal sound pressure levels (PEC in dB SPL) monitored by probe microphone at 10 different stimulus voltage levels (Vstim_Level1~10) between 200 and 20000 Hz in TB1. The sound pressure level increases in 5 dB steps from Vstim_Level10 (lowest) to Vstim_Level1 (highest). (B) Magnitudes of ear canal sound pressure levels at 10 different stimulus levels in TB3.
Each measurement series started with the lowest stimulus level (level 10). After completing the ten stimulus level series at the umbo or the stapes, a tone sequence at one moderate stimulus level was repeated to determine if significant changes to the middle ear (such as damage to the middle-ear structures by high level sound, or drying) occurred during the measurement set. A microscopic examination was also repeated. No damage or significant changes in the results were seen throughout the experimental series.
2.2. Data Analysis
Fourier transforms of the recorded microphone and LDV time waveforms (which are essentially sinusoidal, see Supplemental Materials C and D) described the complex (magnitude and phase angle) sinusoidal sound pressure and velocity at the stimulus frequency. The velocities were converted into displacements by dividing the complex velocity by and then normalized by the complex sound pressure at the stimulus frequency (PEC). We report the magnitude and phase of these transfer functions as they vary with stimulus frequency and level.
We plot our results in four different manners: 1) The stimulus sound pressure magnitude produced by a series of fixed stimulus voltages plotted against frequency; for the most part, changes in stimulus voltage level produced equivalent changes in stimulus sound pressure level, as is consistent with linear growth. 2) The magnitude and phase of the motion transfer functions (displacement normalized by stimulus level) produced by a series of fixed stimulus voltages plotted against frequency; if the system is linear, the transfer functions will be independent of stimulus level. 3) Iso-frequency growth functions where we plot the magnitude of the pressure or displacement vs. varied stimulus levels at fixed frequencies; if the system is linear the pressure or displacement grows proportionally with stimulus level. 4) The Displacement Transfer Ratio (DTR) is computed as the ratio of the complex stapes and umbo displacements measured with the same stimulus level and frequency; if the system is linear these DTRs, when plotted against either frequency or stimulus level, are independent of stimulus level.
We also estimated the sound pressure levels and displacements where the growth of displacement with sound level began to deviate from linearity at each frequency. We used the growth functions that described the growth of umbo displacement (XU) and stapes displacement (XS) with ear canal pressure (PEC) at each frequency and in each ear (e.g. Figure 5) to determine the lowest stimulus levels (the threshold sound pressure of middle-ear nonlinear growth) where we observed nonlinear displacement growth (either compressive or expansive) as well as the displacement where this nonlinear growth began (the threshold displacement of middle-ear nonlinear growth).
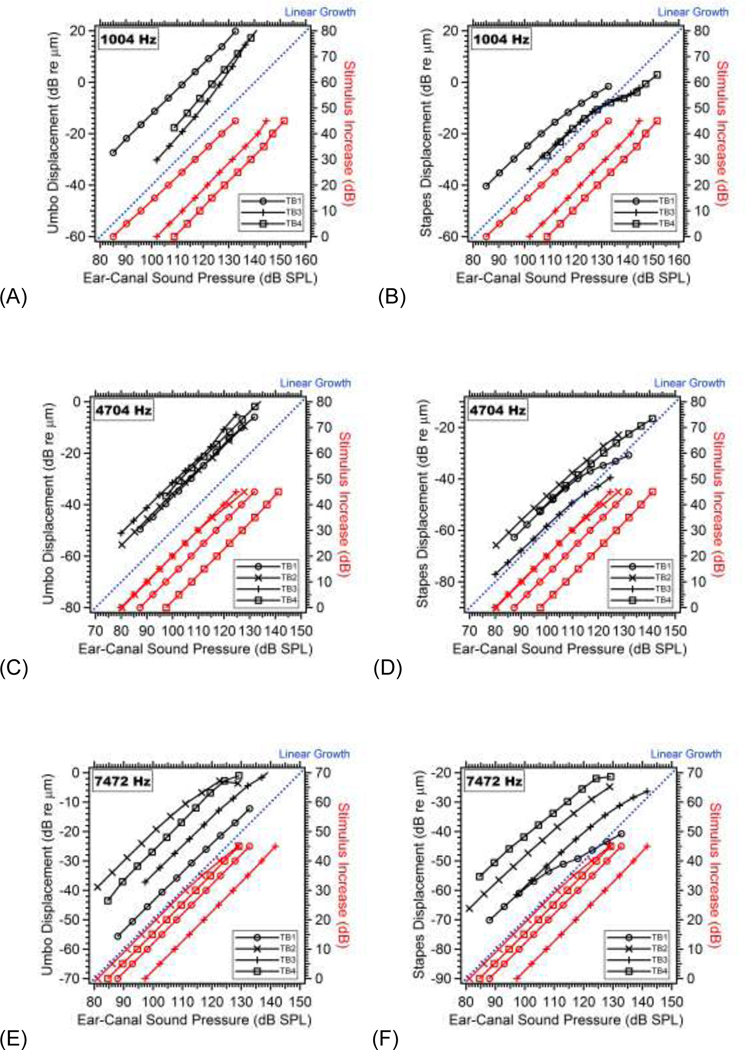
Figure 5.
The displacements (in Black - scaled on the left-hand Y-Axis) of the umbo (left columns: A, C and E) and the stapes (right columns: B, D, F) are plotted vs. the measured ear canal sound pressure (PEC) in dB SPL (on the X-Axis) for all 4 TBs, at three selected frequencies: 1004, 4704 and 7472 Hz respectively (from top to bottom. Note at 1004 Hz the results from TB2 are not shown due to transient laser signal distortions). In the same plots, we include the 5dB stepwise increase of the stimulus (in Red - scaled in dB on the right-hand Y-Axis) vs. the measured ear canal sound pressure (on the X-Axis). Within each plot, an example of linear growth is illustrated by the blue dotted line. The ear canal sound pressure grows linearly with the increase of the stimulus in general (red curves). However, the umbo and stapes displacements show either expansive or compressive nonlinear behaviors (black curves) after the ear canal sound pressure exceeds a threshold level.
For each iso-frequency growth function, we first computed the ratio of the measured displacements and sound pressures as a function of stimulus level: In a linear system these displacement to sound pressure ratios are independent of level. Starting with the lowest level and after ensuring the data were at least 20 dB above noise limits, the lowest sound and displacement levels where a plus or minus 2 dB deviation from linear behavior (a 2 dB deviation threshold produced more consistent threshold estimates than smaller deviations) defined the threshold sound pressure and threshold displacement for nonlinear growth. Changes of +2dB defined expansive growth thresholds; changes of −2dB defined compressive growth thresholds. These thresholds are compared across frequency among the 4 bones. The ratio of the threshold sound pressure and threshold displacement (acoustic stiffness) were also computed at each frequency, where any frequency dependence in this ratio will shed light on the frequency dependence of the nonlinear processes.
3. RESULTS
3.1. Umbo and Stapes Displacements under Moderate Level Sounds
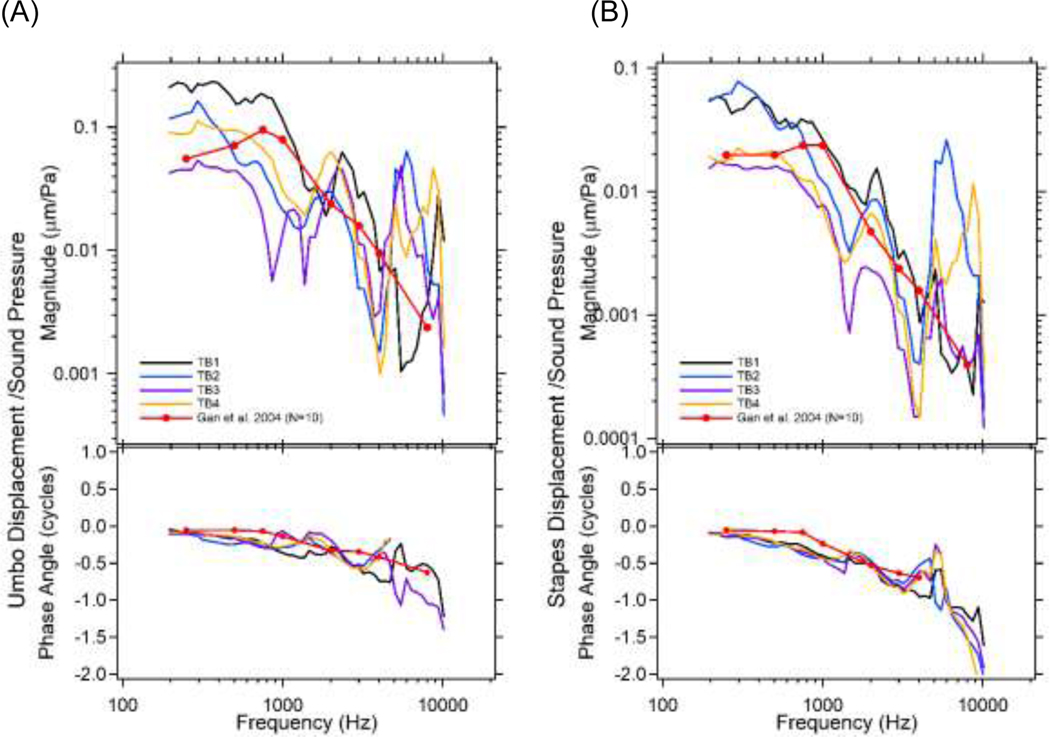
We first check the normality of the TB samples by measuring the umbo and stapes displacements normalized by PEC with moderate stimulus levels (~90 dB SPL). The normalized displacement magnitudes (μm/Pa) and phase angles (cycle) for the four TBs are plotted vs. frequency in Figure 2. The results are compared with the mean published displacements of human ears (N=10) reported by Gan et al., 2004.
Figure 2.
The (A) umbo; and (B) stapes displacements normalized by moderate ear canal sound pressure (PEC) versus frequency from all 4 TBs, compared with published data from Gan et al., 2004. Both magnitude (μm/Pa) and phase angle (cycles) are plotted.
While we see factor of 3 to 10 inter-individual variations in magnitude measured at any one frequency in our four bones, the results bracket the means of Gan et al., (2004) and are consistent with the large range (± 20 dB) in normal middle-ear responses found in the literature (Rosowski et al., 1990; Aibara et al., 2003; Gan et al. 2004; Nakajima et al., 2009). Both umbo and stapes displacement magnitudes are relatively flat at frequencies less than 800 Hz, and generally decrease as frequency increases to 10000 Hz, but with repeated sharp peaks and valleys. The relative phase of the displacement and sound pressure is near zero at frequencies below 800 Hz, and decreases as frequencies increase. Note the mean data of Gan et al. (2004) show a magnitude maximum at around 1 kHz and lack the peaks and valleys across the frequency range visible in our data, but these differences may be due to the averaging of their measurement results across multiple bones.
3.2. Sound Pressure at Moderate and High Stimulus Levels.
Figure 3 illustrates the complete set of frequency and level measurements of the PEC we generated in two temporal bones (TBs1&3). Figure 3A plots the measured PEC magnitude level (PEC phase was not affected by changing the stimulus level) in dB SPL as a function of frequency at 10 different stimulus voltage levels (Vstim_Level) in TB1. The PEC amplitude level increases in 5 dB steps from Vstim_Level10 (lowest) to Vstim_Level1 (highest), with a maximum sound pressure of 90 to 150 dB SPL depending on frequency. With constant stimulus voltage level, the sound pressure magnitude increases slowly from 200 to 4000 Hz, with a notch near 5000 Hz, likely due to a pressure node along the remaining ear canal which is about 2 cm long. At higher frequencies, the sound pressures roll-off, such that at 20 kHz the PEC amplitude is 60 dB below the maximum value obtained near 4 kHz. These data are generally consistent with the linear growth of sound pressure with stimulus level, though the growth is slower at the lowest frequencies and highest stimulus levels (see specifically the less than 5 dB change produced by the step from Vstim_level2 to Vstim_level1 at frequencies less than 600 Hz). It was the onset of such nonlinear growth that defined the highest stimulus voltage level used in this study. Similar results from TB3 are shown in Figure 3B (See Supplemental Material A for additional results from TB2 and TB4).
3.3. Displacement of the Umbo and the Stapes at Moderate and High Stimulus Levels
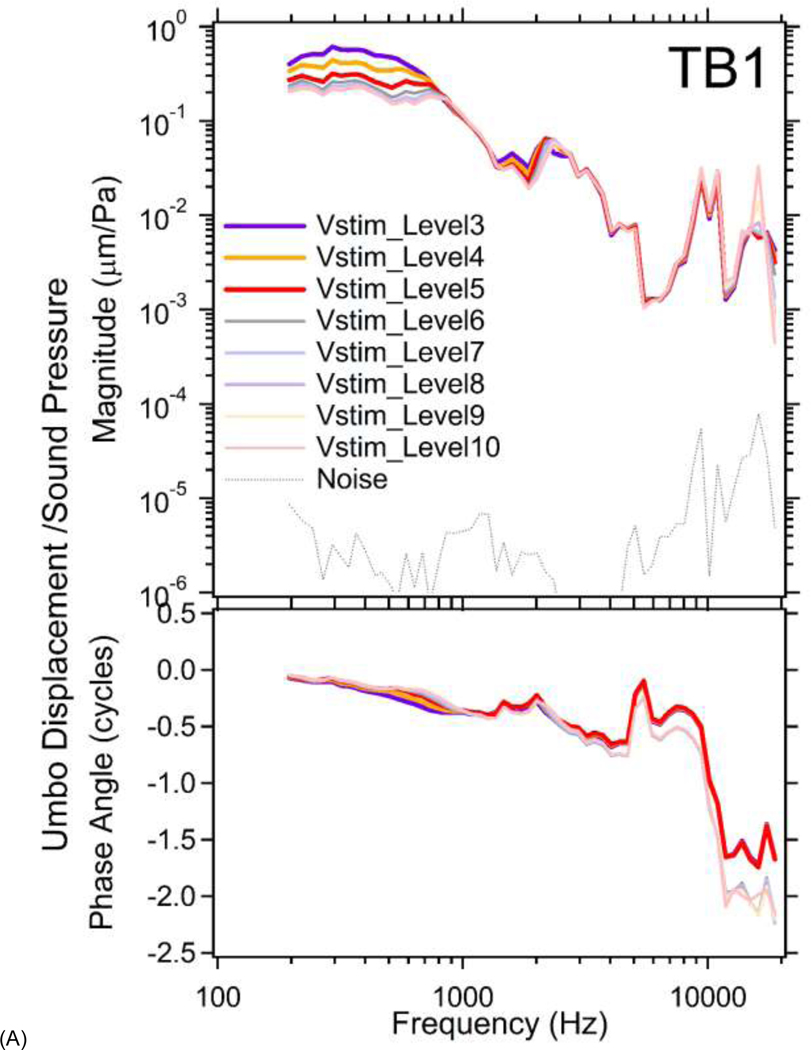
Figure 4A plots the stimulus normalized umbo displacements at multiple stimulus voltage levels in TB1. Due to the onset of significant distortion in the umbo displacement waveforms (Harmonic levels less than 20 dB below the stimulus frequency component and visible distortion in the velocity waveform) at Vstim_Level1&2, results from TB1 at these two highest stimulus levels are not plotted. Because of the stimulus normalization a linear system would produce displacement-pressure ratios that varied with frequency but not with level. The variation in the ratio at the highest levels (Vstim_Level3~5) at the frequencies less than 800 Hz and between 1200 and 2500 Hz indicates nonlinear growth of the response with increased stimulus levels. At lower stimulus levels in these frequency ranges, and at all frequencies with Vstim_Levels between 6&10, the stimulus normalized umbo displacements at each frequency almost sit on top of each other as is consistent with linearity. The phases of the normalized displacements largely show little variation between lower and higher stimulus levels, except at the frequencies > 5 kHz where there is a nearly half cycle phase difference in the responses to the three highest and the lower stimulus levels. This phase difference may result from the high-level onset of complex 3D “rocking” motions of the ossicles (e.g. rotational or side-to-side motion; von Bekesy 1960 Page 113; Decraemer and Khanna, 1994) that complicate the motion component that we observe with our 1D laser.
Figure 4.
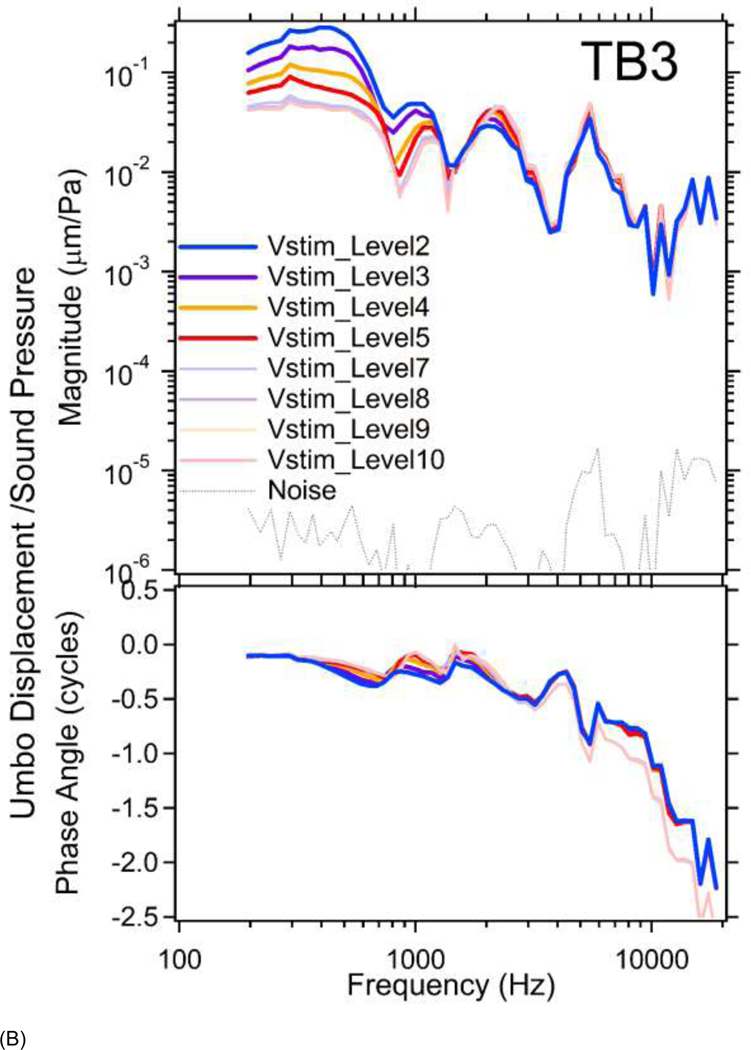
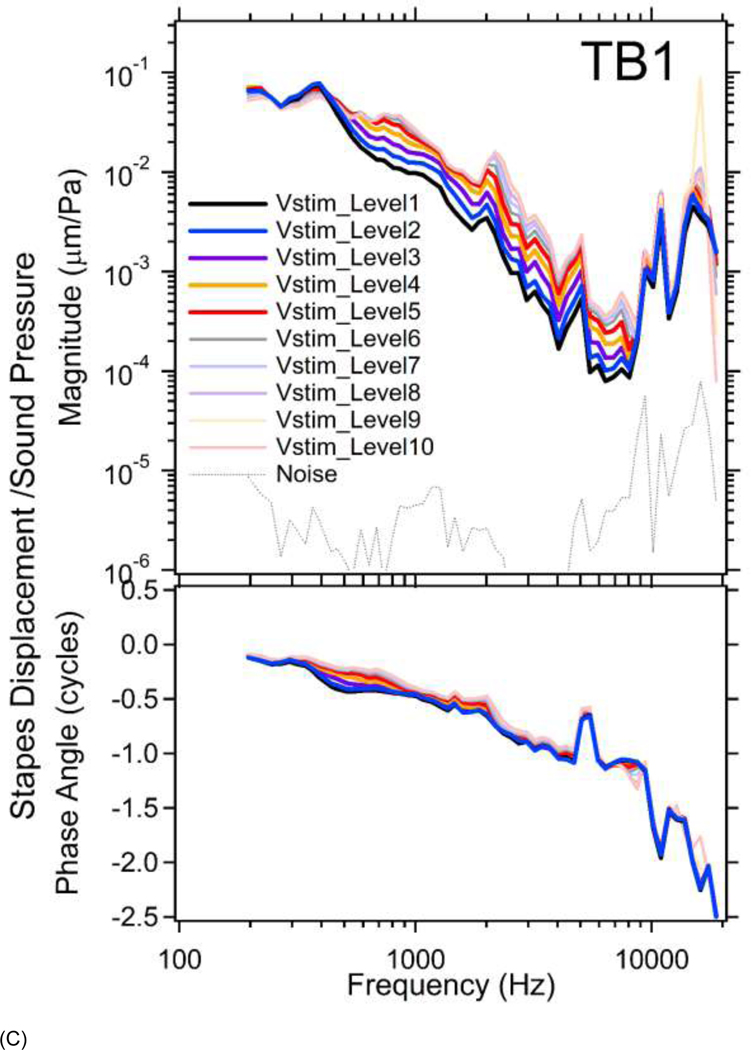
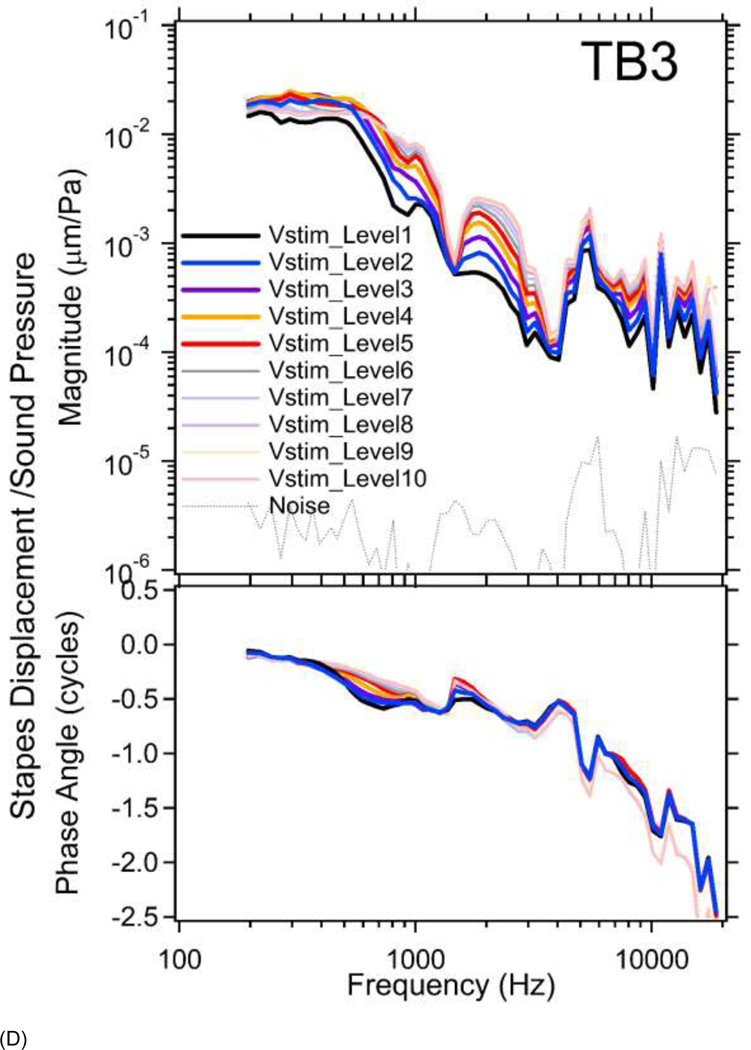
(A) The umbo displacements normalized by multiple stimulus sound pressure levels (Vstim_levels) in TB1. Due to LDV laser signal distortions, results from two highest stimulus levels (Vstim_Level1&2) are not plotted. The top panel shows magnitude and the bottom panel shows phase. The gray dotted line shows average vibration of petrous bone as an estimate of noise floor. Expansive nonlinear behaviors of the umbo at three stimulus levels (Vstim_Level3~5) at the frequencies less than 800 Hz and between 1200 and 2500 Hz are clearly seen in the magnitude plot. (B) The stimulus normalized umbo displacement magnitudes (top panel) and phase angles (bottom panel) in TB3. Results from Vstim_Level1&6 are not plotted due to transient distortions in the laser signal. Clear expansive nonlinear responses of the umbo in the magnitude plot at frequencies below 4 kHz with Vstim_Level2 through 5 are seen. The stapes displacements normalized by all 10 stimulus sound pressure levels in (C) TB1 and (D) TB3. The top panel shows magnitude and the bottom panel shows phase. Compressive nonlinear responses of the stapes to sound are clearly seen in the magnitude plot at Vstim_Levels between 1 and 8 across a broad frequency range in both TBs. The normalized stapes displacement phases also show some level dependence in a few narrow frequency bands, such as between 400 and 900 Hz in both TBs.
Similar results from TB3 are shown in Figure 4B. (Results from Vstim_Level1&6 are not plotted due to transient distortions of laser signals at high intensity sounds or loss of laser signal during the measurement due to small changes in the relative position of the laser and specimen). One can see clear nonlinear umbo responses in magnitude at frequencies below 4 kHz with Vstim_Level2 through 5. The normalized displacement phases vary less with stimulus level, even at the low frequencies where the magnitude nonlinearity is obvious. However, a near half-cycle phase difference is observed at the four highest stimulus levels at frequencies above 7 kHz similar to that observed in TB1.
In both TB1&3, the normalized umbo displacements produced by higher stimulus levels (thicker darker lines) in the lower-frequency range, are larger than the normalized umbo displacements at lower stimulus levels (thinner lighter lines), indicating an expansive nonlinearity, which contrasts with the compressive stapes nonlinearity described below.
Figures 4C&4D plot the normalized stapes displacements at multiple stimulus voltage levels in TBs 1&3. No distortion of the LDV signal was observed with the smaller stapes displacements, and the level of harmonics in the velocity waveforms was more than 20 dB below the stimulus component, thus results from all 10 stimulus levels are shown. Level dependences in the responses of the stapes to sound are clear at Vstim_Levels between 1 and 8 at frequencies from 200 to 20000 Hz in both TBs. At Vstim_Level9 and 10, the stapes displacement appears linear: the thin light orange line at Vstim_Level9 and thin light red line at Vstim_Level10 are almost on top of each other. In contrast to the expansive growth of umbo displacements with level, the normalized stapes displacements at higher stimulus levels (thicker darker lines) are smaller than those at lower stimulus levels (thinner lighter lines), consistent with a compressive nonlinearity. (see Supplemental Material B for additional results from TB2 and TB4) Insert Figure 4 about here
Normalized stapes displacement phases show more level dependence than those of the umbo, and the dependence is most prominent in a few narrow frequency bands, such as between 400 and 900 Hz in both TBs. A level dependent half-cycle phase difference is observed in TB3 at the highest levels and frequencies, but not in TB1, it is possible that the 3D rocking of the umbo hypothesized above is not equally transferred to the stapes in the two temporal bones, or that difference in the placement of the reflector on the posterior stapes crus, or motion of the crus, produced differences in the sensitivity of the laser to motions in directions different from that of our laser observations.
3.4. Growth Functions of Umbo and Stapes Displacements with Stimulus Levels
To help identify the sound levels and displacements above which the umbo and stapes responses grow nonlinearly, we plot, in Figure 5, the displacement (in Black - scaled on the left-hand Y-Axis) of the umbo (left columns) and the stapes (right columns) vs the measured PEC in dB SPL (on the X-Axis) for TBs 1~4. In the same plots, we include the 5dB stepwise increase of the stimulus voltages vs. the measured PEC (in Red - scaled in dB on the right-hand Y-Axis). Within each plot, an example of linear growth, i.e. growth proportional to the PEC, is illustrated by the blue line. We show the results at a low, middle and high frequency: 1004, 4704 and 7472 Hz respectively. More quantitative and detailed analyses to determine the thresholds of nonlinear growth for all four bones at all measured 50 frequencies will be given later in Figures 7&8.
Figure 7.
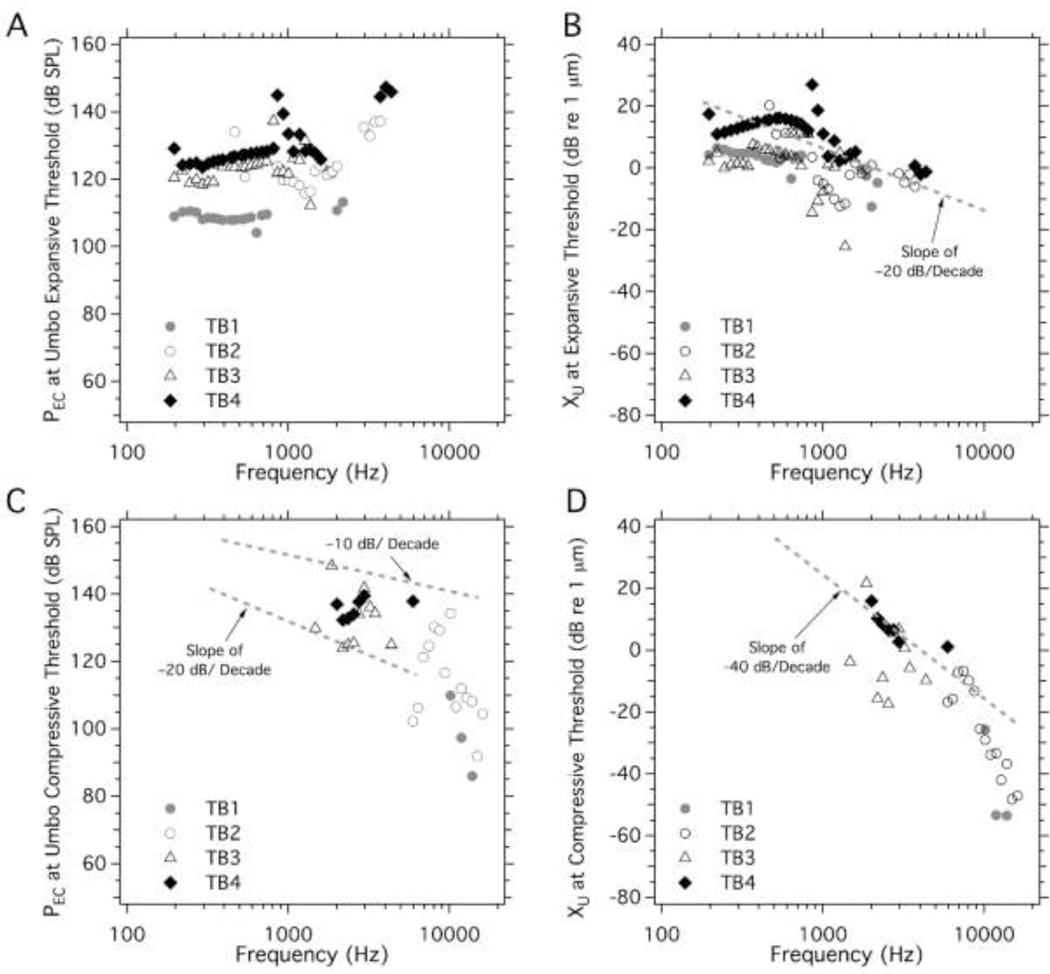
The threshold (or lowest) of the ear canal sound pressure (PEC) levels (A and C) at which either (B) expansive, or (D) compressive growth of the umbo displacement (XU) was first observed in all 4 TBs versus frequency. The gray dashed lines in the three panels describe slopes of either threshold pressure or threshold displacement that fall with frequency.
Figure 8.
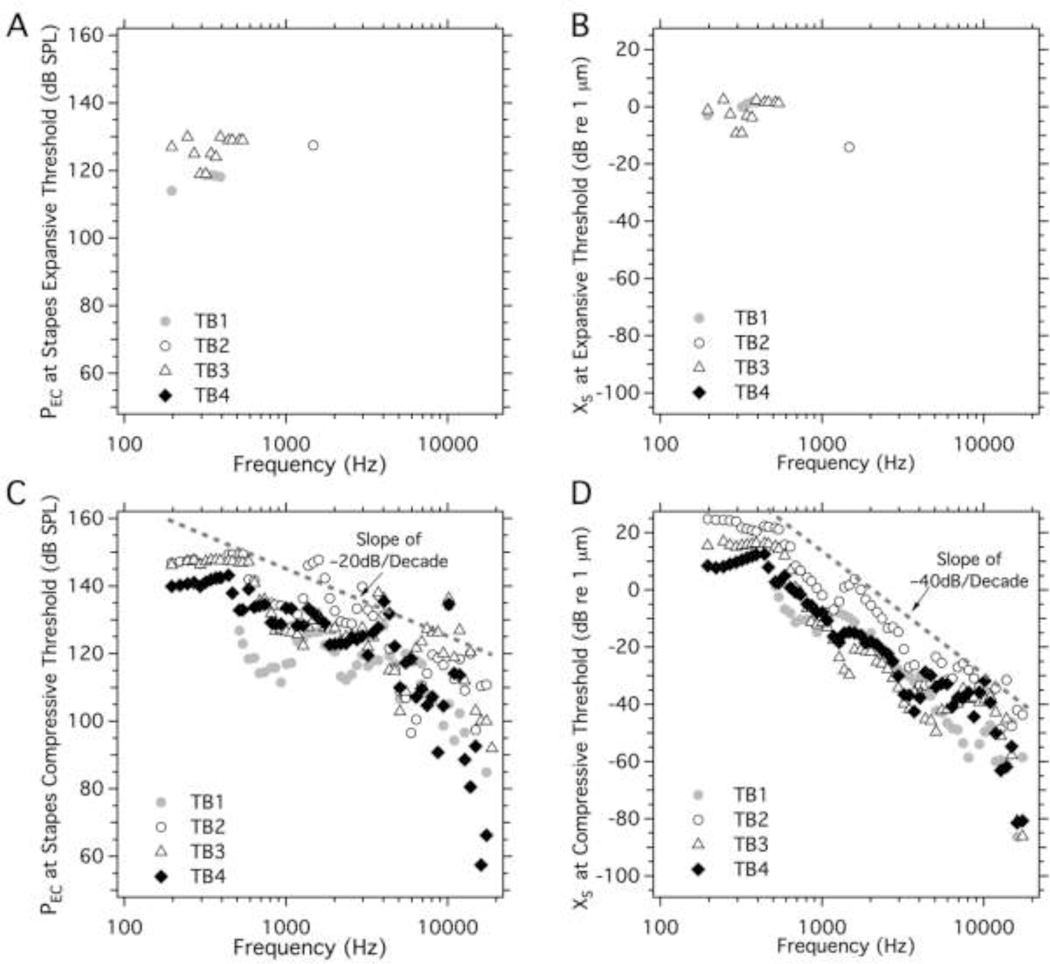
The threshold (or lowest) of the ear canal sound pressure (PEC) levels (A and C) at which either (B) expansive, or (D) compressive growth of the stapes displacement (XS) was first observed in all 4 TBs versus frequency. Only few expansive nonlinear growth is observed in the stapes, while compressive nonlinear growth in either threshold pressure or threshold displacement show many similarities among all 4 TBs. The gray dashed lines suggest that the compressive threshold pressure and displacement fall with frequency at slopes of −20 dB/decade and −40 dB/decade respectively.
The relationship between stimulus voltage level and PEC (in red) generally parallels the blue line, consistent with linear growth of the generated sound pressure at all frequencies. At 1004 Hz, the umbo displacement (Figure 5A) in the three bones grows faster than PEC (expansive growth) starting around 115 dB SPL and umbo displacements near 0 dB re 1 μm (1 μm); while the stapes displacements (Figure 5B) start to compress (grow slower than PEC) at PEC between 110 to 120 dB SPL and stapes displacements near −10 dB re 1 μm (0.3 μm). At 4704 Hz, the umbo displacement (Figure 5C) grows nearly proportionally with PEC, while the stapes displacement growth (Figure 5D) is compressive starting around 110 dB SPL and stapes motions of about 30 dB re 1 μm (0.03 μm). At 7472 Hz, the growth of both the umbo (Figure 5E) and the stapes displacements (Figure 5F) is compressive at PEC levels above 105 to 120 dB SPL, and umbo displacements near −6 dB re 1 μm (0.5 μm) and stapes displacements between −25 and −60 dB re 1 μm (0.02 to 0.001 μm). It is also noted individual differences become larger at high frequencies due to motions of the umbo and the stapes become more spatially complex.
3.5. Middle-Ear Displacement Transfer Ratios at Moderate and High Stimulus Levels
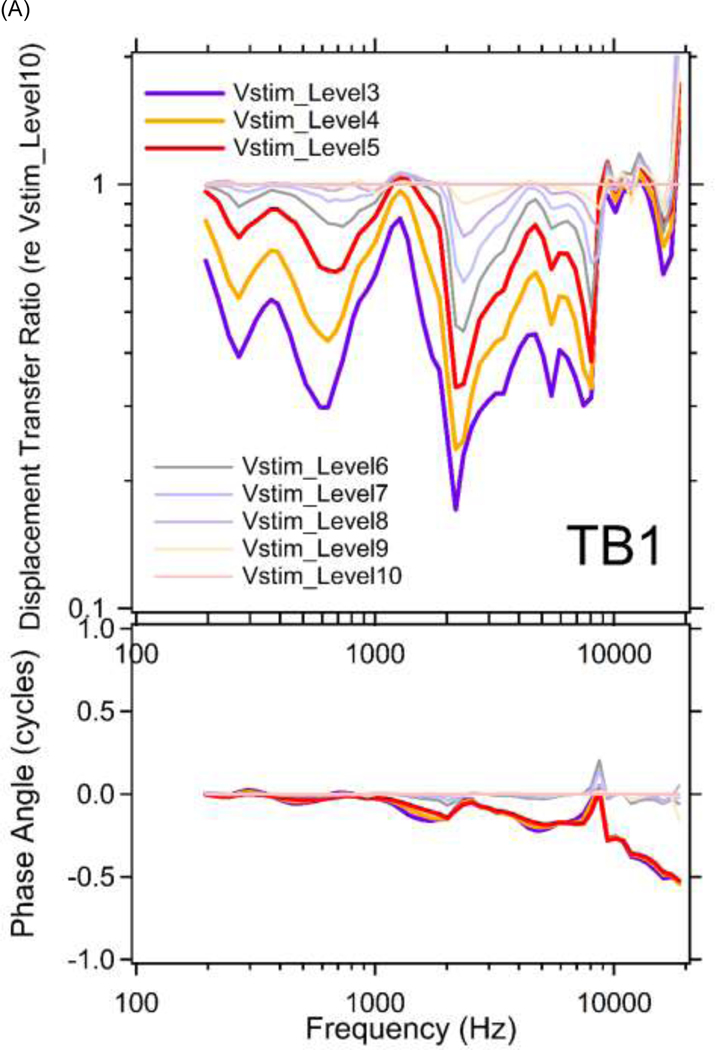
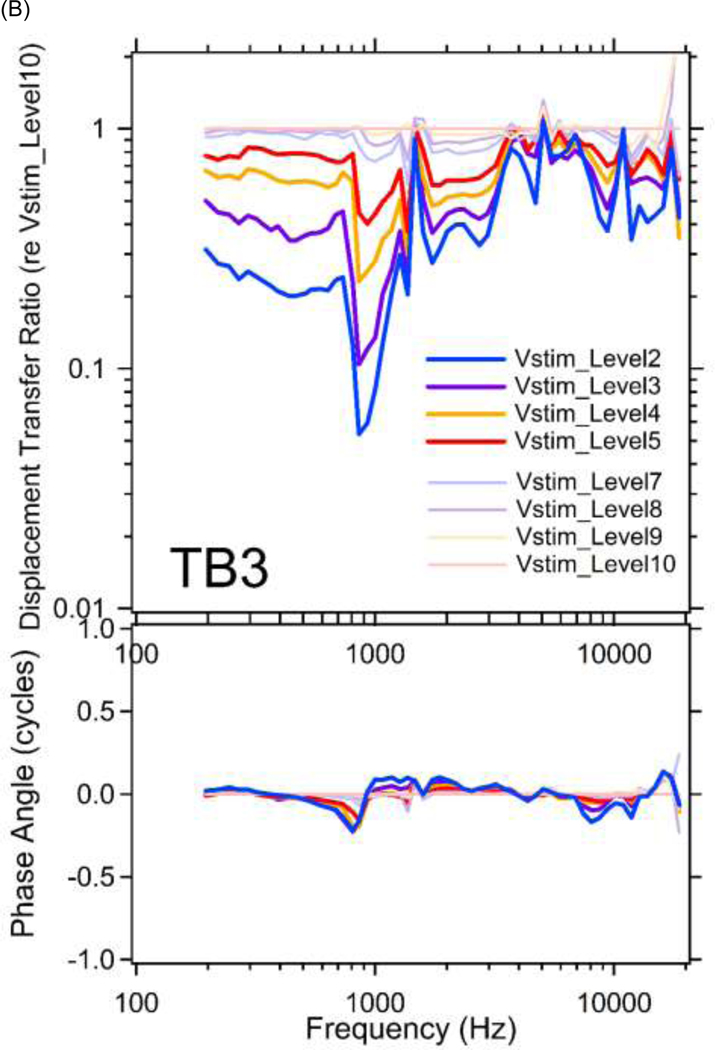
Figure 6 shows middle-ear displacement transfer ratios (stapes displacement / umbo displacement) plotted vs. frequency at multiple sound levels for TBs 1&3. The results are further normalized by the ratio at the lowest stimulus level (Vstim_Level10) to remove the frequency dependency in the displacement transfer ratio. The normalized displacement transfer ratios contain a combination of the level dependences apparent in Figure 4, and the primary outcome is compressive growth of the ratio over a wide frequency range. This compression results from the compressive growth seen in the stapes motion data (Figures 4C&4D) that is present in the numerator of the ratio at frequencies above 800 Hz and the expansive growth of the umbo motion (Figures 4A&4B) that is present in the denominator primarily at frequencies below 800 Hz.
Figure 6.
Middle-ear displacement transfer ratios (stapes displacement / umbo displacement) are plotted versus frequencies at multiple stimulus levels for (A) TB1; and (B) TB3, in both magnitude (top panel) and phase angle (bottom panel). The results are further normalized by the ratio at the lowest stimulus level (Vstim_Level10) to remove the frequency dependency in the displacement transfer ratio. Note the results from Vstim_Level1&2 in TB1 and Vstim_Level1&6 in TB3 are not included due to transient laser signal distortions.
The resulting compressive broadband middle-ear displacement transfer ratio (Figure 6) describes a significant reduction in the motion of the stapes relative to the umbo at higher stimulus levels, where this reduction is apparent with Vstim_Levels 1 through 9, which correspond to sound pressures of 90 dB SPL and higher (Figure 3).
3.6. Stimulus Levels and Displacements at the Thresholds for Nonlinear Umbo Displacement Growth
Figure 7 illustrates the threshold (or lowest) PEC stimulus levels and the corresponding umbo displacement level, above which either expansive (Figures 7A&7B) or compressive (Figures 7C&7D) growth in XU occurred as a function of frequency in each of the four ears. Each type of growth was not apparent at every frequency. Expansive growth in XU was most apparent at frequencies less than 2000 Hz with stimulus threshold levels that varied from 110 to 150 dB SPL and displacements at threshold between −20 and +30 dB re 1 μm (0.1 to 32 μm) in that frequency range. Expansive growth was far less common above 2000 Hz, but the data suggest similar sound pressure thresholds for expansion out to 5000 Hz. The displacements at threshold between 1000 and 5000 Hz tend to fall off with a slope of about −20 dB / decade, as might be expected from displacements measured with constant sound pressure (e.g. Figure 2A).
Compressive growth of XU was only observed at frequencies between 1000 and 20000 Hz (Figures 7C&7D). Due to sparse and somewhat wide spread data points in Figure 7C, we fit them with two slopes to show the range of variation rate with frequency. Between 1000 and 10000 Hz the sound pressure thresholds for compression fell somewhere between −10 and −20 dB / decade (Figure 7C). Over the same frequency range, the displacement at the compressive threshold fell at close to −40 dB / decade (Figure 7D). At frequencies above 10000 Hz, thresholds of the stimulus sound pressure and the displacement when the umbo first showed compressive nonlinearity were only identified in TBs 1&2, and they both fell precipitously with frequency.
3.7. Stimulus Levels and Displacements at the Thresholds for Nonlinear Stapes Displacement Growth
Figure 8 illustrates the stimulus sound and displacement levels where nonlinear growth in XS first occurred. In general, there was little expansive growth in XS, and what was observed was restricted to frequencies below 2000 Hz, where we saw sound pressure thresholds of 110–130 dB SPL, and displacement levels between −15 and +5 dB re 1 μm (0.2 to 2 μm). These sound pressure thresholds for expansive XS growth are similar to those observed at the umbo and are consistent with the stapes growth being affected by the umbo nonlinearity. Although the expansive growth is observed much less often for the stapes than for the umbo.
In contrast to the limited range of expansive growth of the stapes, compressive growth was observed over the entire measured frequency range in TB3 and TB4, and at frequencies above 500 Hz in the other two ears (Figures 8C&8D). (The difference at low frequencies may reflect preparation dependent limitations in stimulus level at low frequencies: e.g., a comparison of Figures 8A&8C, demonstrate that in TB1 the highest stimulus level at frequencies < 500 Hz was < 130 dB SPL, while 150 dB SPL was achieved in TB4 at frequencies < 500 Hz.)
The stimulus levels at the threshold for compressive XS nonlinear growth were between 110 and 150 dB SPL at frequencies less than 4 kHz, but were as small as 60 to 80 dB SPL near 18000 Hz. The stapes displacement levels where nonlinear growth was first observed (Figure 8D) varied between 10 and 30 dB re 1 μm (0.315 and 31.5 μm) at frequencies below 500 Hz, and generally fell with increasing frequency to as low as −50 dB re 1 μm (3.15 nm) at 10000 Hz and were even smaller at higher frequencies. Above 500 Hz, the sound level at the threshold for compressive growth of stapes displacement (Figure 8C) generally fell with frequency with a slope near –20dB per decade, while the displacement at the compressive threshold generally fell with a slope of −40dB per decade. Just as there were similarities in the sound pressure threshold for expansive umbo and stapes growth at low frequencies, the sound pressure thresholds for stapes and umbo compressive growth when seen in the same preparation are similar at frequencies above 2000 Hz. Given the large preponderance of observations of stapes compressive behavior, this may indicate that, on occasion, a compressive nonlinearity that affects XS growth also affects XU growth.
4. DISCUSSION
4.1. Frequency Dependent Middle-Ear Nonlinearity: Compression vs. Expansion
In this study we quantified the umbo and stapes displacements produced by tones of moderate to high level ear canal sound pressures (between ~60 and ~150 dB SPL) across a broad frequency range (from 200 to 20000 Hz). Our results show clear nonlinear growth in the displacement of the umbo and the stapes when the ear canal sound levels reach some threshold (Figures 3, 4, 5 & 6). The nonlinear response is either compressive or expansive depending on frequency and location (Figures 3&4). The umbo exhibited both compressive and expansive growth in different frequency and stimulus level ranges as described above. The expansive XU nonlinear behavior was primarily observed at frequencies below 2000 Hz at sound levels of 110 to 150 dB SPL, which produced umbo displacements between 0 and 30 dB re 1 μm (1 to 32 μm, see Figures 7A&7B). Compressive growth in XU was observed at higher frequencies. In the 2000 to 20000 Hz range the compressive threshold stimulus and XU levels fell with frequency and were near 130 dB SPL and −10 dB re 1 μm (0.32 μm) at 10000 Hz.
Little expansive nonlinear growth was observed in XS (Figures 8A&8B). However, significant compressive growth was observed across the entire measured frequency range in TB2, 3 and 4, and at frequencies above 400 Hz in TB1 (Figures 8C&8D). The sound pressure and XS levels at thresholds of nonlinearity varied with frequency: starting near 140 dB SPL and 15 dB re 1 μm (5.6 μm) at 200 Hz, falling to sound levels between 90 and 120 dB SPL and displacement levels near −50 dB re 1 mm (3 nm) at 10000Hz. The frequency dependence of the threshold of nonlinearity for Xu and Xs showed some similarities (Figures 7&8). The differences and similarities in the nonlinear behavior of the umbo and the stapes suggest that multiple factors contribute to middle-ear nonlinear response to sound; a possible explanation is the presence of an expansive nonlinearity that primarily affects the growth of Xu and a compressive nonlinearity that primarily affects Xs. The potential list of the sites of these nonlinear processes include: the TM itself, the joints that connect and support the three ossicles, as well as the annular ligament around the stapes that constrains the stapes motion produced by sound (Guinan and Peake, 1967; Pang and Peake, 1986; Price and Kalb, 1991).
4.2. Comparisons to Other Observations and Conjectures of Nonlinear Growth of Ossicular Displacements
As noted in the discussion, before a few years ago, the most direct evidence for compressive nonlinear growth of stapes displacement with increasing stimulus levels were the measurements made in cat by Guinan and Peake (1967), though these measurements were only made at a few mid to low frequencies and with stimulus levels limited to less than 140 dB SPL. Price (1974), in constructing an early version of his Auditory Hazard Assessment Algorithm for Humans (AHAAH) model of the middle-ear responses to high-level stimuli, used the Guinan and Peake measurements to suggest that the stapes of human middle ear has a displacement limit of about 30μm peak-to-peak (equivalent to ~20 dB re 1 μm rms) and a threshold of nonlinearity of 10 μm peak-to-peak (~11 dB re 1 μm rms). He also used the Guinan and Peake data to suggest that this compressive growth began with stimulus levels of 110 to 120 dB in the mid frequencies. Aerts and Dirckx (2010) developed a new measurement method to quickly determine nonlinear distortions of acoustically driven gerbil eardrum vibrations for sound pressures ranging from 90 to 120 dB SPL at frequencies from 125 to 16000 Hz. Their study suggested that small nonlinear distortions of gerbil eardrum vibrations can be detected by their sensitive measurement technique at a sound pressure as low as 96 dB SPL, far below the generally considered 120 dB SPL threshold for nonlinear response of the middle ear. Their conclusion is consistent with our observations of the onset of nonlinearity at a much lower sound pressure thresholds in our analyses (Figures 7&8). Huang et al. (2012) observed subharmonics in both ear canal pressure and intracochlear pressure in their gerbil study when high sound pressure level stimuli were used, and they suggested these subharmonics may emerge when the fundamental became compressively nonlinear, which may impact the quantified middle ear nonlinearity. However, we didn’t observe any subharmonics in spectra of our measurement results (See Supplemental Materials C and D), perhaps due to the stimulus levels we used are not sufficient to elicit subharmonics in our specimens. Greene et al. (2017) directly quantified stapes displacement and intracochlear pressure in human temporal bones in response to tonal stimulus levels between 100 and 170 dB SPL, but with frequencies limited between 20 to 2560 Hz, and with stimulus level ranges at each frequency of ~30 dB. Their results suggest a compressive limit to XS of ~150 μm peak-to-peak (~35 dB re 1 μm rms) that is reached with stimulus sound pressures of ~140 dB SPL at frequencies less than 600 Hz. Greene et al. (2017) also observed nonlinear growth of XS at sound pressures as low as 120 dB SPL.
The Guinan and Peake (1967) cat measurements, Aerts and Dirckx (2010) gerbil measurements and the Greene et al. (2017) human temporal bone measurements are either restricted in the range of levels and frequencies they used to describe nonlinear growth of stapes motion, or they looked for nonlinear behavior at only one middle-ear location (the stapes). While our temporal bone study does not employ tonal sound levels as high as those used by Greene et al. (2017), we do show measurements over a 50 dB level range at each frequency as well as across a wider frequency range from 200 to 20000 Hz. At stimulus frequencies below 2000 Hz, which overlaps that of the Greene et al. (2017) study, our stapes displacement results are more limited but similar: We did not in general produce the sound pressure levels needed for saturation of the XS with stimulus level, but we did see compressive behavior similar to that reported by Greene et al. (2017) at levels below saturation.
However, our extended measurements show nonlinear behaviors of human middle ear that are not described by previous studies.
We describe nonlinear growth in the displacement of the umbo which has not been well documented previously. This nonlinear growth takes two forms: Expansive growth of XU which starts with sound levels between 100 and 140 dB SPL at frequencies below 2000 Hz, and compressive growth that occurs at frequencies between 2000 and 20000 Hz.
The measurements we made of stapes and umbo motion at frequencies above 2000 Hz reveal a frequency dependence of the threshold for nonlinearity that has not been reported previously. The threshold sound pressures and the displacement levels that occur at threshold fall with stimulus frequency with slopes approximating −20 to −40 dB per decade (Figures. 7C, 7D, 8C&8D). This leads to thresholds of nonlinearity of stapes compression of about 110 dB SPL and near −50 dB re 1 μm (3 nm) at 10000 Hz. That nonlinear motion of the ossicles could occur at such low sound and displacement levels has not been previously appreciated.
4.3. Frequency Dependent Nonlinearity Thresholds of Stapes Displacement and Sound Pressure Level: Insight for Middle-Ear Nonlinear Modeling
The sound and displacement levels at the threshold for nonlinear growth of umbo and stapes displacements were similar in level and frequency dependence across the four ears (Figures 7&8). As noted above these observations of frequency-dependent thresholds for nonlinear growth of middle-ear displacement are unique and shed new light on the nonlinear mechanisms that produce such behavior. Early attempts to describe and predict the nonlinear growth of the stapes displacement with sound pressure hypothesized that the annular ligament of the stapes acted as a nonlinear spring which increased in stiffness as it was displaced (Pang and Peake, 1986). Price and Kalb (1991) used such a model to predict a maximum stapes displacement that was allowed by such a spring. Later models of middle-ear nonlinearity also included a nonlinear resistance in the annular ligament that was needed to fit observations of noise induced hearing loss produced by impulsive sounds (Zagadou et al., 2016). However, as noted above, there was little direct observation of nonlinear stapes growth to support such behavior.
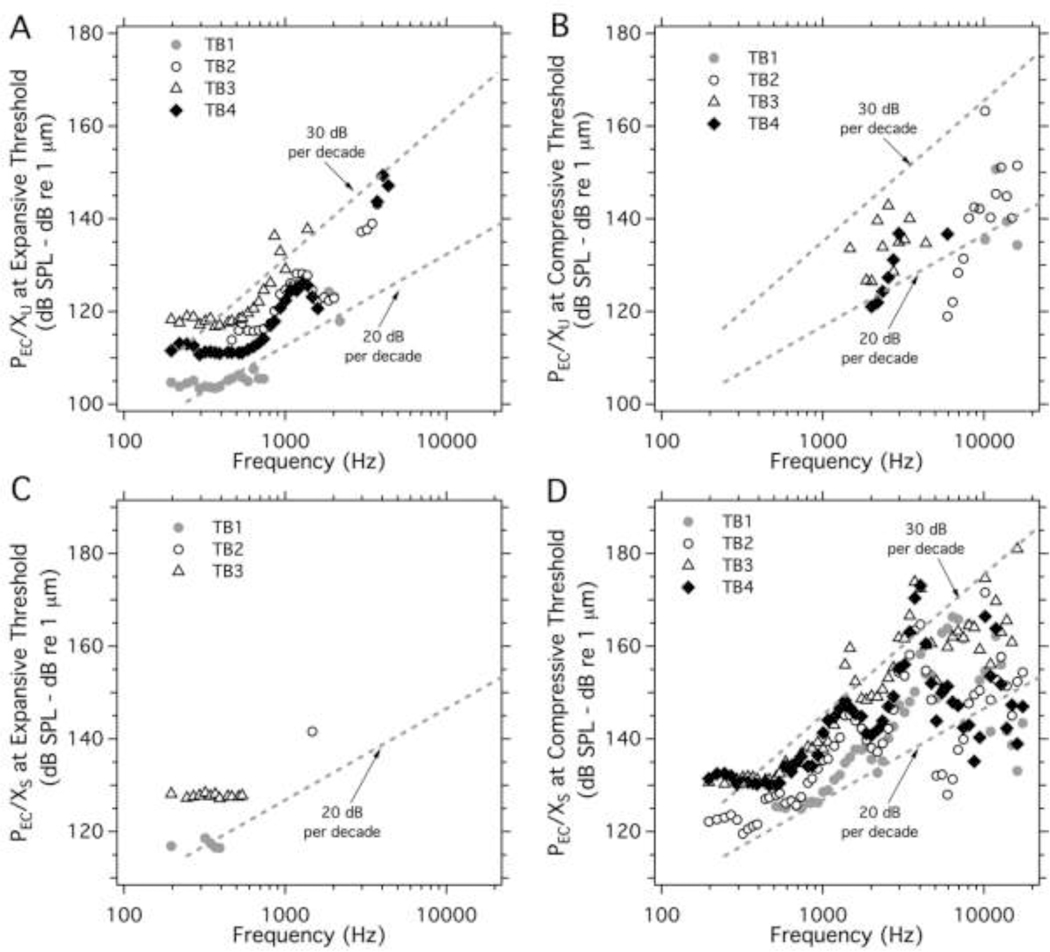
Our linked observations of the stimulus sound pressure and umbo and stapes displacements at the onset of nonlinear growth allow us to quantify a specific acoustic stiffness value (a ratio of a sound pressure and displacement) at the threshold of nonlinearity (Figure 9), and then make inferences concerning the associated nonlinear mechanisms. The simplest inference we make is that a nonlinear stiffness that controls both the transfer of sound through the middle ear and the displacement of the ossicles would produce a ratio of stimulus sound pressure and ossicular displacement that is independent of frequency. In Figure 9, the stiffness values computed from the onsets of expansive growth of umbo displacements (Figure 9A) and the expansive and compressive growth of stapes displacements (Figures 9C&9D) are approximately independent of frequency at frequencies less than 700 Hz. At higher frequencies, the ratio of sound pressure levels and ossicular displacements at the threshold of nonlinearity generally shows a complex frequency dependence (with local peaks and valleys in the ratio), but generally increases as frequency increases. The trend, however, is for the computed stiffness value to increase at rates of 20 to 30 dB per decade. This trend is more consistent with a nonlinear resistance acting to control the sound transfer and the ossicular displacements, but the local peaks and valleys suggest that a complex interaction of different mechanisms defines the thresholds for nonlinear behavior. These interactions could include multiple nonlinear and linear mechanisms. For example, the influence of a nonlinear annular ligament impedance on the sound transfer from the TM to the stapes could be affected by a linear stiffness within the incudostapedial joint. Linear compression and expansion of the joint capsule would act to reduce the coupling between the stapes and the TM in a frequency dependent manner (Zwislocki 1962). The reduction in coupling could lead to a local peak in the ratio of PEC and XS.
Figure 9.
The specific acoustic stiffness computed as the ratio of the threshold ear canal pressure (PEC) and the threshold displacement. (A) The computed stiffness values from the onsets of expansive growth of umbo displacements (XU), which are approximately independent of frequency below 700 Hz; (B) The computed stiffness value from the onsets of compressive growth of umbo displacements (XU); (C) The computed stiffness value from the onsets of expansive growth of stapes displacements (XS), which are approximately independent of frequency below 700 Hz; (D) The computed stiffness value from the onsets of compressive growth of stapes displacements (XS), which are approximately independent of frequency below 700 Hz. At higher frequencies, all computed stiffness values tend to have complex patterns (with local peaks and valleys) of growth with frequency. The gray dashed lines in the four panels describe slopes of growth that fit into different datasets.
4.4. Other Measures of Nonlinear Growth of Sound-induced Umbo Motion
Our measurements of expansive and compressive growth of sound-induced umbo motion reveal a little described phenomenon; however, there have been many earlier measurements describing nonlinearity in the motion of the TM and umbo in response to static pressures (e. g. Dirckx and Decraemer 1991; Ladak et al., 2004; Gaihede 1999; Lee and Rosowski 2001). Indeed, the nonlinear response of the TM (and its attached umbo) to static pressure is the basis for clinical tympanometry (Jerger 1970; Lidén et al., 1970; Feldman and Wilber 1976).
While there are significant differences in the temporal properties of the sound pressures used in this study and the quasi-static pressures used in tympanometry, there is overlap in the range of pressures and the size of the responses. In particular, the largest sound pressures we used (150~160 dB SPL) produce peak pressure changes of nearly ±2000 Pa, which is ±2% of an atmosphere or about ±200 daPa. Such pressure changes well approximate the ±300 daPa pressure changes used in tympanometry (Jerger 1970), and result (at low frequencies) in motions of the umbo that are larger than ± 30 μm, with significantly larger motions on the TM surface (Cheng et al., 2013; Dirckx and Decraemer 1991).
The presence of such significant displacements of the TM may help explain the mechanism of the expansive nonlinear motions we recorded at the umbo. Expansive nonlinearities in the middle ear functions of lizards have also been observed in one of the authors’ early study (see Figures 3 and 11 in Rosowski et al., 1984). Evidence of several studies (Funnell 1996; Fay et al. 2006; Lee and Rosowski 2001) suggests the motion of the umbo is influenced by the shape of the TM, and the magnitude of the sound pressures we employed are large enough to produce significant alterations in TM shape. Such shape changes can have two different effects: (1) The shape change may alter the mechanical coupling of the TM and the umbo by stretching some membrane elements and compressing others; (2) The shape change may lead to differences in the sound-induced 3D motion of the umbo to which our 1D motion measurements are not perfectly sensitive. Whether either of these possibilities contribute to the expansive nonlinear growth we observed in sound-induce umbo motion requires further investigation.
5. CONCLUSIONS
In summary:
The umbo and the stapes show different nonlinear behaviors with high intensity sounds: the growth of the umbo displacement expands with level at frequencies less than 2000 Hz (Figures 4A&4B), while the stapes shows a compressive response to high intensity sounds over a wide frequency range (Figures 4C&4D).
The ear canal sound pressure and umbo and stapes displacements where the nonlinearity is first obvious are frequency dependent, where the ear canal sound level needed to evoke a nonlinear response varies from 60 to 150 dB SPL and stapes displacement from 20 to −60 dB re 1 rms μm (10 μm to 1 nm), with the higher sound pressures needed at the lowest frequencies.
Similarities in the ear canal sound pressure levels that evoke expansive and compressive growth of Xu and Xs in some preparations at some stimulus frequencies suggest a weak coupling of the nonlinear processes that affect displacement growth at the two ossicular locations.
The existence of an expansive growth of umbo displacement that has limited effect on the stapes and of stapes compressive growth that is only infrequently seen at the umbo suggest that the ossicular joints reduce the coupling between multiple nonlinear mechanisms within the middle ear.
Supplementary Material
Highlights.
Middle-ear vibrations induced by moderate to high intensity tones between 200 and 20000 Hz were quantified by Laser Doppler Vibrometry.
Different nonlinear responses of the tympanic membrane and middle-ear ossicles to high intensity sounds were described and compared.
Our results suggest the presence of multiple nonlinear processes within the middle ear.
Linked analyses of the stimulus sound pressures and middle-ear displacements at the onset of middle-ear nonlinear response shed light on developing new middle-ear nonlinear model.
ACKNOWLEDGEMENTS
The authors thank Diane Jones at the Eaton-Peabody Laboratory (EPL) of the Massachusetts Eye and Ear Infirmary (MEEI) for acquiring temporal bone specimens. We would also like to thank Mike Ravicz from EPL at the MEEI for discussion about generating high intensity sounds with loud speakers. This work is supported by R01DC016079 (JTC) from NIH/NIDCD.
Footnotes
Publisher's Disclaimer: This is a PDF file of an unedited manuscript that has been accepted for publication. As a service to our customers we are providing this early version of the manuscript. The manuscript will undergo copyediting, typesetting, and review of the resulting proof before it is published in its final form. Please note that during the production process errors may be discovered which could affect the content, and all legal disclaimers that apply to the journal pertain.
REFERENCES
- Aerts JRM, Dirckx JJJ. 2010. Nonlinearity in eardrum vibration as a function of frequency and sound pressure. Hear Res. 263(1–2):26–32. [DOI] [PubMed] [Google Scholar]
- Aibara R, Welsh JT, Puria S Goode RL 2001. Human middle-ear sound transfer function and cochlear input impedance. Hear Res. 152: 100–109. [DOI] [PubMed] [Google Scholar]
- Cheng JT, Hamade M, Harrington E, Furlong C, Merchant SN & Rosowski JJ 2013. Wave motion on the surface of the human tympanic membrane: holographic measurement and modeling analysis. J. Acoust. Soc. Am, 133, 918–37. [DOI] [PMC free article] [PubMed] [Google Scholar]
- Decraemer WF, Khanna SM. 1994. Modelling the malleus vibration as a rigid body motion with one rotational and one translational degree of freedom. Hear Res. 72(1–2):1–18. [DOI] [PubMed] [Google Scholar]
- Dirckx JJJ & Decraemer WF 1991. Human tympanic membrane deformation under static pressure. Hearing Research, 51, 93–106. [DOI] [PubMed] [Google Scholar]
- Fay JP, Puria S & Steele CR 2006. The discordant eardrum. PNAS, 103, 19743–8. [DOI] [PMC free article] [PubMed] [Google Scholar]
- Feldman AS & Wilber LA 1976. Acoustic impedance and admittance- the measurement of middle-ear function, Baltimore MD, Williams & Wilkins. [Google Scholar]
- Funnell WR 1996. Low-frequency coupling between eardrum and manubrium in a finite-element model. J. Acoust. Soc. Am, 99, 3036–43. [DOI] [PubMed] [Google Scholar]
- Gaihede M 1999. Mechanics of the middle ear system: computerized measurements of its pressure-volume relationship. Auris Nasus Larynx, 26, 383–399. [DOI] [PubMed] [Google Scholar]
- Gan RZ, Wood MW and Dormer KJ. 2004. Human Middle Ear Transfer Function Measured by Double Laser Interferometry System. Otology & Neurotology. Vol. 25(4): 423–435. [DOI] [PubMed] [Google Scholar]
- Gladine K, Muyshondt PGG, Dirckx JJJ. 2017. Human middle-ear nonlinearity measurements using laser Doppler vibrometry. Optics and Lasers in Engineering. 99: 98–102. [Google Scholar]
- Goode RL, Killion M, Nakamura K and Nishihara S. 1994. New Knowledge About The Function Of The Middle Ear: Development Of An Improved Analog Model. The American Journal of Otology. 15(2): 145–154. [PubMed] [Google Scholar]
- Greene NT, Jenkins HA, Tollin DJ and Easter JR. 2017. Stapes Displacement and Intracochlear Pressure In Response To Very High Level, Low Frequency Sounds. Hear Res. 348:16–30. [DOI] [PMC free article] [PubMed] [Google Scholar]
- Greene NT, Alhussaini MA, Easter JS, Argo TF 4th, Walilko T, Tollin DJ 2018. Intracochlear pressure measurements during acoustic shock wave exposure. Hear Res. 365:149–164. [DOI] [PMC free article] [PubMed] [Google Scholar]
- Guinan JJ Jr., Peake WT. 1967. Middle-ear characteristics of anesthetized cats. J Acoust Soc Am. 41: 1237–1261. [DOI] [PubMed] [Google Scholar]
- Huang S, Dong W, and Olson E. 2012. Subharmonic Distortion in Ear Canal Pressure and Intracochlear Pressure and Motion. JARO 13: 461–471 [DOI] [PMC free article] [PubMed] [Google Scholar]
- Jerger J 1970. Clinical experience with impedance audiometry. Arch Otolaryng, 92, 311–324. [DOI] [PubMed] [Google Scholar]
- Kobrak HG. 1948. Construction material of the sound conduction system of the human ear. J Acoust. Soc. Am, 20, 125–130. [Google Scholar]
- Kruger B, Tonndorf J. 1977. Middle ear transmission in cats with experimentally induced tympanic membrane perforations. J. Acoust. Soc. Am, 61, 126–132. [DOI] [PubMed] [Google Scholar]
- Ladak HM, Decraemer WF, Dirckx JJJ & Funnell WRJ 2004. Response of the cat eardrum to static pressures: Mobile versus immobile malleus. J. Acoust. Soc. Am, 116, 3008–3021. [DOI] [PubMed] [Google Scholar]
- Lee C-Y & Rosowski 2001. Effect of middle-ear static pressure on pars tensa and pars flaccida in gerbil ears. Hear Res, 153, 146–163. [DOI] [PubMed] [Google Scholar]
- Lidén G, Peterson JL & Björkman G 1970. Tympanometry. Arch. Otolaryngol, 92, 248–257. [DOI] [PubMed] [Google Scholar]
- Nakajima HH, Dong W, Olson ES, Merchant SN, Ravicz ME, Rosowski JJ. 2009. Differential intracochlear sound pressure measurements in normal human temporal bones. J Assoc Res Otolaryngol.; 10(1):23–36. [DOI] [PMC free article] [PubMed] [Google Scholar]
- Nuttall AL 1974. Tympanic muscle effects on middle-ear transfer characteristics. J. Acoust. Soc. Am, 56, 1239–1247. [DOI] [PubMed] [Google Scholar]
- Pang XD, Peake WT. 1986. How do contractions of the stapedius muscle alter the acoustic properties of the middle ear? In: ALLEN JB, HALL JL, HUBBARD A, NEELY ST & TUBIS A (eds.) Peripheral Auditory Mechanisms. New York: Springer-Verlag. [Google Scholar]
- Pascal J, Bourgeade A, Lagier M and Legros C. 1998. Linear and nonlinear model of the human middle ear. J. Acoust, Soc. Am. 1998, 104(3): 1509–1516. [DOI] [PubMed] [Google Scholar]
- Price GR. 1974. Upper limit to stapes displacement: implications for hearing loss. J Acoust Soc Am; 56(1):195–9. [DOI] [PubMed] [Google Scholar]
- Price GR, and Kalb JT 1991. Insight into hazard from intense impulses from a mathematical model of the ear. J. Acoust. Soc. Am, 90, 219–227. [DOI] [PubMed] [Google Scholar]
- Price GR. 2007. Validation of the auditory hazard assessment algorithm for the human with impulse noise data. J Acoust. Soc. Am, 122, 2786–802. [DOI] [PubMed] [Google Scholar]
- Ravicz ME, Rosowski JJ. 2012. Chinchilla middle-ear admittance and sound power: High-frequency estimates and effects of inner-ear modifications. J. Acoust. Soc. Am, 132, 2437–2454. [DOI] [PMC free article] [PubMed] [Google Scholar]
- Rosowski JJ, Peake WT & TJ III Lynch 1984. Acoustic input-admittance of the alligator-lizard ear: Nonlinear features. Hearing Research, 16, 205–223. [DOI] [PubMed] [Google Scholar]
- Rosowski JJ, Davis PJ, Merchant SN, Donahue KM, Coltrera MD 1990. Cadaver middle ears as models for living ears: Comparisons of middle-ear input immittance. Ann Otol Rhinol Laryngol, 99, 403–412. [DOI] [PubMed] [Google Scholar]
- Rosowski JJ, Remenschneider AK and Cheng JT. 2019. Limitations of Present Models of Blast-Induced Sound Power Conduction through the External and Middle Ear. J. Acoust, Soc. Am. 146 (5):3978–3992. [DOI] [PMC free article] [PubMed] [Google Scholar]
- Rubenstein M, Feldman B, Fischler H, Frei EH, Spira D. 1966. Measurement of stapedial-footplate displacements during transmission of sound through the middle ear. J. Acoust. Soc. Am, 40, 1420–1426. [DOI] [PubMed] [Google Scholar]
- von Bekesy G 1960. Experiments in Hearing, Wever EG, Ed. (McGraw-Hill, New York: ). [Google Scholar]
- Voss SE, Rosowski JJ, Merchant SN, Peake WT. 2001. Middle-ear function with tympanic membrane perforations. II. A simple model. J Acoust Soc Am, 110, 1445–1452. [DOI] [PubMed] [Google Scholar]
- Zagadou B, Chan P, Ho K, Shelley D. 2016. Impulse noise injury prediction based on cochlear energy. Hear Res, 342, 23–38. [DOI] [PubMed] [Google Scholar]
- Zwislocki J 1962. Analysis of the middle-ear function. Part I: Input impedance. J. Acoust. Soc. Am, 34, 1514–1523. [Google Scholar]
Associated Data
This section collects any data citations, data availability statements, or supplementary materials included in this article.


