Abstract
Genes encoding synaptic proteins are highly associated with neuronal disorders many of which show clinical co-morbidity. We integrated 58 published synaptic proteomic datasets that describe over 8000 proteins and combined them with direct protein–protein interactions and functional metadata to build a network resource that reveals the shared and unique protein components that underpin multiple disorders. All the data are provided in a flexible and accessible format to encourage custom use.
Subject terms: Molecular neuroscience, Protein databases, Data integration
Introduction
At neuronal synapses, the proteomes in presynaptic and postsynaptic compartments form complex and highly dynamic molecular networks. These networks mediate signal transduction and plasticity processes that underpin normal (and abnormal) information processing in the brain. We systematically curated proteomic datasets dating from 2000 to 2020, to produce a comprehensive index of the proteins (and their genes) expressed at the mammalian synapse (see Methods for details). This resulted in 58 papers, which when combined, describe a landscape of 8087 synaptic genes.
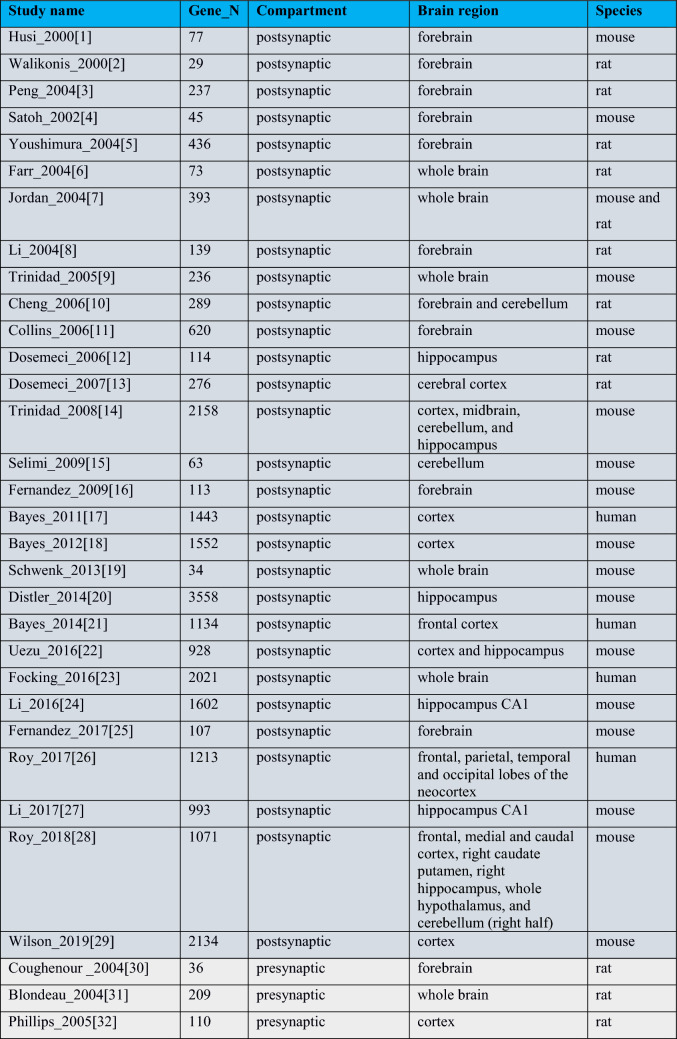
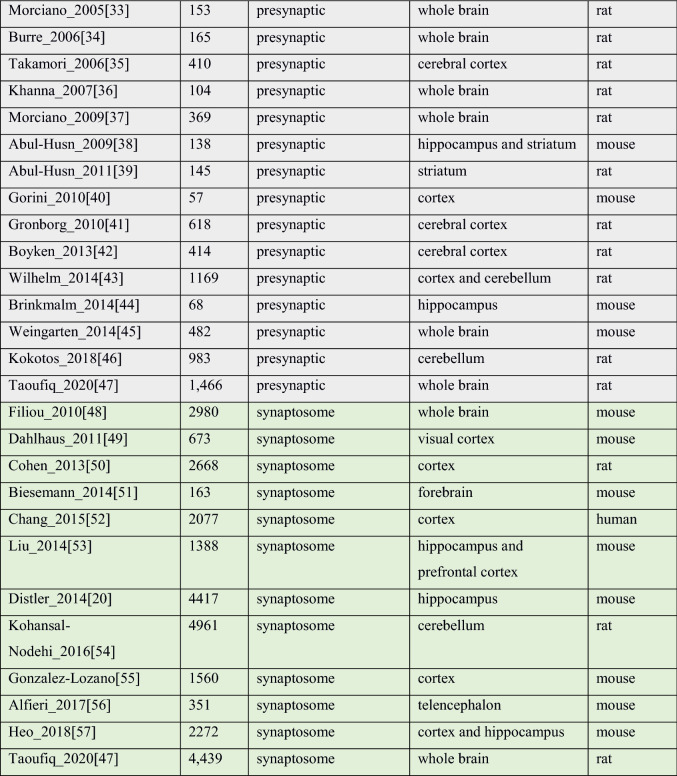
The set includes 29 post synaptic proteome (PSP) studies (2000 to 2019) contributing a total of 5560 mouse and human unique gene identifiers; 18 presynaptic studies (2004 to 2020) describe 2772 unique human and mouse gene IDs, and 11 studies that span the whole synaptosome and report 7198 unique genes (Table 1, Supplementary Table 1).
Table 1.
Studies included in the database.
Dark grey corresponds to postsynaptic, light grey—to presynaptic, and green—to synaptosomal studies.
Each study was annotated with relevant metadata including GO function, disease association and cross-ref to SynGo. Orthologues were mapped across human, mouse and rat and each mapped onto stable identifiers (MGI, Entrez and Uniprot).
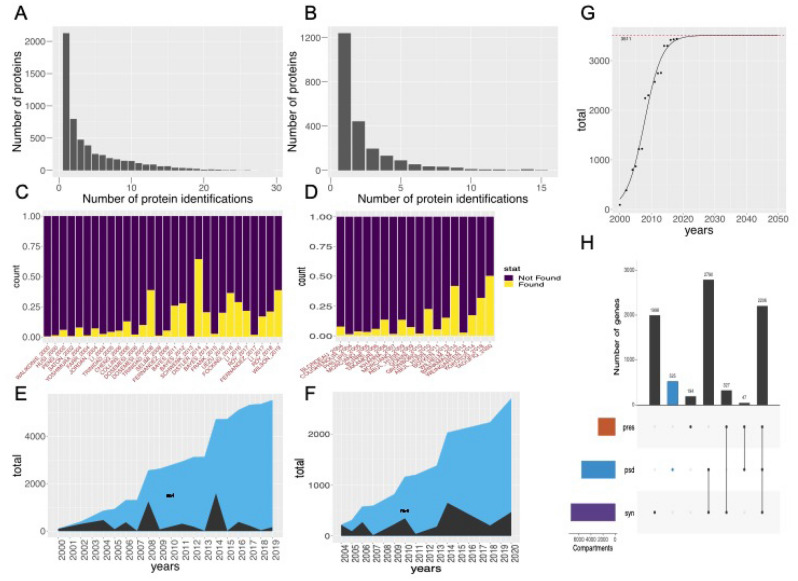
High throughput proteomic techniques are powerful, but they are noisy, and contamination is always a concern. A large number (2091 for PSP and 1434 for presynapse, Fig. 1A,B) of proteins have been observed just once. While single hits may be accounted for lack of sensitivity with low abundance molecules, it could also indicate the presence of false positive components brought in by experimental uncertainty.
Figure 1.
(A) Discovery rate of new PSD proteins across 29 postsynaptic studies, where the number of proteins is plotted against the frequency of identification. 2091 PSP proteins have been observed just once. The most frequently found proteins (i.e. detected in 22, or more, studies out of the 29) include very well-known PSD proteins, for example: DLG4 (28/29), CAMK2A (27/29), INA (26/29), SPTBN1, CAMK2B, DLG2, NSF, GRIN2B, GRIN1 (25/29), BIAP2, BSN (24/29) (full list in Supplementary Table 2). (B) Discovery rate of new proteins analysed across 18 presynaptic studies. More than half of the proteins in the presynaptic proteome (1251) have been observed just once. The most frequent presynaptic genes include AP2B1, HSPA8, GNAO1, ACTB (15/17), STX1B, ATP6V0A1, STXBP1, ATP1A3, ATP6V1E1, SYT1, GNB1, TUBA1A, VAMP2, NSF, DNM1 (14/17) with full statistics available in Supplementary Table 3. (C) Contribution of each of 29 studies to the total number of PSP genes (purple—total number of genes, yellow—identified in this study). Two major jumps in the gross number of proteins identified occur in 2008, when 1249 new proteins were reported by14 and in 2014 with 2588 new proteins added by20. (D) Contribution of each of 18 studies to the total number of presynaptic genes (purple—total number of genes, yellow—identified in this study): two jumps in newly discovered proteins correspond to studies in years 2010 and 2014. (E) Accumulation of the new PSP genes (black) compared to the total datasets (blue) over years. (F) Accumulation of new presynaptic genes (black) compared to the total datasets (blue) over years. (G) Non-linear fit predicting the total size of “consensus” PSP (genes found in two and more studies, 3499) (P = 2.36E−11, residual standard error: 192.7 on 12 degrees of freedom) by year 2023 which, when compared to the current number (3438) indicates that our knowledge on PSP components, based on currently available methodologies, is close to saturation. (H) Overlap of three synaptic datasets: presynaptic, postsynaptic and synaptosomal. Bars correspond to the number of unique genes in each compartment and their intersections.
The rate of growth with respect to newly discovered proteins for PSP appears to be slowing (Fig. 1C,E) and therefore there is now an opportunity to define a more reliable subset. Following the approach described in11, we selected genes found in two or more independent studies to designate the “consensus” PSP. This resulted in 3,438 genes, which is ~ 7 times larger than reported by11 and described a subset of synaptic proteins for which have higher confidence. In this subset we observe the increment of new genes per year decreases after 2008 and drops completely after 2014 (Fig. 1C). Based on this, we predict a total number of consensus PSP genes found to be 3499 (Fig. 1G) by year 2023 which, when compared to the current number indicates that our knowledge on PSP components, based on currently available methodologies, is close to saturation.
It is different for the presynaptic compartment, where the recent trend in newly identified genes indicates that saturation has not been achieved yet (Fig. 1D,F). For instance, the latest study by Taoufiq et al.47 brought in over 400 new genes to our presynaptic list.
The overlap of proteins found in pre- and post-synaptic datasets, and proteins identified in synaptosomal studies is shown at Fig. 1H and Fig. 1 in Supplementary Methods.
To reconstruct protein–protein interaction (PPI) networks for the pre- and post-synaptic proteomes we used human PPI data filtered for the highest confidence direct and physical interactions from BioGRID58, Intact59 and DIP60. The resulting PSP network contains 4817 nodes and 27,788 edges in the Largest Connected Component (LCC). The presynaptic network is significantly smaller and comprises 2221 nodes and 8678 edges in the LCC.
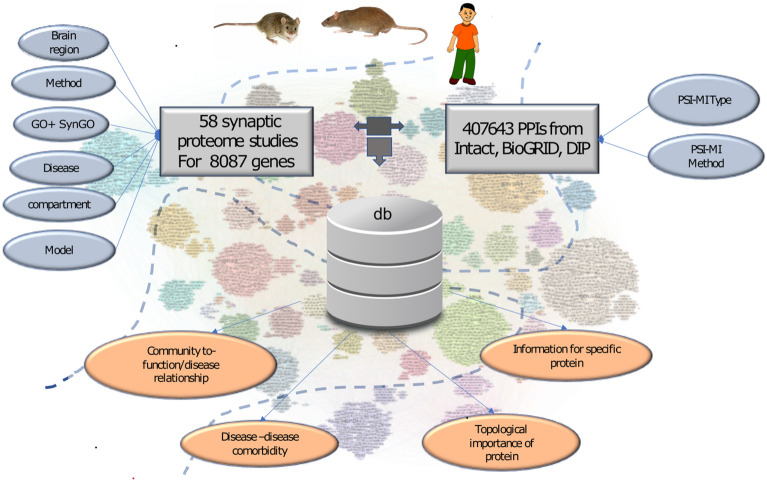
The resulting network model is embedded into a SQLite implementation allowing users to derive custom network models based on meta-data including species, disease association, synaptic compartment, brain region, and method of extraction (Fig. 2). The database with manual is available from Supplementary Materials and from Edinburgh DataShare https://doi.org/10.7488/ds/3017, along with a SQLite Studio manual and Rmd file for querying under the R environment, a screencast walk-through demonstrating use-cases can also be found here https://youtu.be/oaW9Yr9AkXM.
Figure 2.
Structure of the SQLite database, which includes 58 synaptic studies covering 8087 unique genes and 407,643 direct protein interactions. Grey ovals on the top show the annotated metadata: left—for nodes/ genes, which include brain region, subcellular compartment, method of extraction, disease and GO function annotation and link to published quantitative models; right—for edges/PPIs, which include PSI-MI type and method. The orange ovals in the bottom illustrate the possible outcomes of the database, including: (1) information for specific protein/gene, and (2) information that could be obtained from PPI network, e.g., protein’s topological importance, community to disease relationship, and disease-disease comorbidity. The database is available as a Supplementary File and from Edinburgh DataShare https://doi.org/10.7488/ds/3017.
The dataset can be used to answer frequent questions such as “What is known about my favourite gene? Is it pre- or postsynaptic? Which brain region was it identified in?”. Beyond that, users can extend these queries to extract custom networks based on bespoke subsets of molecules. Worked examples that are easy to customise are shown in the Supplementary files.
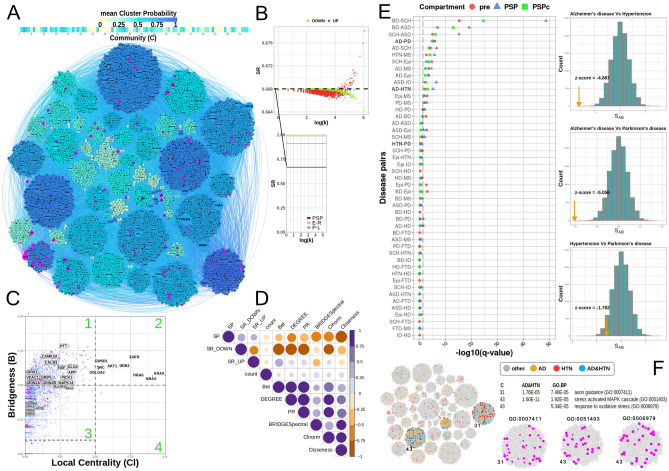
The underlying principle of a systems biology approach is that structural features (pathways and subnetworks) underpin network functionality and given a network, one should be able to extract these features. Clustering algorithms61,62 are commonly used to identify local communities within the network under the assumption that shared network topology correlates with shared function (and dysfunction). However, the more important question is how the different communities are organised to enable a controllable flow of signals across the large network. Using the PSP network as example, we identified 1029 “Bridging” proteins as those known to interact locally with neighbours in the network—helping organise function inside communities they belong to63,64, and simultaneously influence other communities in the network (Fig. 3A, Methods). Using graph entropy as a compliment means of ranking a protein’s ability to inhibit or enhance information flow65, we found that proteins with high Bridgeness value have ability to decrease the entropy of the network thus facilitating the signal transmission (Fig. 3B,D, Methods). Of the 1029 candidate Bridging proteins (see Region 1, Fig. 3C), we found ~ 43%) associated with at least one known synaptopathy and ~ 21% linked to multiple diseases including: APP (AD&Epi&ASD&PD&HTN&MS&FTD), VDAC1 (AD&PD&MS), and MAPK14 (AD&SCH&HD&HTN&MS), which supports the functional/disease importance of “bridging” proteins. Indeed, we found significant overrepresentation for specific diseases, such as AD (P = 3.4 × 10⁻⁶), HTN (P = 2.1E−5), HD (P = 5.2E−5), PD (P = 2.6E−3) (Supplementary Table 2).
Figure 3.
(A) Community structure of the PSP network using the Spectral modularity method. Communities are coloured using the average gene-community probability values: bluer coloured a community is, the more probable the genes are of belonging to that community on average. Nodes coloured magenta highlight the core PSD95 interactors25, which is also highlighted magenta in the Bridgeness plot in (C). (B) Graph entropy plots: (main) Global graph entropy rate (SR) plot comparing the structure of the PSP network (0.668) against 1000 randomised Erdos–Renyi (E–R = 0.989 + − 0.0005) and Power–Law (P–L = 0.9127 + − 0.0032, αPSP = 2.41) models of similar size, (Enlarged) Evidence for scale-free structure in PSP network using a perturbation analysis (10], plotted is the SR values after each protein is perturbed through over-expression (SR_UP = red) and under-expression (SR_OWN = green), against the log of the proteins degree,. (C) Bridging proteins, estimated using the Spectral clustering algorithm are plotted against semi-local centrality (Methods), allowing their categorisation: Region 1, proteins having a 'global' rather than 'local' influence in the network (also been called bottle-neck bridges, connector or kinless hubs12 (DLG4, GRIN2B, CAMK2A, etc.). Region 2, proteins having 'global' and 'local' influence (EGFR, HRAS, NRAS, etc.). Region 3, proteins centred within the community they belong to, but also communicating with a few other specific communities (GRIN1, GRIA2-4). Region 4, proteins with 'local' impact , primarily within one or two communities (local or party hubs9. (D) Correlation plot for different centrality measures estimated for PSP network.: SP - a protein’s shortest path value, SR_UP-Entropy rate when protein is over expressed, SR_DOWN—entropy rate when protein is under expressed, COUNT - number of protein identifications in the studies, Bet - protein’s betweenness centrality value, Degree—protein degree, PR- Page Rank, BRIDGESpectral —protein Bridgeness value, CNorm - Protein’s local centrality value, Closeness - protein’s closeness value; correlation between SR_UP and Bridgeness indicates that genes with higher Bridgeness values also lower the graphs entropy when active/overexpressed, which allows the signal to pass more freely (Supplementary Table 2). (E) left: Disease-disease relationship for presynaptic (red) and PSD full (blue) and PSD consensus (green) interactome. Where significance q-values < 0.05 is delineated by the dashed line. Schizophrenia (SCH), Autistic Spectrum Disorder (ASD), Autistic Disorder (AUT), Bipolar Disorder (BD), Intellectual Disability (ID), Alzheimer disease (AD), Epilepsy Syndrome (Epi), Parkinson's Disease (PD), Frontotemporal Dementia (FTD), Huntington's Disease (HD) and Multiple Sclerosis (MS) are considered; right: randomisation studies for disease-disease pairs overlap, yellow arrow shows the measured value of Z-score compared to 10,000 AD-HTN, PD-HTN and AD-PD random models. (F) Colocalization of AD and HTN on the PSP network by propagating these gene-disease associations (GDA) through the network using the Belief Propagation DC-SBM algorithm13. The colocalization of AD and HTN shared common molecular pathways in communities 31 and 43, which were also found enriched for axon guidance, stress-activated MAPK cascade and response to oxidative stress GO BP terms.
There are many complex co-morbidities between psychiatric disorders at the population and the genetic level but for most the molecular basis remains elusive. The network perspective can be used to obtain a different view by linking topology and phenotype together. Gene-disease association data is noisy and far from complete, but we can partly compensate by measuring, for each disease, the distance from each protein in the network to its nearest known associated protein, which can be extended to disease pairs66 to dissect how these different neurological diseases coalesce at the synapse.
Using PSP (both full and consensus) and presynaptic networks we found clear evidence of network overlap between well-known co-morbid neuro-psychiatric/developmental disorders in both postsynaptic and presynaptic models (q-values shown for PSP/presynaptic networks), including BD-SCH (P = 2.0E−49/4.39E−16), BD-ASD (P = 7.12E−20/1.28E−7), and ASD/SCH (P = 6.17E−16/1.12E−5). Similarly, overlap was observed for common neurodegenerative diseases/conditions AD and PD (P = 3.04E−6/1.32E−6).
We also observed compartment-specific overlaps for Epilepsy with PD (P = 0.53/2.12E−3) and BD (P = 0.54/9.73E−4), which is significant only in the presynaptic network (Fig. 3E).
In both postsynaptic and presynaptic models, we found overlap for Hypertension (HTN) with AD (P = 8.6E−4/1.0E−2, and with MS (P = 8.79E−5/2.12E−3) (Fig. 3E). The AD-HTN link is not, in itself, new but commonly considered as a cardiovascular mechanism with a neurological impact. However, the network view reveals a new potential mechanistic link at the synapse. Although we found significant overlaps between AD-HTN and AD-PD, we did not see evidence for a PD-HTN link (P = 0.17/0.36), which indicates the potential shared mechanistic pathway between AD and HTN, which is different to the pathways shared between AD and PD (Fig. 3E).
To further dissect the potential sharing of pathways between AD and HTN in the PSP network (Fig. 3F), we employed Belief Propagation to propagate these GDA’s through the network’s edges, and a Degree-Corrected Block Model (DC-SBM) to model its effect on network clustering67. Under a prior assumption of no correlation between the GDA’s and the network communities, we found evidence for the co-localization of AD and HTN (C = 31 P = 4.69E−5 and C = 43 P = 1.6E−11). Functionally, these communities are enriched for synaptic transmission, axon guidance (C = 31, GO:0007268 = 5.8E−3, GO:0007411 = 7.46E−5), stress activated MAPK cascade and response to oxidative stress (C = 43, GO:0051403 = 1.92E−5, GO:0006979 = 5.34E−5).
The presented synapse proteome dataset is the largest, most complete and up to date and is freely available with lightweight tools to allow anyone to extract relevant subsets. It compliments previously published curated dataset of synaptic genes SynGO68, and both resources could be used jointly as we have cross-referenced the common genes. By mirroring the methods used it would be straightforward for any user to add in their own datasets for comparison.
Supplementary Information
Acknowledgements
We would like to thank Anatoly Sorokin for help with the database. This research has received funding from the European Union’s Horizon 2020 Framework Programme for Research and Innovation under the Specific Grant Agreement Nos. 695568, 785907, 945539 (SYNNOVATE, Human Brain Project SGA02 and Human Brain Project SGA3), Wellcome Trust (Technology Development Grant 202932) and the Simons Initiative for the Developing Brain (SFARI—529085).
Author contributions
O.S., C.M., M.С., E.W., K.H., D.S., T.I.S. collected, reviewed and combined the datasets. C.M., O.S., X.H. performed the analysis. O.S. built the database. O.S., C.M. prepared Figs. 1, 2, 3. O.S., C.M., S.G. and J.D.A. wrote the manuscript. All authors reviewed the manuscript.
Competing interests
The authors declare no competing interests.
Footnotes
The original online version of this Article was revised: The original version of this Article contained an error in the spelling of the author T. Ian Simpson which was incorrectly given as Thomas I. Simpson.
Publisher's note
Springer Nature remains neutral with regard to jurisdictional claims in published maps and institutional affiliations.
Change history
8/4/2021
A Correction to this paper has been published: 10.1038/s41598-021-95608-0
Contributor Information
Oksana Sorokina, Email: Oksana.Sorokina@ed.ac.uk.
Colin Mclean, Email: Colin.D.Mclean@ed.ac.uk.
Supplementary Information
The online version contains supplementary material available at 10.1038/s41598-021-88945-7.
References
- 1.Husi H, et al. Proteomic analysis of NMDA receptor-adhesion protein signaling complexes. Nat. Neurosci. 2000;3(7):661–669. doi: 10.1038/76615. [DOI] [PubMed] [Google Scholar]
- 2.Walikonis RS, et al. Identification of proteins in the postsynaptic density fraction by mass spectrometry. J. Neurosci. 2000;20(11):4069–4080. doi: 10.1523/JNEUROSCI.20-11-04069.2000. [DOI] [PMC free article] [PubMed] [Google Scholar]
- 3.Peng J, et al. Semiquantitative proteomic analysis of rat forebrain postsynaptic density fractions by mass spectrometry. J. Biol. Chem. 2004;279(20):21003–21011. doi: 10.1074/jbc.M400103200. [DOI] [PubMed] [Google Scholar]
- 4.Satoh K, et al. Identification of activity-regulated proteins in the postsynaptic density fraction. Genes Cells. 2002;7(2):187–197. doi: 10.1046/j.1356-9597.2001.00505.x. [DOI] [PubMed] [Google Scholar]
- 5.Yoshimura Y, et al. Molecular constituents of the postsynaptic density fraction revealed by proteomic analysis using multidimensional liquid chromatography-tandem mass spectrometry. J. Neurochem. 2004;88(3):759–768. doi: 10.1046/j.1471-4159.2003.02136.x. [DOI] [PubMed] [Google Scholar]
- 6.Farr CD, et al. Proteomic analysis of native metabotropic glutamate receptor 5 protein complexes reveals novel molecular constituents. J. Neurochem. 2004;91(2):438–450. doi: 10.1111/j.1471-4159.2004.02735.x. [DOI] [PMC free article] [PubMed] [Google Scholar]
- 7.Jordan BA, et al. Identification and verification of novel rodent postsynaptic density proteins. Mol. Cell Proteom. 2004;3(9):857–871. doi: 10.1074/mcp.M400045-MCP200. [DOI] [PubMed] [Google Scholar]
- 8.Li KW, et al. Proteomics analysis of rat brain postsynaptic density. Implications of the diverse protein functional groups for the integration of synaptic physiology. J. Biol. Chem. 2004;279(2):987–1002. doi: 10.1074/jbc.M303116200. [DOI] [PubMed] [Google Scholar]
- 9.Trinidad JC, et al. Phosphorylation state of postsynaptic density proteins. J. Neurochem. 2005;92(6):1306–1316. doi: 10.1111/j.1471-4159.2004.02943.x. [DOI] [PubMed] [Google Scholar]
- 10.Cheng D, et al. Relative and absolute quantification of postsynaptic density proteome isolated from rat forebrain and cerebellum. Mol. Cell Proteom. 2006;5(6):1158–1170. doi: 10.1074/mcp.D500009-MCP200. [DOI] [PubMed] [Google Scholar]
- 11.Collins MO, et al. Molecular characterization and comparison of the components and multiprotein complexes in the postsynaptic proteome. J. Neurochem. 2006;97(Suppl 1):16–23. doi: 10.1111/j.1471-4159.2005.03507.x. [DOI] [PubMed] [Google Scholar]
- 12.Dosemeci A, et al. Preparation of postsynaptic density fraction from hippocampal slices and proteomic analysis. Biochem. Biophys. Res. Commun. 2006;339(2):687–694. doi: 10.1016/j.bbrc.2005.11.069. [DOI] [PubMed] [Google Scholar]
- 13.Dosemeci A, et al. Composition of the synaptic PSD-95 complex. Mol. Cell Proteom. 2007;6(10):1749–1760. doi: 10.1074/mcp.M700040-MCP200. [DOI] [PMC free article] [PubMed] [Google Scholar]
- 14.Trinidad JC, et al. Quantitative analysis of synaptic phosphorylation and protein expression. Mol. Cell Proteom. 2008;7(4):684–696. doi: 10.1074/mcp.M700170-MCP200. [DOI] [PubMed] [Google Scholar]
- 15.Selimi F, et al. Proteomic studies of a single CNS synapse type: The parallel fiber/purkinje cell synapse. PLoS Biol. 2009;7(4):e83. doi: 10.1371/journal.pbio.1000083. [DOI] [PMC free article] [PubMed] [Google Scholar]
- 16.Fernandez E, et al. Targeted tandem affinity purification of PSD-95 recovers core postsynaptic complexes and schizophrenia susceptibility proteins. Mol. Syst. Biol. 2009;5:269. doi: 10.1038/msb.2009.27. [DOI] [PMC free article] [PubMed] [Google Scholar]
- 17.Bayes A, et al. Characterization of the proteome, diseases and evolution of the human postsynaptic density. Nat. Neurosci. 2011;14(1):19–21. doi: 10.1038/nn.2719. [DOI] [PMC free article] [PubMed] [Google Scholar]
- 18.Bayes A, et al. Comparative study of human and mouse postsynaptic proteomes finds high compositional conservation and abundance differences for key synaptic proteins. PLoS ONE. 2012;7(10):e46683. doi: 10.1371/journal.pone.0046683. [DOI] [PMC free article] [PubMed] [Google Scholar]
- 19.Schwenk J, et al. High-resolution proteomics unravel architecture and molecular diversity of native AMPA receptor complexes. Neuron. 2012;74(4):621–633. doi: 10.1016/j.neuron.2012.03.034. [DOI] [PubMed] [Google Scholar]
- 20.Distler U, et al. In-depth protein profiling of the postsynaptic density from mouse hippocampus using data-independent acquisition proteomics. Proteomics. 2014;14(21–22):2607–2613. doi: 10.1002/pmic.201300520. [DOI] [PubMed] [Google Scholar]
- 21.Bayes A, et al. Human post-mortem synapse proteome integrity screening for proteomic studies of postsynaptic complexes. Mol. Brain. 2014;7:88. doi: 10.1186/s13041-014-0088-4. [DOI] [PMC free article] [PubMed] [Google Scholar]
- 22.Seo TK, Thorne JL. Information criteria for comparing partition schemes. Syst. Biol. 2018;67(4):616–632. doi: 10.1093/sysbio/syx097. [DOI] [PMC free article] [PubMed] [Google Scholar]
- 23.Focking M, et al. Proteomic analysis of the postsynaptic density implicates synaptic function and energy pathways in bipolar disorder. Transl. Psychiatry. 2016;6(11):e959. doi: 10.1038/tp.2016.224. [DOI] [PMC free article] [PubMed] [Google Scholar]
- 24.Li J, et al. Long-term potentiation modulates synaptic phosphorylation networks and reshapes the structure of the postsynaptic interactome. Sci. Signal. 2016;9(440):8. doi: 10.1126/scisignal.aaf6716. [DOI] [PubMed] [Google Scholar]
- 25.Fernandez E, et al. Arc requires PSD95 for assembly into postsynaptic complexes involved with neural dysfunction and intelligence. Cell Rep. 2017;21(3):679–691. doi: 10.1016/j.celrep.2017.09.045. [DOI] [PMC free article] [PubMed] [Google Scholar]
- 26.Roy M, et al. Proteomic analysis of postsynaptic proteins in regions of the human neocortex. Nat. Neurosci. 2018;21(1):130–138. doi: 10.1038/s41593-017-0025-9. [DOI] [PubMed] [Google Scholar]
- 27.Li J, et al. Spatiotemporal profile of postsynaptic interactomes integrates components of complex brain disorders. Nat. Neurosci. 2017;20(8):1150–1161. doi: 10.1038/nn.4594. [DOI] [PMC free article] [PubMed] [Google Scholar]
- 28.Roy M, et al. Regional diversity in the postsynaptic proteome of the mouse brain. Proteomes. 2018;6:3. doi: 10.3390/proteomes6030031. [DOI] [PMC free article] [PubMed] [Google Scholar]
- 29.Wilson RS, et al. Development of targeted mass spectrometry-based approaches for quantitation of proteins enriched in the postsynaptic density (PSD) Proteomes. 2019;7:2. doi: 10.3390/proteomes7020012. [DOI] [PMC free article] [PubMed] [Google Scholar]
- 30.Coughenour HD, Spaulding RS, Thompson CM. The synaptic vesicle proteome: A comparative study in membrane protein identification. Proteomics. 2004;4(10):3141–3155. doi: 10.1002/pmic.200300817. [DOI] [PubMed] [Google Scholar]
- 31.Blondeau F, et al. Tandem MS analysis of brain clathrin-coated vesicles reveals their critical involvement in synaptic vesicle recycling. Proc. Natl. Acad. Sci. U.S.A. 2004;101(11):3833–3838. doi: 10.1073/pnas.0308186101. [DOI] [PMC free article] [PubMed] [Google Scholar]
- 32.Phillips GR, et al. Proteomic comparison of two fractions derived from the transsynaptic scaffold. J. Neurosci. Res. 2005;81(6):762–775. doi: 10.1002/jnr.20614. [DOI] [PubMed] [Google Scholar]
- 33.Morciano M, et al. Immunoisolation of two synaptic vesicle pools from synaptosomes: A proteomics analysis. J. Neurochem. 2005;95(6):1732–1745. doi: 10.1111/j.1471-4159.2005.03506.x. [DOI] [PubMed] [Google Scholar]
- 34.Burre J, et al. Analysis of the synaptic vesicle proteome using three gel-based protein separation techniques. Proteomics. 2006;6(23):6250–6262. doi: 10.1002/pmic.200600357. [DOI] [PubMed] [Google Scholar]
- 35.Takamori S, et al. Molecular anatomy of a trafficking organelle. Cell. 2006;127(4):831–846. doi: 10.1016/j.cell.2006.10.030. [DOI] [PubMed] [Google Scholar]
- 36.Khanna R, Zougman A, Stanley EF. A proteomic screen for presynaptic terminal N-type calcium channel (CaV2.2) binding partners. J. Biochem. Mol. Biol. 2007;40(3):302–314. doi: 10.5483/bmbrep.2007.40.3.302. [DOI] [PubMed] [Google Scholar]
- 37.Morciano M, et al. The proteome of the presynaptic active zone: From docked synaptic vesicles to adhesion molecules and maxi-channels. J. Neurochem. 2009;108(3):662–675. doi: 10.1111/j.1471-4159.2008.05824.x. [DOI] [PubMed] [Google Scholar]
- 38.Abul-Husn NS, et al. Systems approach to explore components and interactions in the presynapse. Proteomics. 2009;9(12):3303–3315. doi: 10.1002/pmic.200800767. [DOI] [PMC free article] [PubMed] [Google Scholar]
- 39.Abul-Husn NS, et al. Chronic morphine alters the presynaptic protein profile: Identification of novel molecular targets using proteomics and network analysis. PLoS ONE. 2011;6(10):e25535. doi: 10.1371/journal.pone.0025535. [DOI] [PMC free article] [PubMed] [Google Scholar]
- 40.Gorini G, et al. Dynamin-1 co-associates with native mouse brain BKCa channels: Proteomics analysis of synaptic protein complexes. FEBS Lett. 2010;584(5):845–851. doi: 10.1016/j.febslet.2009.12.061. [DOI] [PMC free article] [PubMed] [Google Scholar]
- 41.Gronborg M, et al. Quantitative comparison of glutamatergic and GABAergic synaptic vesicles unveils selectivity for few proteins including MAL2, a novel synaptic vesicle protein. J. Neurosci. 2010;30(1):2–12. doi: 10.1523/JNEUROSCI.4074-09.2010. [DOI] [PMC free article] [PubMed] [Google Scholar]
- 42.Boyken J, et al. Molecular profiling of synaptic vesicle docking sites reveals novel proteins but few differences between glutamatergic and GABAergic synapses. Neuron. 2013;78(2):285–297. doi: 10.1016/j.neuron.2013.02.027. [DOI] [PubMed] [Google Scholar]
- 43.Wilhelm BG, et al. Composition of isolated synaptic boutons reveals the amounts of vesicle trafficking proteins. Science. 2014;344(6187):1023–1028. doi: 10.1126/science.1252884. [DOI] [PubMed] [Google Scholar]
- 44.Brinkmalm A, et al. Targeting synaptic pathology with a novel affinity mass spectrometry approach. Mol. Cell Proteom. 2014;13(10):2584–2592. doi: 10.1074/mcp.M114.040113. [DOI] [PMC free article] [PubMed] [Google Scholar]
- 45.Weingarten J, et al. The proteome of the presynaptic active zone from mouse brain. Mol. Cell Neurosci. 2014;59:106–118. doi: 10.1016/j.mcn.2014.02.003. [DOI] [PubMed] [Google Scholar]
- 46.Kokotos AC, et al. Activity-dependent bulk endocytosis proteome reveals a key presynaptic role for the monomeric GTPase Rab11. Proc. Natl. Acad. Sci. U.S.A. 2018;115(43):E10177–e10186. doi: 10.1073/pnas.1809189115. [DOI] [PMC free article] [PubMed] [Google Scholar]
- 47.Taoufiq Z, et al. Hidden proteome of synaptic vesicles in the mammalian brain. Proc. Natl. Acad. Sci. U.S.A. 2020;117(52):33586–33596. doi: 10.1073/pnas.2011870117. [DOI] [PMC free article] [PubMed] [Google Scholar]
- 48.Filiou MD, et al. Profiling of mouse synaptosome proteome and phosphoproteome by IEF. Electrophoresis. 2010;31(8):1294–1301. doi: 10.1002/elps.200900647. [DOI] [PubMed] [Google Scholar]
- 49.Dahlhaus M, et al. The synaptic proteome during development and plasticity of the mouse visual cortex. Mol. Cell Proteom. 2011;10(5):5413. doi: 10.1074/mcp.M110.005413. [DOI] [PMC free article] [PubMed] [Google Scholar]
- 50.Cohen LD, et al. Metabolic turnover of synaptic proteins: Kinetics, interdependencies and implications for synaptic maintenance. PLoS ONE. 2013;8(5):e63191. doi: 10.1371/journal.pone.0063191. [DOI] [PMC free article] [PubMed] [Google Scholar]
- 51.Biesemann C, et al. Proteomic screening of glutamatergic mouse brain synaptosomes isolated by fluorescence activated sorting. Embo J. 2014;33(2):157–170. doi: 10.1002/embj.201386120. [DOI] [PMC free article] [PubMed] [Google Scholar]
- 52.Chang RY, et al. SWATH analysis of the synaptic proteome in Alzheimer's disease. Neurochem. Int. 2015;87:1–12. doi: 10.1016/j.neuint.2015.04.004. [DOI] [PubMed] [Google Scholar]
- 53.Liu XA, et al. New approach to capture and characterize synaptic proteome. Proc. Natl. Acad. Sci. U.S.A. 2014;111(45):16154–16159. doi: 10.1073/pnas.1401483111. [DOI] [PMC free article] [PubMed] [Google Scholar]
- 54.Kohansal-Nodehi M, et al. Analysis of protein phosphorylation in nerve terminal reveals extensive changes in active zone proteins upon exocytosis. Elife. 2016;5:2. doi: 10.7554/eLife.14530. [DOI] [PMC free article] [PubMed] [Google Scholar]
- 55.Gonzalez-Lozano MA, et al. Dynamics of the mouse brain cortical synaptic proteome during postnatal brain development. Sci. Rep. 2016;6:35456. doi: 10.1038/srep35456. [DOI] [PMC free article] [PubMed] [Google Scholar]
- 56.Alfieri A, et al. Synaptic interactome mining reveals p140Cap as a new hub for PSD proteins involved in psychiatric and neurological disorders. Front. Mol. Neurosci. 2017;10:212. doi: 10.3389/fnmol.2017.00212. [DOI] [PMC free article] [PubMed] [Google Scholar]
- 57.Heo S, et al. Identification of long-lived synaptic proteins by proteomic analysis of synaptosome protein turnover. Proc. Natl. Acad. Sci. U.S.A. 2018;115(16):E3827–e3836. doi: 10.1073/pnas.1720956115. [DOI] [PMC free article] [PubMed] [Google Scholar]
- 58.Oughtred R, et al. The BioGRID interaction database: 2019 update. Nucleic Acids Res. 2019;47(D1):D529–d541. doi: 10.1093/nar/gky1079. [DOI] [PMC free article] [PubMed] [Google Scholar]
- 59.Kerrien S, et al. The IntAct molecular interaction database in 2012. Nucleic Acids Res. 2012;40:841–846. doi: 10.1093/nar/gkr1088. [DOI] [PMC free article] [PubMed] [Google Scholar]
- 60.Xenarios I, et al. DIP, the database of interacting proteins: A research tool for studying cellular networks of protein interactions. Nucleic Acids Res. 2002;30(1):303–305. doi: 10.1093/nar/30.1.303. [DOI] [PMC free article] [PubMed] [Google Scholar]
- 61.Newman ME. Modularity and community structure in networks. Proc. Natl. Acad. Sci. U.S.A. 2006;103(23):8577–8582. doi: 10.1073/pnas.0601602103. [DOI] [PMC free article] [PubMed] [Google Scholar]
- 62.McLean C, et al. mproved functional enrichment analysis of biological networks using scalable modularity based clustering. J. Proteom. Bioinform. 2016;9(1):9–18. [Google Scholar]
- 63.Han JD, et al. Evidence for dynamically organized modularity in the yeast protein–protein interaction network. Nature. 2004;430(6995):88–93. doi: 10.1038/nature02555. [DOI] [PubMed] [Google Scholar]
- 64.Nepusz T, Yu H, Paccanaro A. Detecting overlapping protein complexes in protein–protein interaction networks. Nat. Methods. 2012;9(5):471–472. doi: 10.1038/nmeth.1938. [DOI] [PMC free article] [PubMed] [Google Scholar]
- 65.Teschendorff AE, et al. Increased signaling entropy in cancer requires the scale-free property of protein interaction networks. Sci. Rep. 2015;5:9646. doi: 10.1038/srep09646. [DOI] [PMC free article] [PubMed] [Google Scholar]
- 66.Menche J, et al. Disease networks. Uncovering disease-disease relationships through the incomplete interactome. Science. 2015;347(6224):1257601. doi: 10.1126/science.1257601. [DOI] [PMC free article] [PubMed] [Google Scholar]
- 67.Newman ME, Clauset A. Structure and inference in annotated networks. Nat. Commun. 2016;7:11863. doi: 10.1038/ncomms11863. [DOI] [PMC free article] [PubMed] [Google Scholar]
- 68.Koopmans F, et al. SynGO: An evidence-based, expert-curated knowledge base for the synapse. Neuron. 2019;103(2):217–234.e4. doi: 10.1016/j.neuron.2019.05.002. [DOI] [PMC free article] [PubMed] [Google Scholar]
Associated Data
This section collects any data citations, data availability statements, or supplementary materials included in this article.


