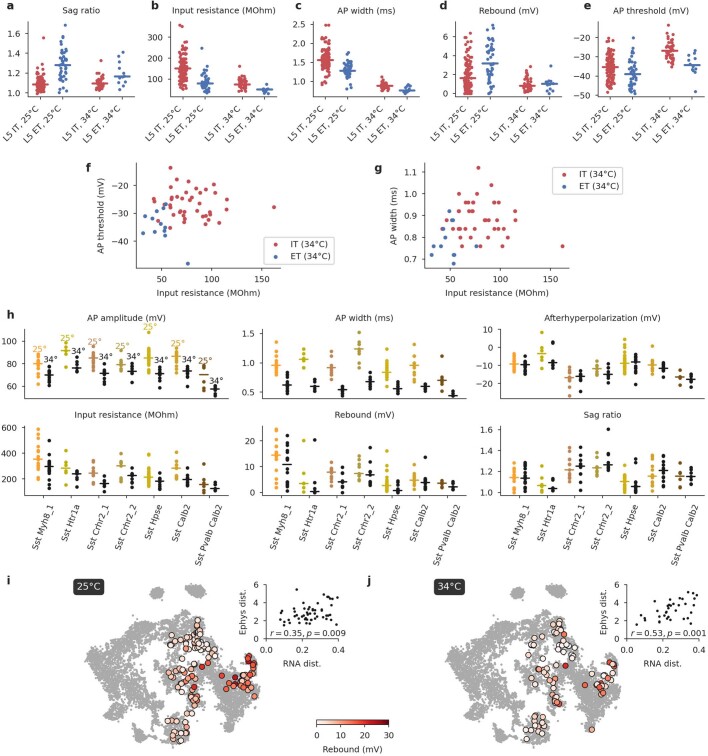
Extended Data Fig. 6. Electrophysiological properties of IT, ET, and Sst neurons in Layer 5 at physiological temperature.
a–e, Each panel shows a comparison between L5 neurons from the IT and the ET subclasses (pooled across all t-types within each subclass). The main set of experiments was done at room temperature (25 °C). Follow-up experiments were done at physiological temperature (34 °C), in the presence of 1 mM kynurenic acid and 0.1 mM picrotoxin in order to block fast glutamatergic and GABAergic synaptic transmission. Horizontal lines show median values. The first four panels correspond to features showing the largest IT/ET differences at room temperature, according to the two-sided Wilcoxon-Mann–Whitney test statistic (and omitting several features that are very correlated with the shown ones: upstroke-to-downstroke ratio, sag time, and sag area). The last panel additionally shows one feature that showed prominent difference at 34 °C. f, g, IT and ET neurons recorded at 34 °C in two-dimensional representations using the features with highest separability. h, The change of electrophysiological properties between room temperature (25 °C) and physiological temperature (34 °C) for various t-types from the Sst subclass. Only L5 neurons are shown. Only t-types with ≥ 5 cells in both conditions are shown. Horizontal lines denote median values. AP amplitude and AP width changed the most between conditions, but the relative differences between t-types stayed roughly the same. The other four shown features did not change much, and the relative differences between t-types stayed the same. i, Overlay of the L5 Sst cells over the reference t-SNE embedding, coloured by rebound, as in Fig. 4b. The inset shows the correlation between transcriptomic distances and electrophysiological differences between all pairs of Sst t-types (only for t-types with at least 5 cells, and excluding Sst Chodl), together with its p-value. j, The same analysis as in (c) but using the experiments performed at physiological temperature. No corrections for multiple comparisons were applied.

