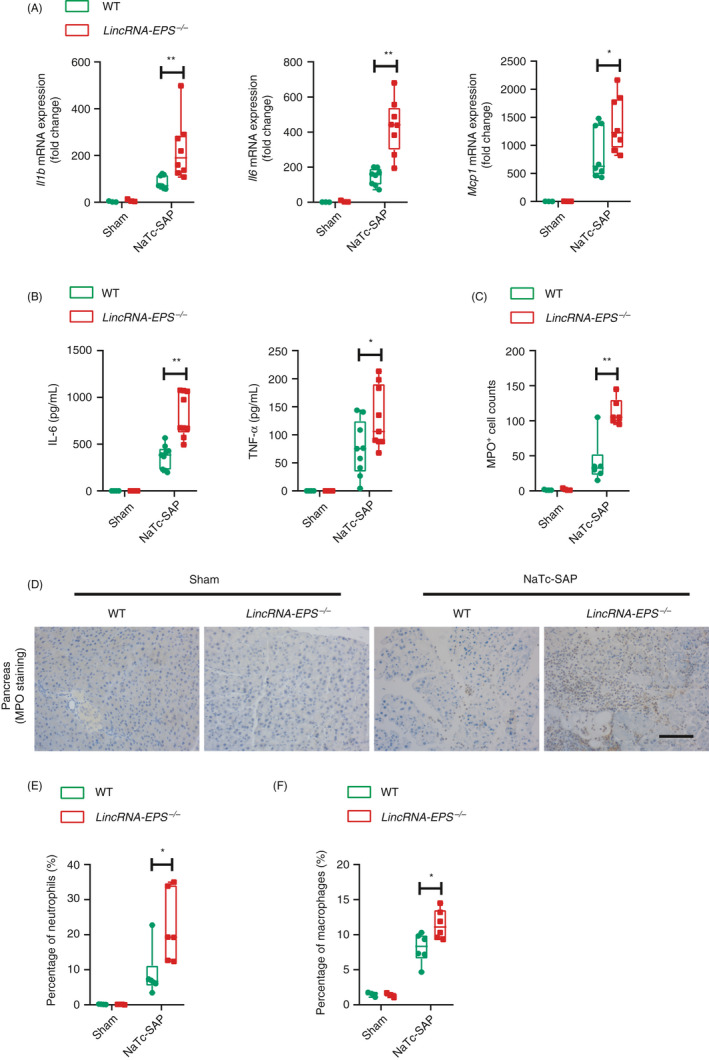
Figure 4.

lincRNA‐EPS inhibits pro‐inflammatory cytokine production and neutrophil infiltrations in the NaTc‐SAP mice. (A) 24 hr post the retrograde infusion of injection of NaTc, RT‐qPCR analysis of Il1b, Il6 and Mcp1 mRNA expression was performed in the pancreases from the indicated mice. Sham WT (n = 3), sham lincRNA‐EPS‐/‐ (n = 3), NaTc‐SAP WT (n = 8) and NaTc lincRNA‐EPS‐/‐ (n = 8) mice. (B) ELISA detection of the serum IL‐6 and TNF‐α from indicated mice, group sizes were described in (A). (C, D) Neutrophil infiltrations in the pancreases from the indicated mice were measured by MPO staining (C), and MPO+ cells were calculated based on the representative field of the pancreas sections from the indicated mice (D), sham WT (n = 4), sham lincRNA‐EPS‐/‐ (n = 4), NaTc‐SAP WT (n = 6) and NaTc‐SAP lincRNA‐EPS‐/‐ (n = 6). (E, F) Pancreatic neutrophils (E) and macrophages (F) from indicated mice were analysed by flow cytometry, and the percentage were compared. Group sizes were described in (C). Data of (C) are shown as representative pancreas sections from the indicated mice; scale bar, 100 µm. Data of (A), (B), (D), (E) And (F) are shown as the mean ± SD of one representative experiment from three independent experiments. *P < 0·05 and **P < 0·01 by unpaired Student's t‐test.
