

SUMMARY
During early obesity, pancreatic β-cells compensate for increased metabolic demand through a transient phase of insulin hypersecretion that stabilizes blood glucose and forestalls diabetic progression. We found evidence that β-cell O-GlcNAcylation, a nutrient-responsive post-translational protein modification regulated by OGT, is critical for coupling hyperlipidemia to β-cell functional adaptation during this compensatory prediabetic phase. In mice, islet O-GlcNAcylation rises-and-falls in tandem with the timeline of secretory potentiation during high-fat feeding while genetic models of β-cell specific OGT loss abolish hyperinsulinemic responses to lipids, in vivo and in vitro. We identified the ER Ca2+ ATPase SERCA2 as a β-cell O-GlcNAcylated protein in mice and humans that was able to rescue palmitate-stimulated insulin secretion through pharmacological activation. This study reveals an important physiological role for β-cell O-GlcNAcylation in sensing and responding to obesity, with therapeutic implications for managing the relationship between type 2 diabetes and its most common risk factor.
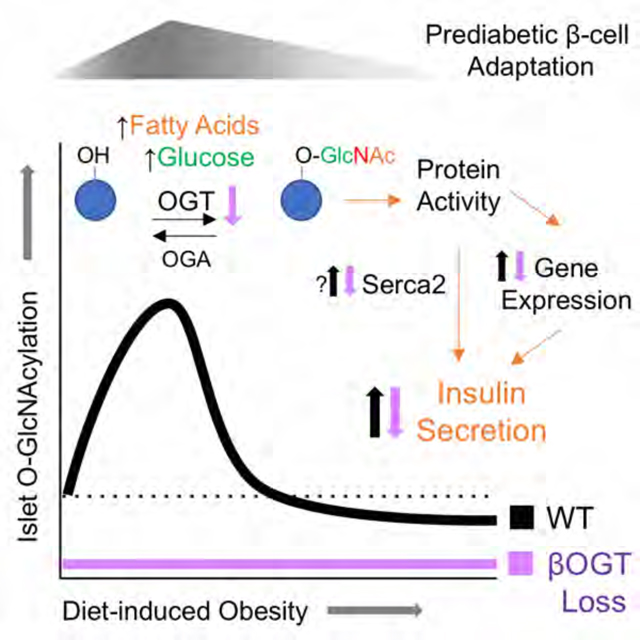
Graphical Abstract
INTRODUCTION
The rising prevalence of type 2 diabetes (T2D) has been driven in large part by increasing rates of obesity (Chatzigeorgiou et al., 2009). The development of insulin resistance is thought to be a central aspect of this relationship. However, animal models of obesity and prospective studies on human diabetes make it clear that pancreatic β-cell function, as the source of endogenous insulin, is the critical determinant of diabetic progression (Chatzigeorgiou et al., 2009; DeFronzo et al., 2013). The β-cell compensatory response to obesity (i.e. prediabetic hyperinsulinemia) is multidimensional starting with increases in functional insulin secretion and then upregulation of β-cell mass (Gupta et al., 2017; Mosser et al., 2015). With prolonged obesity, β-cell mass and systemic insulin continue to increase but cellular secretory capacity fails, marking one of the first signs of prodiabetic decompensation in both mice and humans (Groebe et al., 2018; Gupta et al., 2017). The capacity to support long-term insulin secretion is a sought-after therapeutic target and may be a key adaptation in individuals with diabetes-resistant obesity. However, the mechanisms underlying insulin secretory potentiation, which appear to be independent of gross insulin resistance (Gupta et al., 2017; Mosser et al., 2015), are poorly understood.
Protein O-GlcNAcylation is a dynamic and nutrient-sensitive post-translational modification of serine/threonine residues, with centralized control by a single attachment (O-GlcNAc Transferase, OGT) and detachment (O-GlcNAcase, OGA) enzyme. OGT is expressed in all cell types but with a particularly high abundance in pancreatic β-cells (Hanover et al., 1999; Hart and Akimoto, 2009). The physiological functions of O-GlcNAcylation are still being explored but OGA has been identified as a T2D susceptibility locus in humans (Duggirala et al., 1999; Lehman et al., 2005). Preclinical models link O-GlcNAcylation particularly to transcriptional regulation (Chiaradonna et al., 2018; Fardini et al., 2013; Wang et al.), cell stress response (Ruan et al., 2013) and hyperglycemia (Ducheix et al., 2018; Ma and Hart, 2013). Aside from enzymatic regulation, O-GlcNAcylation levels depend on the availability of the donor substrate UDP-GlcNAc, produced through the hexosamine biosynthesis pathway (HBP), gated by the rate-limiting enzyme glutamine fructose-6-phosphate amidotransferase (GFAT). Glucose is the primary HBP input but activity is also responsive to amino acids (e.g. glutamine) and specific saturated fatty acids (palmitate, stearate), which increase GFAT levels in cultured myotubes (Weigert et al., 2003). In mouse Min6 β-cells, palmitate but not oleate increased expression of HBP-promoting enzymes glucosamine-phosphate n-acetyl transferase (GPAT) and fructose 1,6-bisphosphatase (FBPase) (Busch et al., 2002). Increased muscle GFAT activity has been described in response to obesity in mice and humans (Buse et al., 1997; Daniels et al., 1996) but the profile and time course of protein O-GlcNAcylation in response to the state of obesity is underexplored and the functional relevance of a fatty acid regulatory input on HBP flux is not clear.
In this study, we characterized islet O-GlcNAcylation patterns and insulin secretion in response to obesity in mice and humans. We used multiple genetic mouse models of β-cell specific OGT loss to show that protein O-GlcNAcylation is required for insulin secretory potentiation in response to lipids, both in vitro and in vivo. Furthermore, we identified the ER Ca2+ ATPase protein SERCA2 as a β-cell OGT target, in both mouse cells and primary human islets, and as a potential therapeutic target that was able to fully rescue palmitate-stimulated insulin secretion through pharmacological activation. These findings lead us to propose a model of early obesity in which hyperlipidemic-responsive elevations in islet O-GlcNAcylation lead to changes in β-cell protein activity that enable and support insulin hypersecretion during the compensatory prediabetic state.
RESULTS
Diet-Induced Obesity Transiently Upregulates Mouse Islet O-GlcNAcylation
To probe β-cell O-GlcNAcylation as a potential mechanistic candidate for obesity-regulated insulin secretion, we used the highly specific pan-O-GlcNAc antibody (RL2), to assess protein O-GlcNAcylation on a western blot of mouse islets harvested after varying weeks of high-fat diet (HFD, 60% kcal). We chose 6 weeks (wks) HFD as our first timepoint, when female mice demonstrated signs of both in vivo and in vitro β-cell hyperfunction through significant body weight gain, serum hyperinsulinemia, potentiated islet glucose-stimulated insulin secretion (GSIS) and a trend towards increased islet insulin content (p=0.19) (Figures 1A–D). We found that 6 wks HFD-adapted islets exhibited significantly increased islet O-GlcNAcylation in the 50–60 kDa range of proteins (Figure 1E, F) compared to standard diet (SD) fed controls but without changes in the protein level of the enzymes regulating O-GlcNAc attachment (OGT) and detachment (OGA) (Figure 1G, H). This pattern was also reflected in a non-significant but dose-responsive trend towards increasing islet O-GlcNAcylation from SD to 1 to 3 wks HFD, independent of changes to OGT protein (Figure S1A–C). For rigor and to evaluate sex as a variable, we repeated the 6 wks HFD measurements in male islets.We again observed an increase in total O-GlcNAcylation compared to SD islets (Figure 1I, J), although both OGT and OGA levels were also increased (Figure 1K, L). HFD-adapted male islets showed potentiated insulin secretion relative to SD controls (Figure 1M). Metabolically, both 6 wks HFD male and female mice were hyperinsulinemic and euglycemic (Figure S1D, E).
Figure 1. High-Fat Feeding Transiently Upregulates Mouse Islet O-GlcNAcylation.

C57 mice fed a standard diet (SD) or a high-fat diet (HFD, 60% kcal fat) for 1, 3 or 6 weeks (wks) were assessed for body weight (A) and serum insulin (B) before islet harvest to test for glucose-stimulated insulin secretion (GSIS - LG=2 mM glucose, HG = 16.7 mM glucose, KCl = 30 mM potassium chloride) (C) and islet insulin content corrected to DNA (D). Islets from female mice after 6 wks HFD or SD were run on a western blot (E) and probed for total protein O-GlcNAcylation (RL2 antibody, ~ band weight in kDa on x-axis, n= 6–8) (F), OGT (n=4) (G), and OGA (n=4) (H), cumulative from 3 experiments. Similar results are shown for male mouse islets (n=4) (I-L) including GSIS (n=3) (M). Islets from 18 wks HFD or SD female mice (n=4 per) were similarly probed (N) for RL2 (O) and OGT levels (P) or GSIS (Q) and insulin content (R) (n=3). Data from panels A, B and D were analyzed by 1-way ANOVA with Dunnett’s multiple comparisons. Blot data, including individual RL2 bands, was analyzed by 2-tailed t-test. Islet GSIS was analyzed by repeated measures (RM) 2-way ANOVA with Sidak’s or Dunnet’s multiple comparisons. *, **, ***, ****p<0.05, 0.01, 0.001, 0.0001 HFD vs. SD. #, ##, #### p<0.05, 0.01, 0.0001 vs LG (within genotype group). For all GSIS experiments, stimulant (LG, HG and KCl inclusive) had a significant independent impact on insulin secretion in the ANOVA (p<0.0001 in C, M; p<0.001 in Q). Vinc = Vinculin.
By contrast, female islet O-GlcNAcylation of 50–60 kDa proteins and OGT were equivalent to SD levels at 12 wks HFD (Figure S1F–H) and significantly below baseline after 18 wks HFD (Figure 1N–P). Importantly, islet insulin secretion and total insulin content were not elevated relative to SD controls (Figure 1Q, R) despite the persistence of a hypernutrient, prediabetic, in vivo environment (Figure S1I). These data support previous studies showing a shift forward in diabetic progression for C57 mice after 16 wks HFD (Gupta et al., 2017; Wang and Liao, 2012). Altogether, our findings show a temporal correlation between the effects of hypernutrition on secretory hyperinsulinemia and the O-GlcNAcylation of specific islet proteins in mice.
Human Obesity Status Correlates to Islet O-GlcNAcylation and Secretory Index
We also investigated O-GlcNAcylation patterns in human islets obtained from donors without diabetes and with a lean body mass index (Ln, BMI ≤25) or a body mass consistent with obesity (Ob, BMI>30), through the Integrated Islet Distribution Program (IIDP) and Alberta Islet Distribution Program (Table S1). It is important to note that due to the instability of the O-GlcNAcylation signal and infrequent availability of donors with a lean BMI, human islets were run as Ln/Ob pairs, one pair per blot, with normalization to control prior to group averaging. We initially pooled all human islet data but statistical analysis showed that sex was a strong factor in the impact of obesity on human islet O-GlcNAcylation (p<0.001 by 2-way ANOVA) and we subsequently separated male and female analyses.
Based on RL2 western blotting, we found that O-GlcNAcylation and OGT levels were significantly depressed in islets from male donors with obesity compared to islets from donors with a lean BMI (Figure 2A–D), similar to the pattern we observed in 18-wks-HFD (female only) mouse islets. However, the cumulative O-GlcNAcylation of obesity-adapted islets was still acutely sensitive to elevated nutrient flux as a 2-hour exposure to glucose (16.7 mM) and palmitate (100 uM) increased total islet RL2 (Figure S2A, B). Surprisingly, islet O-GlcNAcylation from donors with a lean BMI was not impacted by the short nutrient exposure (Figure S2C, D), indicating an upregulation in sensitivity specific to the obesity state. In contrast to the male islets, data from female islets showed that obesity was not significantly correlated to total islet O-GlcNAcylation or OGT levels (Figure 2E–H) but RL2 intensity trended higher in the 50–60 kDa range of proteins (p=0.18) (Figure 2I). Overall, the female data was more reminiscent of mouse data seen in the 6–12 wks HFD groups.
Figure 2. Islet O-GlcNAcylation and Secretion Patterns in Human Obesity.

Islet protein O-GlcNAcylation, OGT and insulin secretory function were evaluated in human islets from donors without diabetes and with either a lean body mass index (Ln, BMI≤25) or a body weight consistent with obesity (Ob, BMI>30). Representative western blots (A) and quantification of individual RL2 protein bands (B), total RL2 (C) and OGT level (D) for n=6 Ln/Ob male islet pairs. Similar assessments are shown for n=5 Ln/Ob female islet pairs (E-H) and the 50–60 kDa RL2 band (I). For the same islet pairs, the impact of obesity on insulin stimulation index (SI = HG/LG, provided by isolation institute) is plotted vs. total RL2 (Ob/Ln ratios) (J). A scatter plot with linear regression (dashed line) demonstrates the relationship between human donor body mass index (BMI) and islet SI for a larger dataset of 39 female (K) and 85 male donors (L) derived from demographic and islet information in the IIDP database. Statistical analysis of all demographic factors relative to islet SI is shown in (M). Continuous variables (BMI, Age, HbA1c) were analyzed by linear regression. Discrete variables (Blood group – A, AB, B, O; Ethnicity – Asian, Black/African American, Hispanic/Latino, White) were analyzed by 1-way ANOVA. In blot data, Ln/Ob islet pairs were selected based on temporal availability, run on their own blot shortly after receipt, and normalized to the Ln control before group averaging. Statistical analysis of single proteins or bands was by one-sample t-test. *p<0.05 indicates significant difference from 1. FC = fold change.
The high variability in both analyses suggests that the random pairing of human islets from low and high BMI donor categories captured islet adaptation at different points along the obesity-compensation timeline described in Figure 1. To explore the idea further, we looked at islet stimulation index (SI), a measure of insulin secretory capacity (high glucose /low glucose insulin release) reported by each islet isolation center according to a common and standardized procedure (Table S1). A plot of SI over total RL2 (Ob/Ln ratios) shows that when obesity was associated with increased islet O-GlcNAcylation it was also correlated to higher insulin secretion whereas less O-GlcNAcylation in islets from the donor with high BMI tended to coincide with a diminished SI compared to the lean BMI control (Figure 2J). It was also apparent that the male islet Ob/Ln pairs contained a greater proportion of low O-GlcNAcylation/low-secretion relationships than the female islet pairs (Figure 2J). An analysis of a larger set of donors and their islets, available through the online IIDP database (Table S2), further corroborates the viability of this hypothesis. Among the reported demographic characteristics (BMI, age, HbA1c, blood group, ethnicity), none of which were different between sexes, female BMI had a modest but significant positive correlation to islet insulin secretion (R2=0.16, p<0.01) (Figure 2K) while male BMI had no effect (R2=0.01) (Figure 2L). None of the other demographics correlated to SI in either sex (Figure 2M). In sum, obesity status was associated with reduced islet O-GlcNAcylation among male but not female donors, which may have reflected a greater degree of β-cell decompensation rather than sexual dimorphism per se.
β-cell OGT Loss Prevents Hyperinsulinemia During Diet-Induced Obesity in Mice
Both human and mouse islet data support a correlative relationship between obesity, islet O-GlcNAcylation and insulin secretion. To determine whether β-cell O-GlcNAcylation is required for obesity-induced hyperinsulinemia, we sought a mouse model with a genetically engineered loss of β-cell OGT. Rather than the non-physiological and hyperglycemic full βOGT KO model (Alejandro et al., 2015), we generated mice with only partial β-cell OGT loss (Rip-cre; Ogt flox/+, βOGT Het). Female βOGT Het mice have a natural mosaicism of OGT+ and OGT- β-cells (Fig. 3A), arising from X-linked inactivation of a heterozygously-expressed floxed Ogt gene on the X chromosome. These mice demonstrated a 15–30% reduction in total islet O-GlcNAcylation and OGT under SD feeding (Figure 3B–D) and, importantly, showed no differences in body weight, blood glucose or insulin levels at 2 months of age (Figure S3A–C) or after 5–6 months (Figure S3D–F) and normal glucose tolerance (Figure S3G). Under HFD, both WT and βOGT Het mice gained weight but to a lesser degree in βOGT Het mice, resulting in a significantly smaller group average at 9 wks HFD (Figure 3E). However, the primary phenotype of the βOGT Het mice was a failure to upregulate circulating insulin levels, despite hyperinsulinemia in littermate controls over the same timeframe (Figure 3F), confirmed in multiple independent cohorts (Figure S3H–J). An in vivo GSIS assay at 10–11 wks HFD pointed to impaired insulin release in the βOGT Het (Figure 3G). Surprisingly, we saw no significant glucose intolerance (p=0.48), although this may have been obscured by a trend towards improved insulin sensitivity (p=0.12) (Figure S3K, L). Nevertheless, βOGT Het mice did exhibit a consistent mild elevation in blood glucose throughout the HFD period (genotype p<0.01 by 2-way ANOVA, Figure S3M). Importantly, β-cell mass was preserved after 11 wks of HFD (Figure S3N), implicating deficits in secretion as the likely source of the in vivo hypoinsulinemia. We repeated these experiments in tamoxifen (tmx)-induced β-cell OGT loss mice (Mip-Cre ERTM; Ogt flox/flox or flox/y, iβOGT KO), which were metabolically normal under SD conditions within the timeframe of the experiment, including serum insulin and glucose tolerance (Figure S4A, B) 4 wks after tmx and body weight, blood glucose, in vivo SI and serum insulin after 10–14 wks (Figure S4C–F). Female iβOGT KO mice gained weight normally but showed relative hypoinsulinemia by 9 wks HFD with severe deficits in in vivo GSIS compared to tmx-treated WT controls (Figure 3H–J). In this case, female iβOGT KO mice did show impaired glucose tolerance at 6 wks HFD (Figure 3K) with no differences in insulin sensitivity (Figure S4G). Male iβOGT KOs responded to HFD similarly, with normal weight gain but serum hypoinsulinemia compared to WT littermates (Figure S4H, I). Finally, we isolated islets from both SD-treated and 6 wks HFD WT and βOGT Het female mice and evaluated them for in vitro insulin secretion. SD-derived islets showed no genotype-driven differences but in HFD-adapted islets, βOGT Het insulin secretion was significantly impaired relative to WT controls (genotype p<0.05 by 2-way ANOVA, Figure 3L). Islet insulin content was similar across all groups (Figure S3O). These data provide strong evidence that β-cell protein O-GlcNAcylation is critical for the development of systemic and islet-specific secretory hyperinsulinemia during the early stages of HFD-induced obesity in mice.
Figure 3. β-cell OGT Loss Prevents HFD Hyperinsulinemia in Mice.

Mouse models with varying degrees of β-cell OGT loss were evaluated for metabolic responses to HFD feeding. In the partial loss model (Rip-cre; Ogt flox/+, βOGT Het), insulin+/RL2+ (white asterisk) and insulin+/RL2- (red asterisk) β-cells are shown in a 12 wk HFD-adapted βOGT Het islet (A). Scale bar in lower right panel shows 10 um. Representative blot (B) and quantification of OGT (C) and total protein O-GlcNAcylation (D) in SD βOGT Het and WT islets (n=7,10; 3 experiments (expts)). βOGT Het and WT mice were monitored over 9 wks of HFD for body weight (E, n=14,22; 4 expts) and serum insulin (F, n=5) with in vivo GSIS at 10 wks (G, n= 5,9; 2 expts). HFD responses at similar timepoints for Tmx-induced iβOGT KO (Mip-cre; Ogt flox/flox) female mice and Tmx-WT controls (n=6,9; 2 expts) including body weight (H) and serum insulin (I), intraperitoneal (IP) glucose tolerance test at 6 wks with area under the curve (AUC) in the inset (J) and in vivo GSIS (K). In vitro GSIS from βOGT Het and WT islets, isolated after 6 wks HFD (checkered bars, n=4; 3 expts) and after SD (solid bars, n=6,5; 3 expts). Behavior and islet GSIS data was analyzed by RM 2-way ANOVA with Sidak’s multiple comparisons. Protein levels of OGT and RL2 were analyzed by 1- and 2-tailed t-test (respectively). *,**p<0.05, 0.01 vs. WT. aaaa p<0.0001 vs. Wk 0, b, bbbb p<0.05, 0.001 vs. Wk 6 HFD. n.s. p>0.05, #, ##, #### p<0.05, 0.01, 0.0001 vs. basal condition (Wk 0, fasting or w/in group LG). AUC was calculated in Prism. Tmx = Tamoxifen, F = Female.
Transcriptomic Analysis of βOGT KO Islets Implicates Insulin Secretion and Lipids
To more broadly evaluate mechanisms and effectors that may regulate β-cell function downstream of OGT activity, we performed an RNA deep sequencing on islets from pre-hyperglycemic βOGT KO and WT female SD mice (n=4–5 per genotype over two runs, representative heatmaps from individual mice in Figure 4A). From this, we generated a robust list of 284 differentially expressed genes (DEGs, minimum fold-change 1.5, FDR p<0.05, Table S3) that redundantly appeared in two runs independently or in a pooled data analysis (see Figure 4B). We then used Ingenuity Pathway Analysis (IPA) and DAVID Bioinformatics Resources (Huang da et al., 2009) to produce an unbiased list of molecular functions and pathways implicated by the βOGT KO transcriptome. “Insulin secretion” occurred within the top 5 hits for IPA, KEGG, GO and Reactome while 3 out of 4 of these also included some form of lipid processing (Figure 4C). IPA generated a set of 28 pancreas-specific upstream regulator proteins predicted to govern subsets of target DEGs, including several we identified in the literature as regulated by direct or indirect protein O-GlcNAcylation, including Pdx1 and Akt (Table S4). Validating this analysis, we previously used a candidate approach to show that Pdx1 protein and Akt signaling were decreased in βOGT KO islets (Alejandro et al., 2015). A network of the top IPA-selected upstream regulators and their DEG targets is shown in Figure 4D, with an asterisk on putative OGT-regulated proteins.
Figure 4. Transcriptome Analysis of βOGT KO Islets.

In depth RNA-sequencing of WT and βOGT KO female islets (30–50 days old, n=5,4; 2 expts) identified 284 differentially expressed genes (DEGs, 1.5-fold minimum change, FDR p<0.05) that were redundant to both experiments and a pooled data analysis. The figure shows representative heatmaps (A) and a Venn diagram of the overlapping analyses (B). Ingenuity Pathway Analysis (IPA) and the DAVID bioinformatics databases were used to predict pathways (IPA - pancreas only; Reactome, KEGG) and biological processes (GO) implicated by the pattern of DEGs (C). Insulin secretion is highlighted in yellow, lipids in orange. The top IPA-predicted pancreas-specific upstream regulators (ranked by number of target DEGs) and 22 of their IPA-selected target genes are shown in relationship on a network diagram (D). Proteins reported in the literature to be regulated by O-GlcNAcylation (see Tables 1, S4) are labeled with an asterisk.
β-cell OGT Loss Islets are Insensitive to Palmitate-Potentiation of Insulin Secretion
Given the prominence of insulin secretion in the functional analysis of the RNAseq data, we sought to investigate the triggering pathway of β-cell insulin secretion (nutrient-driven ATP → KATP channel inhibition → membrane depolarization → voltage-gated Ca2+ influx → insulin exocytosis). Total islet ATP levels were equivalent between WT and βOGT KO islets after a 1-hour incubation in 25 mM glucose but actually higher after galactose or palmitate (Figure 5A). We also did not see differences in HFD-adapted islet ATP between βOGT Het or iβOGT KO mice and their respective controls (Figure S5A,B). Next, we investigated the protein expression of the KATP channel subunits Kir6.2 and SUR1, which were reduced at the transcript level (Kcnj11, Abcc8) in βOGT KO islets (Table S3). We found that islet Kir6.2 protein was normal but βOGT KO SUR1 was reduced by more than 50% (Figure 5B,C), potentially signaling a reduction in membrane KATP channel trafficking (Rorsman and Ashcroft, 2018). We sought to support this idea by directly measuring membrane depolarization through patch clamp electrophysiology but due to membrane fragility, we were unable to record from a sufficient number βOGT KO β-cells for quantification. Current clamp recordings in induced iβOGT KO β-cells (intact islets) resulted in stereotypical oscillatory activity in response to elevated glucose (3 to 12 mM) (Figure 5D) but with significantly depolarized membrane potentials (Vm) compared to WT controls under multiple conditions (low, high glucose and KATP channel opener diazoxide) (Figure 5E). This finding is supported by similar data from dispersed islet cells, showing a depolarization of resting Vm in iβOGT KO β-cells (Figure 5F).Despite this, we were surprised to find no change in SUR1 protein in a blot of iβOGT KO and WT islets (Figure S5C). We also did not see significant changes in oscillatory characteristics from intact preps under high glucose – neither slow wave characteristics (oscillatory period, active phase duration (Figure 5G)) nor spike activity (active phase firing frequency, amplitude (Figure 5H, I)). Nevertheless, as elevated ATP and membrane depolarization are more typically associated with β-cell hypersecretion, we re-examined βOGT KO islet insulin secretion by pooling data across multiple experiments for greater power. We found that under SD conditions, β-cell OGT loss did not lead to an islet secretory defect when insulin release was normalized to insulin content (βOGT KO - Figure 5J, iβOGT KO - Figure 5M, βOGT Het - Figure 3L), which is a more specific measure of stimulus-secretion coupling not confounded by reduced islet insulin content (Figure 5K). However, β-cell OGT loss completely prevented fatty-acid stimulated insulin secretion (FASIS), with WT SD islets showing significantly potentiated GSIS after an acute incubation in palmitate (100 uM, 2 hrs prior + concurrently) while KO secretion was unaffected in either the constitutive (Figure 5L) or induced models (Figure 5M).
Figure 5. β-cell OGT Loss Abrogates Palmitate Potentiation of Insulin Secretion.

Mechanisms of β-cell stimulus-secretion coupling were evaluated under normal and hyperlipidemic conditions. Islet ATP content in βOGT KO vs. WT islets (n=3) after 1 hour in glucose (G, 25 mM), galactose (Gal, 5 mM) or palmitate (100 uM, pre-complexed 6:1 to BSA) (A). Representative blots and quantification of Kir6.2 (B) and SUR1 (C) in islets from the same model (n=3–5). Perforated patch recordings were performed to evaluate β-cell electrical activity and membrane potential (Vm), with example traces from a Tmx-WT (black) and iβOGT KO (blue) cell showing oscillations after a shift from low to high extracellular glucose (D).Average Vm during stimulation (12 mM G), at rest (3 mM G), and in response to KATP channel-opener diazoxide (100 uM) is shown for β-cell recordings from intact islets (E, n=6 cells/5 mice WT; n=6 cells/4 mice iβOGT KO) and Vm at rest from recordings of dispersed islet β-cells (F, n=11 cells/4 mice WT; n=9 cells/6 mice iβOGT KO. Glucose-stimulated excitatory activity was quantified for oscillatory period and active phase duration (G), Ca2+ spike frequency (H) and maximum spike amplitude (I) (n=5 per genotype, intact). WT and βOGT KO islet GSIS (J) and insulin content (K) were analyzed after combining SD data from multiple experiments (n=10; 5 expts). Islet GSIS is also shown +/− palmitate (P, Fatty Acid Stimulated Insulin Secretion - FASIS) for βOGT KO and WT islets (n=4, 2 expts) (L) and for iβOGT KO and Tmx-WT islets (n=3) (M). Data in panels A-I, K were analyzed by independent Student t-test, per condition. GSIS data was analyzed by RM 2-way ANOVA with uncorrected Fisher’s LSD multiple comparisons (LG vs. HG) in panel J and Sidak’s multiplicity-adjusted multiple comparisons in panels L, M (G vs. P, within each genotype group). n.s.>0.05, *, **, **** p<0.05, 0.01, 0.0001 vs. WT control or HG vs. HGP (panels L, M only). ##, ## p<0.05, 0.01 vs. w/in group basal condition (LG or LG+P).
Increased Activity of SERCA2, a β-cell OGT Target, Rescues βOGT KO Islet FASIS
To better pinpoint mechanistic candidates specific to the context of early obesity, we cross-referenced our list of βOGT KO DEGs with a published transcriptomics dataset of C57 mouse islets adapted to 8 wks of HFD (Motterle et al., 2017) (Table S5). Among these genes (Table 1), we noted Atp2a2, which encodes for the ER Ca2+ ATPase SERCA2. This gene was downregulated by OGT loss, upregulated by HFD and the protein was suggested as a potential OGT target in the rodent heart and brain (Pereira et al., 2013; Takada et al., 2012; Trinidad et al., 2012). We tested whether SERCA2 was O-GlcNAcylated in β-cells through immunoprecipitation (IP) of human islet lysates and a mouse β-cell insulinoma line (Min6). RL2 pulldown of O-GlcNAcylated proteins revealed a strong SERCA2 signal in both mouse and human cells (Figure 6A) and a similarly strong RL2 band in a SERCA2 pull-down of Min6 lysates (Figure 6B), confirming SERCA2 as an OGT target in β-cells. We then looked at SERCA2 protein levels, which were decreased in βOGT KO islets but unchanged in the inducible model (Figure 6C–F). Given the equivalent islet secretory dysfunction between these mice, this pointed towards a functional impairment of β-cell SERCA2 downstream of OGT loss. Therefore, we attempted an in vitro rescue by increasing islet SERCA2 activity through the allosteric small molecule activator CDN1163, validated by others in islets (Kang et al., 2016; Tong et al., 2016). While the drug had no effect on GSIS, or on palmitate FASIS in WT islets, it fully restored the palmitate hypersecretion in iβOGT KO islets, elevating insulin release above the level of equivalently-treated WT islets (Figure 6G). CDN1163 also improved palmitate FASIS in constitutive βOGT KO islets (Figure 6H), without altering islet insulin content in either model (Figure S6A,B). Together, these data show that OGT loss leads to deficits in the lipid-sensitive amplification of β-cell stimulus-secretion coupling and that increased SERCA2 activity, now a confirmed OGT target, is sufficient to fully restore acute palmitate potentiation of insulin secretion.
Table 1. Mouse Islet Genes Differentially Expressed by both HFD and βOGT Loss.
Top 10 βOGT KO DEGs are shown, that were also transcriptionally regulated in islets by 8 wks HFD (Motterle et al., 2017); ranked by the number of upstream OGT contacts (see table S5). Genes reported to encode O-GlcNAcylated proteins are underlined. The direction of the fold-change in expression by condition is indicated by the direction and size of the arrows. The full list is in Table S5.
| OGT KO | HFD | Cell Activity |
|---|---|---|
| ↑ | ↑ | Immune Response, Insulin Secretion / Production, Apoptosis |
| ↓ | ↓ | Lipid Metabolism, Insulin Secretion |
| ↓ | ↑ | Ca2+ Homeostasis, ER Stress |
| ↓ | ↑ | Lipid metabolism |
| ↓ | ↑ | Immune Response, Cell Proliferation / Differentiation / Death, Stress Response, Pancreatic Embryogenesis, RET signaling |
| ↓ | ↑ | Insulin Production, Proinsulin Maturation |
| ↓ | ↑ | Cell Death, ER Stress, Insulin Secretion, Autophagy, Inflammation, Oxidative Stress, Membrane Integrity |
| ↓ | ↑ | Lipid Metabolism, Insulin Secretion, Protein Trafficking |
| ↑ | ↑ | Inflammation, Islet Embryogenesis, Insulin Resistance |
| ↓ | ↑ | ER Stress (UPR, ERAD), Protein Trafficking, Cell Death, Protein Metabolism/Degradation |
| Gene | Name |
|---|---|
| CD44 | CD44 |
| LPL | Lipoprotein Lipase |
| ATP2A2 | ATPase SR / ER Ca2+ transporting 2 |
| CYP51 | Cytochrome P450 family 51 subfamily A member 1 |
| DUSP4 | Dual specificity phosphatase, MAP Kinase Phosphatase 2 |
| PCSK1 | Proprotein convertase subtilisin / kexin type 1 |
| I APP | Islet Amyloid Polypeptide, Amylin |
| SQLE | Squalene epoxidase |
| SEMA3C | Semaphorin 3C |
| DNAJB9 | DnaJ heat shock protein (Hsp40) family member B9 |
Figure 6. O-GlcNAcylation Target, SERCA2, Rescues Palmitate FASIS.

The O-GlcNAcylation status of SERCA2 protein was evaluated by immunoprecipitation (IP).Western blots show SERCA2 and O-GlcNAcylated proteins in the lysates from HG+P+PUGNAC treated human islets (combined from 8 donors) and PUGNAC-treated mouse Min6 β-cells (left, Input) and lysates subjected to IP pull-down by RL2 or normal mouse IgG control antibodies (right) (A). The same Min6 lysates were subjected to SERCA2 IP with RL2 and SERCA2 immunoblotting (IB), with red arrows indicating areas of overlapping signal (B). Islet SERCA2 protein level was evaluated in βOGT KO vs. WT islets (n=4–5; 2 expts) (C) and for iβOGT KO vs Tmx-WT islets (n=3) (D, E). OGT quantification from blot in D is shown for model validation (F). The effect of SERCA2 allosteric-activator compound CDN1163 (10 uM) on GSIS and palmitate FASIS (plotted as islet SI) is shown for Tmx-WT and iβOGT KO islets (n=3; 2 expts) (G) and on palmitate FASIS in βOGT KO islets (n=4; 2 expts) (H). CDN1163 FASIS data (panel G) was analyzed by RM 2-way ANOVA with Sidak’s multiple comparisons. All other data was analyzed by independent Student t-test. *p<0.05 vs. control, as indicated. #, ##, ### p<0.05, 0.01, 0.001 vs. glucose-only.
DISCUSSION
Islet O-GlcNAcylation in Response to Obesity
In mice, islet O-GlcNAcylation was increased in tandem with islet insulin secretory potentiation, noticeably after 3 weeks of HFD and significantly after 6 weeks. This was not due to a change in the protein level of regulatory enzymes OGT and OGA in the female islets. In the male islets, OGT and OGA were both elevated, suggesting an upregulation of O-GlcNAc cycling not necessarily correlated to global O-GlcNAcylation levels. Instead, the likely source is an increase in production of OGT substrate UDP-GlcNAc through the nutrient-driven hexosamine biosynthesis pathway (HBP). While glucose is the initial input of the HBP, it also utilizes components from the catabolism of every major nutrient category, including lipids. Studies in non-islet tissues have noted an obesity-correlated increase in OGT or HBP activity in both mice and humans (Buse et al., 1997; Daniels et al., 1996; Lima et al., 2016; Medford et al., 2012) and multiple reports have linked human obesity and/or in vitro saturated fatty acid exposure to increases in GFAT level and activity (Daniels et al., 1996; Hart and Akimoto, 2009; Weigert et al., 2003), the rate limiting enzyme of the HBP. The multi-nutrient-sensitive nature of islet O-GlcNAcylation is further supported by our finding that glucose + palmitate, rather than glucose alone, was most effective for increasing human islet O-GlcNAcylation within a 2-hour timeframe. That this acute exposure was sufficient to do so only in obesity-adapted islets, but not islets from the lower BMI donors, suggests a sensitization or upregulation of HBP flux specific to the context of obesity. Such a mechanism would be useful for differentiating between temporary overconsumption (e.g. 1 week of HFD) and a more prolonged hypernutrientism, which could prevent premature β-cell exhaustion. To this end, it is worth noting that transgenic overexpression of β-cell GFAT produces hyperinsulinemia in mice (Tang et al., 2000).
Islet O-GlcNAcylation levels from more progressively obese mice (18 wks HFD) were diminished relative to controls, despite the persistence of dietary overnutrition and adiposity, strongly suggesting that the observed loss of OGT protein was the culprit. Although the regulatory mechanism behind OGT loss is not known, the OGT-targeting microRNA 7a (Babae et al., 2014), which is biphasically expressed over time in hyperphagic obese db/db mice (Latreille et al., 2014), is an intriguing candidate for future study. In our data, decreased islet O-GlcNAcylation correlated to an absence of insulin secretory potentiation and mimicked the timeframe of a similar study on HFD β-cell adaptation that demarcated the period of secretory potentiation between 2 and 16 weeks (Gupta et al., 2017). Our data is also consistent with previous reports that suppressing O-GlcNAcylation through overexpression of OGA decreases islet and serum insulin levels in young adult mice (Soesanto et al., 2011). The purpose of a counter-regulation to islet O-GlcNAcylation in more progressed obesity is not immediately apparent but could serve as a homeostatic mechanism for β-cell rest, a critical anti-diabetic factor that helps maintain secretory capacity in the face of high insulin demand (Boland et al., 2019).
Interpretation of human islet O-GlcNAcylation patterns was made more complicated by an apparent sexual dimorphism. Human male obesity mimicked the more prolonged HFD treatments in mice, with a significant decrease in islet O-GlcNAcylation and OGT protein levels. Although we do not have data on the dietary or obesity history of these donors, it is reasonable to expect that a BMI over 30 is likely the result of an extended period of nutrient excess. However, female islets were more varied, with several demonstrating an elevation in O-GlcNAcylation correlated to obese status. It is possible that this represents a true sex difference but we also considered that our random samples captured a broader range of the obesity-adaptation timeline, given that females progress more slowly to metabolic decompensation and β-cell failure in response to obesity (Kautzky-Willer et al., 2016). Although circumstantial, this was supported by secretion data from the broader IIDP database that showed a positive correlation between obesity and islet secretion only among female, and not male, donors. As a precaution to overinterpretation, it should be noted that the progressed obesity condition we investigated in mice was performed in female mice only. These studies nevertheless represent a preliminary characterization of islet O-GlcNAcylation in response to in vivo obesity and show that islet O-GlcNAcylation increases in mice in response to HFD-feeding specifically during the timeframe of islet insulin hypersecretion.
A Lipid Specific Role for β-cell OGT Activity
Confirming the requirement of β-cell O-GlcNAcylation for the early hypersecretion, the absence of circulating hyperinsulinemia within the first 3 months of HFD feeding was shown in female mice with a partial loss of OGT+ β-cells (βOGT Het), and in both female and male tmx-induced iβOGT KO mice. Importantly, these mouse models exhibited normal glucose homeostasis under standard chow food. This includes in vitro insulin secretion in βOGT Het islets, which was diminished relative to WT only in the 6-wks HFD-adapted groups. The relevance of OGT activity specifically to a lipid context is also suggested by the βOGT KO transcriptomics. Pathways analysis of differentially expressed genes in SD-derived islets implicates the homeostasis and metabolism of various lipid species (triglycerides, cholesterol, glycosphingolipids) of high relevance to obesity and T2D β-cell pathology (Sharma and Alonso, 2014). Among the altered genes themselves, 57% were bidirectionally regulated by β-cell OGT loss and 8 wks HFD (Motterle et al., 2017). This is an interesting finding in light of the hypothesis put forth by Gupta et al. that HFD adaptation in islets is preceded and regulated by progressive transcriptional waves (Gupta et al., 2017). OGT is known to favor transcription factors (Hart and Akimoto, 2009), many of which (e.g. Pdx1, Hnf1α) fall into the lower molecular weight range that was particular sensitive to obesity-precipitated increases in O-GlcNAcylation. In non-islet tissues, O-GlcNAcylation has been increasingly linked to aspects of intracellular lipid metabolism including the regulation of lipid droplet formation (Keembiyehetty et al., 2011), fatty acid uptake in the heart (Laczy et al., 2011), lipid synthesis and β-oxidation in the liver (Ido-Kitamura et al., 2012; Ruan et al., 2012) and adipocytes (Li et al., 2018; Luo et al., 2007; Yang et al., 2020). The current study supports and extends an emerging role for OGT in lipid sensing and lipid metabolic regulation.
Glucose Stimulated Insulin Secretion in βOGT Loss Islets
Downstream of βOGT loss, we found multiple alterations in the triggering arm of the insulin release pathway. Total islet ATP was increased in βOGT KO islets in response to palmitate or galactose (but not glucose). While our assessment technique primarily detects the relatively stable pool of granular ATP (Detimary et al., 1995), these specific substrates depend on oxidative phosphorylation to generate ATP, which may implicate one of the many OGT-targeted mitochondrial proteins (e.g. Pgc-1α, DRP1, multiple respiratory chain complex proteins (Ruan et al., 2013)). βOGT KO levels of KATP channel subunit SUR1 were reduced by 50%, which is likely to reduce KATP membrane density through impaired channel trafficking out of the ER (Marhfour et al., 2010; Sharma et al., 1999). We recorded a significant elevation in membrane potential in iβOGT KO β-cells relative to WT controls, during basal and stimulating glucose concentrations and in the presence of a KATP channel opener, which is consistent with reduced membrane KATP channel activity (Rorsman and Ashcroft, 2018). However, when we tested islet SUR1 and Kir6.2 protein levels in the inducible model, they were equivalent to WT. This suggests an alternate mechanism for the sustained depolarization, such as depleted ER Ca2+ stores stimulating [Ca2+]i influx (Worley et al., 1994). Although it may be surprising that these pro-triggering changes are concurrent with hypoinsulinemia, we observed the secretory deficit only in response to hyperlipidemia. We found no impairment in SD-adapted GSIS in βOGT KO islets, using an analysis that minimizes known confounds such as β-cell mass or insulin content. It should be noted that β-cells from T2D human donors have been reported to show resting membrane depolarization and reduced KATP channel activity coincident with diminished GSIS (Rorsman and Ashcroft, 2018).
SERCA2 Function is Critical for Palmitate FASIS in β-cell OGT KO Islets
β-cell OGT loss completely abolished the ability of acute palmitate to potentiate islet insulin secretion in either the constitutive or inducible models. One possible explanation is that OGT loss impairs β-cell lipid uptake as the proteins largely responsible for this, lipoprotein lipase (LPL) and CD36, were both downregulated in the βOGT KO transcriptome while CD36 O-GlcNAcylation has been associated with increased fatty acid influx and β-oxidation in the heart (Laczy et al., 2011; Lauzier et al., 2013; Nabeebaccus et al., 2017). Another possibility is impaired lipid signaling through GPR40/FFAR1, as point mutations in this lipid protein receptor selectively eliminate palmitate FASIS while preserving GSIS (Sabrautzki et al., 2017). FFAR1 is Gαq-coupled, which classically transduces ligand-binding to IP3-mediated ER Ca2+ release. But though palmitate increases β-cell cytoplasmic Ca2+, partly through ER Ca2+ release (Kuok et al., 2019), the size and contribution of [Ca2+]ER to the amplification of stimulus-secretion is controversial (Kuok et al., 2019; Mancini and Poitout, 2013). Our own data using CDN1163, an allosteric activator of SERCA2, the Ca2+-ATPase responsible for ER uptake, support the assertion that in SD-treated WT islets, acute potentiation of [Ca2+]ER does not improve palmitate-potentiation of GSIS. Nevertheless, CDN1163 fully rescued palmitate FASIS in iβOGT KO islets and partly improved FASIS in constitutive KO islets, despite their lower SERCA2 protein levels. The surprising impact of SERCA2 activity only on OGT KO FASIS could speak to a minimum required threshold of [Ca2+]ER for the transduction of FASIS, either through direct effects or as a signal for other potentiation mechanisms. SERCA2 was one of the few βOGT KO DEGs that was both bidirectionally regulated by OGT loss/HFD and had been flagged as a putative O-GlcNAcylation target (Pereira et al., 2013; Takada et al., 2012; Trinidad et al., 2012). We confirmed SERCA2 O-GlcNAcylation through immunoprecipitation with the highly-specific pan-O-GlcNAc RL2 antibody in mouse β-cells (Min6) and primary human islets. The difference in SERCA2 protein levels between the two βOGT-loss models suggests that acute O-GlcNAcylation is more likely to regulate SERCA2 function. YinOYang prediction software (Gupta and Brunak, 2002) shows mouse SERCA2a and 2b (the predominant isoforms in the heart and β-cell, respectively) to have 3 putative O-GlcNAc sites in common: T897, T358 and T648. T897 is located within the ER membrane and unlikely to be accessible to cytoplasmic OGT (Horakova et al., 2013; Vangheluwe, 2005). T358 is located near a Ca2+ binding pocket, based on a recent crystal structure of SERCA2a in a pig heart (6HXB) (Sitsel et al., 2019), making any potential O-GlcNAcylation event well positioned to regulate SERCA2 function through Ca2+ binding. The other putative O-GlcNAcylated residue, T648 is a known phosphorylation site (Zhao et al., 2011) and thus a likely target for functionally relevant post-translational regulation of the protein. Future site-directed mutagenesis studies will be helpful in illuminating the exact locations and consequences of SERCA2 O-GlcNAcylation in the β-cell. Nevertheless, our current findings are consistent with a previous report that also implicated SERCA2 in mediating “β-cell compensatory response to diet-induced obesity” (Tong et al., 2016), including HFD-specific deficits in GSIS downstream of β-cell SERCA2 reduction (Tong et al., 2016).
Summary
We found evidence to suggest that hyperlipidemia-sensitive protein O-GlcNAcylation in β-cells, which was biphasically-regulated by HFD and required for hyperlipidemia-precipitated hyperinsulinemia in vitro and in vivo in mice, may be a missing link between obesity and hypersecretory β-cell adaptation. These results elucidate a physiological role for protein O-GlcNAcylation in mediating the relationship between persistent overnutrition and compensatory metabolic adaptation, specifically highlighting the therapeutic potential of ER Ca2+-ATPase and β-cell OGT-target SERCA2.
STAR METHODS
RESOURCE AVAILABILITY
Lead Contact
Further information and requests for resources and reagents should be directed to and will be fulfilled by the Lead Contact, Emilyn Alejandro (ealejand@umn.edu).
Materials Availability
There are no new animal lines or reagents generated in the current study.
Data and Code Availability
The accession number for the RNA-sequencing data reported in this paper is GEO:GSE144760. Raw western blotting data are deposited through Mendeley Data, Reserved DOI: 10.17632/wswk5z8yvb.1
EXPERIMENTAL MODEL AND SUBJECT DETAILS
Mice
To generate βOGT Het (Rip-cre; Ogt f/+) and βOGT KO (Rip-cre; Ogt f/f or f/y) or iβOGT KO (Mip-CreERTM; Ogt f/f or f/y) mice, Rip-cre (Herrera, 2000) or Mip-creERTM (Wicksteed et al., 2010) containing male mice were bred to Ogt f/f females as described previously (Alejandro et al., 2015). Control mice were a mixture of Cre- littermates and equivalently-aged Ogt f/f or Ogt f/+ offspring on a C57Bl/6J background. For induction of the Mip-creERTM mice, young adult iβOGT KO mice and controls received 4 days of 8 mL/kg tamoxifen in corn oil by oral gavage followed by at least 4 wks of rest before testing. An early single cohort experiment used 5 days of ip tamoxifen (10 mg/mL). All offspring were genotyped before weaning with a subset re-confirmed after harvest (see resource table for genotyping primer sequences). Mice were housed on a 14:10 light:dark cycle with ad libitum access to standard diet or high-fat diet (HFD, D12492) rodent chow with 60% kcal fat (starting at 2–3 months of age). Mice harvested for islet isolation were tested for body weight, blood glucose and had facial vein blood samples collected at the time of harvest. Mice in figure 3 and supplemental figure 3 and 4 received consecutive in vivo assessments with timing as indicated in the figure legends. For most data, sex of the mice is indicated in the figure legend and/or on the graph labels (F=female, M=male). Additionally, in figure 1 and S1, female data is in triangles and male in circles. RNAseq data was performed on islets from female mice only. For in vitro experiments, if sex is not indicated in the x-axis labels, data was combined from male and female mice. All animal procedures were approved by the Institutional Animal Care and Use Committee at the University of Minnesota.
Human Islets
Islets from male and female donors, without diabetes and with either a lean body mass index (BMI ≤25 kg/m2) or a body mass diagnostic for obesity (BMI ≥ 30 kg/m2), with a minimum of 80% purity and viability, were acquired fresh or frozen from the Integrated Islet Distribution Program (IIDP) and rested overnight before use. One pair of lean-adapted and obesity-adapted female islets was obtained from the University of Alberta Islet Core, Alberta Diabetes Institute, Edmonton. These islets were cryopreserved in DMSO and thawed into CMRL media before overnight rest and harvesting, according to the protocol provided by Alberta. Donor characteristics from experimental islets are listed in Table S1. Additional information from IIDP donors and islets, including those used and not used for the blots in this study, are in Table S2. This information was selected from all available non-diabetic donors (exclusion by diagnosis or reported HbA1c > 6.5) posted to the IIDP website at the time of the table’s composition. Islet stimulation index (SI) was derived from the IIDP or Alberta online databases and was provided by each islet isolation institution under the procedural guidelines provided by the program.
Cell lines
Min6 cells were received as a gift from Dr. Peter Arvan (University of Michigan) (Arunagiri et al., 2018). The sex of the mouse these cells were derived from was not provided (Miyazaki et al., 1990) but we have authenticated that these cells they express pancreatic β-cell genes such as Ins1/Ins2 and Pdx1 as well as insulin and Pdx1 protein by staining. They were maintained on tissue culture treated plates in Dulbecco’s modified Eagle’s medium-Glutamax media supplemented with 10% fetal bovine serum and penicillin/L-streptomycin, incubated at 37°C, 5% CO2. Cells were split at ~90% confluence using a 0.25% trypsin solution. Harvested cells were washed twice in PBS, snap frozen on dry ice and stored at −80°C until use.
METHOD DETAILS
In Vivo Mouse Studies
Body weight and random blood glucose were measured at weekly intervals, unless otherwise described in the figure legend. Glucose was assessed from a tail vein sample with a handheld glucometer. Facial vein blood was collected approximately every 3 weeks into anticoagulant-coated or EDTA-coated (1 cohort, Figure S3I) microcapillary tubes and centrifuged to obtain serum or plasma, respectively. This was stored frozen at −80°C then assessed for insulin concentration using an ALPCO Ultrasensitive mouse insulin ELISA, per kit instructions. Analysis was done by 5-parameter logistic fit utilizing the MyAssays software. Glucose tolerance testing was done by fasting the mice overnight (14 hrs) and measuring blood glucose before and after (30, 60, 120 minutes) a 2 g/kg intraperitoneal (ip) injection of a 50% dextrose solution. Insulin sensitivity was assessed following a 6-hr fast and similar blood glucose measurements before and after a 0.75 U/kg dose of insulin in 0.9% saline (0.1 U/mL). Glucose-stimulated insulin secretion (GSIS) was determined from the insulin levels of facial vein serum samples collected after an overnight fast and 2 minutes after a 3 g/kg ip injection of dextrose.Mice were randomly assigned to dietary condition but excluded from all datasets if they showed evidence of malocclusion or excessive fight wounds.
Mouse Islet Studies
Islet Isolation –
Exsanguinated pancreata were clamped at the ampulla and perfused through the common bile duct with cold Collagenase P in HBSS. The inflated pancreas was dissected from the surrounding viscera and digested by 8–15 minutes incubation in a 37°C water bath with occasional manual agitation. Digestion was stopped with HBSS (+ Ca2+, Mg2+) containing 2% FBS and the pellet filtered through a tea strainer to remove large debris and a 70 uM filter to separate islets from acinar. Captured islets were washed off the screen and handpicked clean into warm RPMI media then rested overnight in a humidified 37°C incubator with 5% CO2 before testing or collection.
In vitro GSIS –
batches of 10 size-matched islets were pre-incubated at 37°C in Krebs Buffer (114.5 NaCl, 4.7 KCl, 1.2 KH2PO4, 1.1 MgSO4-7H2O, 8 HEPES, 1 CaCl2-2H2O, 10 NaHCO3 and 0.08% w/v BSA) with 2 mM glucose (LG) for 2 hours then transferred into Millipore cell inserts in a 24-well plate. The transfer solution was replaced with fresh LG buffer and incubated for 30 minutes before collection of the supernatant and transfer into sequential incubations of high glucose (HG, 16.7 mM, 30 min), LG (15 min, discard) and KCl (30 mM, 15 min). Islets screens were collected into 500 uL lysis buffer (10% RIPA + 1% protease inhibitor cocktail). For some in vitro GSIS experiments, 100 μM palmitate (pre-complexed 6:1 to BSA) and/or CDN1163 (10 uM in DMSO) were added to pre-incubation and experimental solutions, with an equivalent concentration of BSA or DMSO in control solutions. Islets were tested in triplicate (10 islets per well) with replicates eliminated where LG>HG or HG>KCl, total recovered DNA < 10 ng or where experimental notes indicated errors or the appearance of low-quality islets. Data from replicates that did not include a value for each condition in the given analysis was not used. Unless otherwise indicated, technical replicates were averaged per mouse before data analysis. Due to low yield, βOGT KO experiments were run with 1–2 wells per condition with a minimum of 8 islets per well. Incubates were kept frozen at −20°C for up to 1 week or - 80°C until testing. Insulin was assessed as described; dilutions were made into Krebs.
Drug Preparation –
Palmitate was prepared by first creating a 100 mM stock solution in 65 mM NaOH, heated to 70°C in a water bath to achieve dissolution. A 20% solution of fatty acid free BSA (in Krebs) was pre-warmed to 37°C before mixing in a 6:1 ratio of palmitate to BSA and allowed to sit at 37°C for 30 minutes before aliquoting and storing at −20°C. Palmitate solution (15.25 mM) was sterile-filtered before use. CDN1163 was prepared in DMSO and briefly heated to 37°C for dissolution before use. Glucose solutions were all prepared from the same sterile-filtered 1M stock on the day of use.
Insulin Content –
Islet screens were sonicated, in a cold room or on ice, in lysis buffer for 2×15s cycles of 1.5s on/0.5s off at 20% amplitude. Samples were diluted in ELISA wash buffer to fit the standard curve. Content was normalized to DNA as determined from undiluted lysate using a PicoGreen dsDNA assay, per kit instructions. Fluorescence (480/520) was read on the BioTek plate reader and calculated by a linear regression analysis in Excel of an in-plate stock dilution ladder. Insulin content from post-GSIS islets includes both secreted insulin and islet insulin content at the end of the test.
ATP –
For βOGT KO islets, ATP content (3×10 islets per mouse per condition) was assessed by bioluminescence after a 30-minute pre-incubation in Krebs buffer followed by 1 hour in 5 mM galactose, 25 mM glucose or 100 μM palmitate. Post-HFD islets were assessed following a 4-hour test incubation in the same conditions (βOGT Het) or substituting a 2 mM low glucose condition instead of palmitate (iβOGT KO), per the ATP detection portion of a Promega kit. ATP content values were normalized to DNA.
Human Islet Studies
Based on preliminary data, human islet O-GlcNAcylation signals, as detected by RL2 western blot, faded with time and repeated handling of the samples. To avoid this in our experiments, single pairs of lean-BMI-adapted and obese-BMI-adapted islets within each gender category were accepted within close temporal proximity, received fresh whenever possible, and run as soon as possible. Infrequent availability of islets matching inclusion criteria resulted in single pairs being run on a blot and normalized to the single lean control of each pair before group averaging all pairs. To test nutrient-regulation of O-GlcNAcylation, a selection of fresh male islets islets were washed in PBS and then treated for 2-hours in 3 mM glucose, 16.7 mM glucose or either of these in combination with 100 μM palmitate prepared in Krebs solution before harvesting. For analysis of basal O-GlcNAcylation patterns, low-glucose treated islets were included with frozen or untreated islet samples.To avoid the potential influence of hyperglycemia on islet O-GlcNAcylation, islet offers were rejected if donors showed high HbA1c or blood glucose during hospitalization, regardless of diabetic classification. Decisions on islet offer acceptance and pairing were made prior to acquiring SI secretion data.
Western Blot
Isolated islets were sonicated (3×1s, 10% amplitude) in 60 uL RIPA lysis buffer with protease and phosphatase inhibitors. The lysates were spun down at 10,000 rpm at 4°C to remove cell debris. Lysate total protein concentration was determined by Pierce BCA Protein Assay kit, per manufacturer instruction. Lysate samples containing 20–30ug of protein were boiled for 5 minutes at 95°C in Laemmli Buffer (including 2-mercaptoethanol) before loading onto a homemade 8–10% acrylamide SDS-PAGE gel. Gels were run for up to 2 hours at 100–150 V then transferred onto a PVDF membrane for 2 hours at 0.24 A in ice-cold Tris-glycine transfer buffer with 20% methanol. The membrane was blocked for 60 minutes in 5% non-fat milk in TBST and incubated overnight, rocking, at 4 °C in the primary antibody: RL-2, O-GlcNAc Transferase (OGT), O-GlcNAcase (OGA), β-actin, vinculin, Kir6.2, SUR1, SERCA2 prepared in TBS with 0.02% sodium azide (source identification and dilutions listed in the resources table). After washing (3×10 minutes on an orbital shaker), the membranes were probed using HRP-conjugated anti-mouse or anti-rabbit IgG. After an additional washing, chemiluminescent reactions were performed using either SuperSignal West Pico PLUS substrate (ThermoScientific) or SuperSignal West Dura substrate (ThermoScientific), according to manufacturer’s directions, and the membrane was imaged on ChemiDoc MP Imaging System (BioRad). The membranes were stripped for reuse using Restore™ PLUS Western Blot Stripping Buffer for 15 minutes before washing and blocking. The protein bands were quantified using densitometry analysis via ImageJ (NIH). Except for blot development, all incubations were done on an orbital shaker.
Immunostaining
Freshly harvested pancreata were fixed overnight in 3.7% formalin and transferred to 70% ethanol at 4°C until processing. Pancreatic tissues were embedded in paraffin and sectioned into at least 5 series of 5 μm thick slices every 200 μm through the depth of the pancreas using a Leica RM2125 RTS vibratome. Sections for staining were deparaffinized, underwent antigen retrieval in 0.01 M citrate solution for 8 minutes at 95°C, permeabilized with 0.1% Triton X and blocked with 3% goat serum. These were then incubated with primary antibodies (insulin, RL2, DAPI) overnight at 4°C. After washing, sections were incubated at 37°C in Cy3- or FITC-conjugated secondary antibodies for 90 minutes. DAPI mounting media was applied with the coverslip. Standard fluorescent images were captured with a Nikon Eclipse Ni-E microscope equipped with a motorized stage. β-cell mass was determined as previously described (Lockridge, 2016) from the ratio of insulin-positive area over total pancreas area (assessed in FIJI), cumulative from 5 sections (Insulin/DAPI stained) taken throughout the depth of the pancreas multiplied by pancreas weight taken at the time of harvest.
Gene Expression
RNA was isolated from islets (stored in RNAlater) using the RNeasy plus micro kit following manufacturer’s instruction. For RNA sequencing, DNase treatment was included in the RNA isolation and integrity (>8) was validated using an Agilent 2200 Tapestation. During sequencing, 125bp FastQ paired-end reads (n=16.1* Million per sample) were trimmed using Trimmomatic (v 0.33) enabled with the optional “-q” option; 3bp sliding-window trimming from 3’ end requiring minimum Q30. Quality control checks on raw sequence data for each sample were performed with FastQC. Read mapping was performed via Hisat2 (v2.0.2) using the UCSC mouse genome (mm10) as reference. Gene quantification was done via Cuffquant for FPKM values and Feature Counts for raw read counts. Differentially expressed genes were identified using the edgeR (negative binomial) feature in CLC Genomics Workbench using raw read counts. The generated list was filtered based on a minimum 1.5x absolute fold change and FDR corrected p < 0.05. Pathway and upstream regulator analysis was performed using Ingenuity Pathway Analysis and the DAVID online database (Huang da et al., 2009). Dataset overlap was assessed and diagrammed using Venny 2.1 (Oliveros, J.C. (2007–2015) Venny. An interactive tool for comparing lists with Venn’s diagrams. https://bioinfogp.cnb.csic.ed/tools/venny/index.html). Details of specific analyses are described in the results and figure legends.
Electrophysiology
For dispersed β-cell recordings, islets were dispersed by brief digestion in trypsin (0.25%) with manual agitation, washed and plated onto glass cover slips in FBS-free media for 30 minutes before restoring complete media and resting overnight in a 37°C incubator. For intact islet preparations, islets were held in place with a holding pipet and surface cells were patched using a second recording electrode. Membrane potentials of individual β-cells were measured using perforated patch (amphotericin-B) current-clamp recordings. Following giga-seal formation, series resistance and cell capacitance were monitored for membrane poration. Whole-cell recordings were made using an Axon Instruments Multiclamp 700B, digitized with a Digidata 1320A, and analyzed in P-clamp and Origin software. β-cell identity was confirmed by a characteristic depolarization response to 12 mM glucose. The extracellular solution (containing, in mM: 115 NaCl, 3 CaCl2, 5 KCl, 2 MgCl2, 10 HEPES, 3 or 12 glucose or 100 uM diazoxide and mannitol for osmolarity, pH 7.4 with NaOH) was gravity-perfused through a custom chamber at a rate of 1.5–2 ml/min. Patch electrodes, with tip resistances of 3–8 MΩ, were pulled from borosilicate glass using a Sutter P-97 puller. The perforated patch intracellular solution contained (in mM): 76 K2SO4, 10 NaCl, 10 KCl, 1 Mg2Cl2, 5 HEPES, 0.5 EGTA and 0.25 mg/ml of amphotericin B, pH7.3 with KOH.
Immunoprecipitation
Min6 cells were grown to confluency and treated for 12 hours with 10 uM PUGNAC before harvesting as described. Human islets were cultured for 6 hours in 16.7 mM glucose, 100 uM palmitate and PUGNAC in Krebs solution before washing with PBS, snap-freezing and storing at −80ºC until use. 3 plates of Min6 cells and ~15,000 human islets (from 8 donors with even mix of obese or lean BMI and male or female gender) were combined for each experiment and lysed with an NP-40 based lysis/wash buffer (25 mM Tris Base, 150 mM NaCl, 1 mM EDTA, 1% Igepal, 4% Glycerol, 1 uM PUGNAC, protease inhibitor cocktail, pH 7.4) by rotating at 4ºC for 1 hour and spinning at 13,000 x g to pellet. After removing the supernatant, the cell pellet was lysed a second time using sonication (20s, 20% amplitude, 2 sec on/off) to ensure maximal protein recovery. Pierce BCA protein quantitation kit was used to prepare 4× 1000 ug Min6 lysates and 2× 850 ug human lysates, pre-cleared for 1 hour with Pierce protein A/G magnetic beads and then incubated with RL2, SERCA2 or Mouse IgG antibody (1 ug / 100 ug protein) overnight, rotating, at 4ºC. Lysates were then conjugated to 25 uL of beads per reaction for 1 hour before washing 2x in lysis/wash buffer, 2x in RIPA buffer, 1x in ddH2O. Precipitated protein was eluted off the beads by heating in 2x Laemmli Buffer (LB) for 10 minutes at 60ºC and then a second volume for 5 minutes at 95ºC. Samples were diluted to 1x LB with water before loading onto an 8% SDS-PAGE running gel. In addition to the western blot steps described, the gel was run for 2.5 hours in cold water and the transfer was done at a fixed 100V.A 10-minute ice-cold equilibration in transfer buffer was added before packing the gel with the membrane.
QUANTIFICATION AND STATISTICAL ANALYSIS
Data with multiple endpoints were analyzed by 1-way or 2-way ANOVA (repeated measures if applicable) with post-hoc multiple comparisons of significant factors, as recommended by Prism unless otherwise described. For the human islet analysis, comparison of western blot protein signals between low and high BMI groups was done for each band weight, their sum (total RL2) or OGT using one-sample t-tests. Single endpoint comparisons were analyzed by 2-tailed t-test unless otherwise indicated, with multiplicity correction for multiple pairwise comparisons. Threshold for statistical significance was p<0.05. N numbers and specific analyses are described in the legends. All statistical analyses were performed in GraphPad Prism. Data are represented as either scatter dot blots or box-whiskers plots with boxes showing the min to max range of the dataset. Averages and standard error of the mean are given by the error bars.
Supplementary Material
Supplemental to Figure 4. The gene expression profiles of genes with significantly altered expression are shown for the first (left, WT1 vs. KO1) and second (right, WT3 vs. KO3) RNAseq runs. Lists of targets common to or independent for each run are listed. A final list of 284 genes is shown that was also filtered through an analysis that pooled data from the first and second runs. Only genes that were significant in all three analyses are in the final list.
Supplemental to Figure 4. Upstream regulators were predicted by Ingenuity Pathways Analysis (IPA), restricted to pancreatic tissue and islet cell lines, based on the 284 differentially expressed genes identified in Table S3. Numbers listed in “Putative O-GlcNAcylation Regulation” list the PMIDs of the literature source(s) describing O-GlcNAcylation status and predicted direction of effect, if any. “Indirect” indicates that the O-GlcNAcylation referenced and described is not on the target protein listed but on a closely associated protein (e.g. an accessory protein, binding partner or upstream transcription factor) whose O-GlcNAcylation status was directly and strongly correlated to the activity/level of the protein of interest in the listed source.
Supplemental to Table 1. Islet genes are listed and described that were differentially expressed in the current study and in the transcriptomics database published by Motterle et al. comparing islets isolated from mice after standard diet or 8 weeks of HFD. “# OGT Contacts” refers to the number of IPA-identified upstream regulator proteins that were found to be regulated by O-GlcNAcylation plus any O-GlcNAcylation targets on the gene product itself. Genes encoding proteins that have been proposed as O-GlcNAcylated are underlined. Arrows refer to the direction of gene expression change after β-cell OGT loss or 8 weeks HFD, relative to controls, as reported by our RNAseq or by Motterle et al, respectively. Fold-change and p-values characterize the same relationships. Blue indicates decreased expression and red, increased expression.
Acknowledgements
We thank Drs. David Bernlohr, Ernesto Bernal-Mizrachi, James D. Johnson, Alessandro Bartolomucci and Robert Sorenson for feedback and discussion and Dr. Ron Regal for consultation on the analysis of human islet data. We thank Mr. Tom McBrien, Daniel Baumann, Brian Akhaphong and Ms. Kinsley Kehlenbeck and Alicia Wong for technical support. Microscope and imaging support were provided by the University of Minnesota Imaging Center and the Department of Integrative Biology and Physiology. This work was supported by National Institutes of Health Grant NIDDK (K01-DK-103823, R21-DK-112144, R03-DK114465 and R01 DK115720 to EUA and 1F31DK113694 to AL). Human pancreatic islets were provided by the NIDDK-funded Integrated Islet Distribution Program (IIDP) at City of Hope, NIH Grant # 2UC4DK098085.
Footnotes
Declaration of Interests - The authors have declared that no conflict of interest exists.
REFERENCES
- Alejandro EU, Bozadjieva N, Kumusoglu D, Abdulhamid S, Levine H, Haataja L, Vadrevu S, Satin LS, Arvan P, and Bernal-Mizrachi E. (2015). Disruption of O-linked N-Acetylglucosamine Signaling Induces ER Stress and beta Cell Failure. Cell Rep 13, 2527–2538. [DOI] [PMC free article] [PubMed] [Google Scholar]
- Arunagiri A, Haataja L, Cunningham CN, Shrestha N, Tsai B, Qi L, Liu M, and Arvan P. (2018). Misfolded proinsulin in the endoplasmic reticulum during development of beta cell failure in diabetes. Ann N Y Acad Sci 1418, 5–19. [DOI] [PMC free article] [PubMed] [Google Scholar]
- Babae N, Bourajjaj M, Liu Y, Van Beijnum J, Cerisoli F, Scaria P, Verheul M, Van Berkel M, Pieters E, Van Haastert R, et al. (2014). Systemic miRNA-7 delivery inhibits tumor angiogenesis and growth in murine xenograft glioblastoma. Oncotarget 5, 6687–6700. [DOI] [PMC free article] [PubMed] [Google Scholar]
- Boland BB, Brown C Jr., Boland ML, Cann J, Sulikowski M, Hansen G, Gronlund RV, King W, Rondinone C, Trevaskis J, et al. (2019). Pancreatic beta-Cell Rest Replenishes Insulin Secretory Capacity and Attenuates Diabetes in an Extreme Model of Obese Type 2 Diabetes. Diabetes 68, 131–140. [DOI] [PubMed] [Google Scholar]
- Busch AK, Cordery D, Denyer GS, and Biden TJ (2002). Expression profiling of palmitate- and oleate-regulated genes provides novel insights into the effects of chronic lipid exposure on pancreatic beta-cell function. Diabetes 51, 977–987. [DOI] [PubMed] [Google Scholar]
- Buse MG, Robinson KA, Gettys TW, McMahon EG, and Gulve EA (1997). Increased activity of the hexosamine synthesis pathway in muscles of insulin-resistant ob/ob mice. Am J Physiol 272, E1080–1088. [DOI] [PubMed] [Google Scholar]
- Chatzigeorgiou A, Halapas A, Kalafatakis K, and Kamper E. (2009). The use of animal models in the study of diabetes mellitus. In Vivo 23, 245–258. [PubMed] [Google Scholar]
- Chiaradonna F, Ricciardiello F, and Palorini R. (2018). The Nutrient-Sensing Hexosamine Biosynthetic Pathway as the Hub of Cancer Metabolic Rewiring. Cells 7. [DOI] [PMC free article] [PubMed] [Google Scholar]
- Daniels MC, Ciaraldi TP, Nikoulina S, Henry RR, and McClain DA (1996). Glutamine:fructose-6-phosphate amidotransferase activity in cultured human skeletal muscle cells: relationship to glucose disposal rate in control and non-insulin-dependent diabetes mellitus subjects and regulation by glucose and insulin. J Clin Invest 97, 1235–1241. [DOI] [PMC free article] [PubMed] [Google Scholar]
- DeFronzo RA, Eldor R, and Abdul-Ghani M. (2013). Pathophysiologic approach to therapy in patients with newly diagnosed type 2 diabetes. Diabetes Care 36 Suppl 2, S127–138. [DOI] [PMC free article] [PubMed] [Google Scholar]
- Detimary P, Jonas JC, and Henquin JC (1995). Possible links between glucose-induced changes in the energy state of pancreatic B cells and insulin release. Unmasking by decreasing a stable pool of adenine nucleotides in mouse islets. J Clin Invest 96, 1738–1745. [DOI] [PMC free article] [PubMed] [Google Scholar]
- Ducheix S, Magre J, Cariou B, and Prieur X. (2018). Chronic O-GlcNAcylation and Diabetic Cardiomyopathy: The Bitterness of Glucose. Front Endocrinol (Lausanne) 9, 642. [DOI] [PMC free article] [PubMed] [Google Scholar]
- Duggirala R, Blangero J, Almasy L, Dyer TD, Williams KL, Leach RJ, O’Connell P, and Stern MP (1999). Linkage of type 2 diabetes mellitus and of age at onset to a genetic location on chromosome 10q in Mexican Americans. Am J Hum Genet 64, 1127–1140. [DOI] [PMC free article] [PubMed] [Google Scholar]
- Fardini Y, Dehennaut V, Lefebvre T, and Issad T. (2013). O-GlcNAcylation: A New Cancer Hallmark? Front Endocrinol (Lausanne) 4, 99. [DOI] [PMC free article] [PubMed] [Google Scholar]
- Groebe K, Cen J, Schvartz D, Sargsyan E, Chowdhury A, Roomp K, Schneider R, Alderborn A, Sanchez JC, and Bergsten P. (2018). Palmitate-Induced Insulin Hypersecretion and Later Secretory Decline Associated with Changes in Protein Expression Patterns in Human Pancreatic Islets. J Proteome Res 17, 3824–3836. [DOI] [PubMed] [Google Scholar]
- Gupta D, Jetton TL, LaRock K, Monga N, Satish B, Lausier J, Peshavaria M, and Leahy JL (2017). Temporal characterization of beta cell-adaptive and -maladaptive mechanisms during chronic high-fat feeding in C57BL/6NTac mice. J Biol Chem 292, 12449–12459. [DOI] [PMC free article] [PubMed] [Google Scholar]
- Gupta R, and Brunak S. (2002). Prediction of glycosylation across the human proteome and the correlation to protein function. Pac Symp Biocomput, 310–322. [PubMed] [Google Scholar]
- Hanover JA, Lai Z, Lee G, Lubas WA, and Sato SM (1999). Elevated O-linked N-acetylglucosamine metabolism in pancreatic beta-cells. Arch Biochem Biophys 362, 38–45. [DOI] [PubMed] [Google Scholar]
- Hart GW, and Akimoto Y. (2009). The O-GlcNAc Modification. In Essentials of Glycobiology. nd, Varki A, Cummings RD, Esko JD, Freeze HH, Stanley P, Bertozzi CR, Hart GW, and Etzler ME, eds. (Cold Spring; Harbor (NY)). [PubMed] [Google Scholar]
- Herrera PL (2000). Adult insulin- and glucagon-producing cells differentiate from two independent cell lineages. Development 127, 2317–2322. [DOI] [PubMed] [Google Scholar]
- Huang da W, Sherman BT, and Lempicki RA (2009). Systematic and integrative analysis of large gene lists using DAVID bioinformatics resources. Nat Protoc 4, 44–57. [DOI] [PubMed] [Google Scholar]
- Ido-Kitamura Y, Sasaki T, Kobayashi M, Kim HJ, Lee YS, Kikuchi O, Yokota-Hashimoto H, Iizuka K, Accili D, and Kitamura T. (2012). Hepatic FoxO1 integrates glucose utilization and lipid synthesis through regulation of Chrebp O-glycosylation. PLoS One 7, e47231. [DOI] [PMC free article] [PubMed] [Google Scholar]
- Kang S, Dahl R, Hsieh W, Shin A, Zsebo KM, Buettner C, Hajjar RJ, and Lebeche D. (2016). Small Molecular Allosteric Activator of the Sarco/Endoplasmic Reticulum Ca2+-ATPase (SERCA) Attenuates Diabetes and Metabolic Disorders. J Biol Chem 291, 5185–5198. [DOI] [PMC free article] [PubMed] [Google Scholar]
- Kautzky-Willer A, Harreiter J, and Pacini G. (2016). Sex and Gender Differences in Risk, Pathophysiology and Complications of Type 2 Diabetes Mellitus. Endocr Rev 37, 278–316. [DOI] [PMC free article] [PubMed] [Google Scholar]
- Keembiyehetty CN, Krzeslak A, Love DC, and Hanover JA (2011). A lipid-droplet-targeted O-GlcNAcase isoform is a key regulator of the proteasome. J Cell Sci 124, 2851–2860. [DOI] [PMC free article] [PubMed] [Google Scholar]
- Kuok IT, Rountree AM, Jung SR, and Sweet IR (2019). Palmitate is not an effective fuel for pancreatic islets and amplifies insulin secretion independent of calcium release from endoplasmic reticulum. Islets 11, 51–64. [DOI] [PMC free article] [PubMed] [Google Scholar]
- Laczy B, Fulop N, Onay-Besikci A, Des Rosiers C, and Chatham JC (2011). Acute regulation of cardiac metabolism by the hexosamine biosynthesis pathway and protein O-GlcNAcylation. PLoS One 6, e18417. [DOI] [PMC free article] [PubMed] [Google Scholar]
- Latreille M, Hausser J, Stutzer I, Zhang Q, Hastoy B, Gargani S, Kerr-Conte J, Pattou F, Zavolan M, Esguerra JLS, et al. (2014). MicroRNA-7a regulates pancreatic β cell function. J Clin Invest 124, 2722–2735. [DOI] [PMC free article] [PubMed] [Google Scholar]
- Lauzier B, Vaillant F, Merlen C, Gelinas R, Bouchard B, Rivard ME, Labarthe F, Dolinsky VW, Dyck JR, Allen BG, et al. (2013). Metabolic effects of glutamine on the heart: anaplerosis versus the hexosamine biosynthetic pathway. J Mol Cell Cardiol 55, 92–100. [DOI] [PMC free article] [PubMed] [Google Scholar]
- Lehman DM, Fu DJ, Freeman AB, Hunt KJ, Leach RJ, Johnson-Pais T, Hamlington J, Dyer TD, Arya R, Abboud H, et al. (2005). A single nucleotide polymorphism in MGEA5 encoding O-GlcNAc-selective N-acetyl-beta-D glucosaminidase is associated with type 2 diabetes in Mexican Americans. Diabetes 54, 1214–1221. [DOI] [PubMed] [Google Scholar]
- Li MD, Vera NB, Yang Y, Zhang B, Ni W, Ziso-Qejvanaj E, Ding S, Zhang K, Yin R, Wang S, et al. (2018). Adipocyte OGT governs diet-induced hyperphagia and obesity. Nat Commun 9, 5103. [DOI] [PMC free article] [PubMed] [Google Scholar]
- Lima VV, Giachini FR, Matsumoto T, Li W, Bressan AF, Chawla D, Webb RC, Ergul A, and Tostes RC (2016). High-fat diet increases O-GlcNAc levels in cerebral arteries: a link to vascular dysfunction associated with hyperlipidaemia/obesity? Clin Sci (Lond) 130, 871–880. [DOI] [PMC free article] [PubMed] [Google Scholar]
- Luo B, Parker GJ, Cooksey RC, Soesanto Y, Evans M, Jones D, and McClain DA (2007). Chronic hexosamine flux stimulates fatty acid oxidation by activating AMP-activated protein kinase in adipocytes. J Biol Chem 282, 7172–7180. [DOI] [PubMed] [Google Scholar]
- Ma J, and Hart GW (2013). Protein O-GlcNAcylation in diabetes and diabetic complications. Expert Rev Proteomics 10, 365–380. [DOI] [PMC free article] [PubMed] [Google Scholar]
- Mancini AD, and Poitout V. (2013). The fatty acid receptor FFA1/GPR40 a decade later: how much do we know? Trends Endocrinol Metab 24, 398–407. [DOI] [PubMed] [Google Scholar]
- Marhfour I, Jonas JC, Marchandise J, Lefevre A, Rahier J, Sempoux C, and Guiot Y. (2010). Endoplasmic reticulum accumulation of Kir6.2 without activation of ER stress response in islet cells from adult Sur1 knockout mice. Cell Tissue Res 340, 335–346. [DOI] [PubMed] [Google Scholar]
- Medford HM, Chatham JC, and Marsh SA (2012). Chronic ingestion of a Western diet increases O-linked-beta-N-acetylglucosamine (O-GlcNAc) protein modification in the rat heart. Life Sci 90, 883–888. [DOI] [PMC free article] [PubMed] [Google Scholar]
- Miyazaki J, Araki K, Yamato E, Ikegami H, Asano T, Shibasaki Y, Oka Y, and Yamamura K. (1990). Establishment of a pancreatic beta cell line that retains glucose-inducible insulin secretion: special reference to expression of glucose transporter isoforms. Endocrinology 127, 126–132. [DOI] [PubMed] [Google Scholar]
- Mosser RE, Maulis MF, Moulle VS, Dunn JC, Carboneau BA, Arasi K, Pappan K, Poitout V, and Gannon M. (2015). High-fat diet-induced beta-cell proliferation occurs prior to insulin resistance in C57Bl/6J male mice. Am J Physiol Endocrinol Metab 308, E573–582. [DOI] [PMC free article] [PubMed] [Google Scholar]
- Motterle A, Gattesco S, Peyot ML, Esguerra JLS, Gomez-Ruiz A, Laybutt DR, Gilon P, Burdet F, Ibberson M, Eliasson L, et al. (2017). Identification of islet-enriched long non-coding RNAs contributing to beta-cell failure in type 2 diabetes. Mol Metab 6, 1407–1418. [DOI] [PMC free article] [PubMed] [Google Scholar]
- Nabeebaccus AA, Zoccarato A, Hafstad AD, Santos CX, Aasum E, Brewer AC, Zhang M, Beretta M, Yin X, West JA, et al. (2017). Nox4 reprograms cardiac substrate metabolism via protein O-GlcNAcylation to enhance stress adaptation. JCI Insight 2. [DOI] [PMC free article] [PubMed] [Google Scholar]
- Pereira RO, Wende AR, Olsen C, Soto J, Rawlings T, Zhu Y, Anderson SM, and Abel ED (2013). Inducible overexpression of GLUT1 prevents mitochondrial dysfunction and attenuates structural remodeling in pressure overload but does not prevent left ventricular dysfunction. J Am Heart Assoc 2, e000301. [DOI] [PMC free article] [PubMed] [Google Scholar]
- Rorsman P, and Ashcroft FM (2018). Pancreatic beta-Cell Electrical Activity and Insulin Secretion: Of Mice and Men. Physiol Rev 98, 117–214. [DOI] [PMC free article] [PubMed] [Google Scholar]
- Ruan HB, Han X, Li MD, Singh JP, Qian K, Azarhoush S, Zhao L, Bennett AM, Samuel VT, Wu J, et al. (2012). O-GlcNAc transferase/host cell factor C1 complex regulates gluconeogenesis by modulating PGC-1alpha stability. Cell Metab 16, 226–237. [DOI] [PMC free article] [PubMed] [Google Scholar]
- Ruan HB, Singh JP, Li MD, Wu J, and Yang X. (2013). Cracking the O-GlcNAc code in metabolism. Trends Endocrinol Metab 24, 301–309. [DOI] [PMC free article] [PubMed] [Google Scholar]
- Sabrautzki S, Kaiser G, Przemeck GKH, Gerst F, Lorza-Gil E, Panse M, Sartorius T, Hoene M, Marschall S, Haring HU, et al. (2017). Point mutation of Ffar1 abrogates fatty acid-dependent insulin secretion, but protects against HFD-induced glucose intolerance. Mol Metab 6, 1304–1312. [DOI] [PMC free article] [PubMed] [Google Scholar]
- Sharma N, Crane A, Clement J.P.t., Gonzalez G, Babenko AP, Bryan J, and Aguilar-Bryan L. (1999). The C terminus of SUR1 is required for trafficking of KATP channels. J Biol Chem 274, 20628–20632. [DOI] [PubMed] [Google Scholar]
- Sharma RB, and Alonso LC (2014). Lipotoxicity in the pancreatic beta cell: not just survival and function, but proliferation as well? Curr Diab Rep 14, 492. [DOI] [PMC free article] [PubMed] [Google Scholar]
- Sitsel A, De Raeymaecker J, Drachmann ND, Derua R, Smaardijk S, Andersen JL, Vandecaetsbeek I, Chen J, De Maeyer M, Waelkens E, et al. (2019). Structures of the heart specific SERCA2a Ca(2+)-ATPase. EMBO J 38. [DOI] [PMC free article] [PubMed] [Google Scholar]
- Soesanto Y, Luo B, Parker G, Jones D, Cooksey RC, and McClain DA (2011). Pleiotropic and age-dependent effects of decreased protein modification by O-linked N-acetylglucosamine on pancreatic beta-cell function and vascularization. J Biol Chem 286, 26118–26126. [DOI] [PMC free article] [PubMed] [Google Scholar]
- Takada A, Miki T, Kuno A, Kouzu H, Sunaga D, Itoh T, Tanno M, Yano T, Sato T, Ishikawa S, et al. (2012). Role of ER stress in ventricular contractile dysfunction in type 2 diabetes. PLoS One 7, e39893. [DOI] [PMC free article] [PubMed] [Google Scholar]
- Tang J, Neidigh JL, Cooksey RC, and McClain DA (2000). Transgenic mice with increased hexosamine flux specifically targeted to beta-cells exhibit hyperinsulinemia and peripheral insulin resistance. Diabetes 49, 1492–1499. [DOI] [PubMed] [Google Scholar]
- Tong X, Kono T, Anderson-Baucum EK, Yamamoto W, Gilon P, Lebeche D, Day RN, Shull GE, and Evans-Molina C. (2016). SERCA2 Deficiency Impairs Pancreatic beta-Cell Function in Response to Diet-Induced Obesity. Diabetes 65, 3039–3052. [DOI] [PMC free article] [PubMed] [Google Scholar]
- Trinidad JC, Barkan DT, Gulledge BF, Thalhammer A, Sali A, Schoepfer R, and Burlingame AL (2012). Global identification and characterization of both O-GlcNAcylation and phosphorylation at the murine synapse. Mol Cell Proteomics 11, 215–229. [DOI] [PMC free article] [PubMed] [Google Scholar]
- Wang CY, and Liao JK (2012). A mouse model of diet-induced obesity and insulin resistance. Methods Mol Biol 821, 421–433. [DOI] [PMC free article] [PubMed] [Google Scholar]
- Wang Z, Udeshi ND, Slawson C, Compton PD, Sakabe K, Cheung WD, Shabanowitz J, Hunt DF, and Hart GW (2010). Extensive crosstalk between O-GlcNAcylation and phosphorylation regulates cytokinesis. Sci Signal 3, ra2. [DOI] [PMC free article] [PubMed] [Google Scholar]
- Weigert C, Klopfer K, Kausch C, Brodbeck K, Stumvoll M, Haring HU, and Schleicher ED (2003). Palmitate-induced activation of the hexosamine pathway in human myotubes: increased expression of glutamine:fructose-6-phosphate aminotransferase. Diabetes 52, 650–656. [DOI] [PubMed] [Google Scholar]
- Wicksteed B, Brissova M, Yan W, Opland DM, Plank JL, Reinert RB, Dickson LM, Tamarina NA, Philipson LH, Shostak A, et al. (2010). Conditional gene targeting in mouse pancreatic ss-Cells: analysis of ectopic Cre transgene expression in the brain. Diabetes 59, 3090–3098. [DOI] [PMC free article] [PubMed] [Google Scholar]
- Worley JF 3rd, McIntyre MS, Spencer B, Mertz RJ, Roe MW, and Dukes ID (1994). Endoplasmic reticulum calcium store regulates membrane potential in mouse islet beta-cells. J Biol Chem 269, 14359–14362. [PubMed] [Google Scholar]
- Yang Y, Fu M, Li MD, Zhang K, Zhang B, Wang S, Liu Y, Ni W, Ong Q, Mi J, et al. (2020). O-GlcNAc transferase inhibits visceral fat lipolysis and promotes diet-induced obesity. Nat Commun 11, 181. [DOI] [PMC free article] [PubMed] [Google Scholar]
- Zhao X, Leon IR, Bak S, Mogensen M, Wrzesinski K, Hojlund K, and Jensen ON (2011). Phosphoproteome analysis of functional mitochondria isolated from resting human muscle reveals extensive phosphorylation of inner membrane protein complexes and enzymes. Mol Cell Proteomics 10, M110 000299. [DOI] [PMC free article] [PubMed] [Google Scholar]
Associated Data
This section collects any data citations, data availability statements, or supplementary materials included in this article.
Supplementary Materials
Supplemental to Figure 4. The gene expression profiles of genes with significantly altered expression are shown for the first (left, WT1 vs. KO1) and second (right, WT3 vs. KO3) RNAseq runs. Lists of targets common to or independent for each run are listed. A final list of 284 genes is shown that was also filtered through an analysis that pooled data from the first and second runs. Only genes that were significant in all three analyses are in the final list.
Supplemental to Figure 4. Upstream regulators were predicted by Ingenuity Pathways Analysis (IPA), restricted to pancreatic tissue and islet cell lines, based on the 284 differentially expressed genes identified in Table S3. Numbers listed in “Putative O-GlcNAcylation Regulation” list the PMIDs of the literature source(s) describing O-GlcNAcylation status and predicted direction of effect, if any. “Indirect” indicates that the O-GlcNAcylation referenced and described is not on the target protein listed but on a closely associated protein (e.g. an accessory protein, binding partner or upstream transcription factor) whose O-GlcNAcylation status was directly and strongly correlated to the activity/level of the protein of interest in the listed source.
Supplemental to Table 1. Islet genes are listed and described that were differentially expressed in the current study and in the transcriptomics database published by Motterle et al. comparing islets isolated from mice after standard diet or 8 weeks of HFD. “# OGT Contacts” refers to the number of IPA-identified upstream regulator proteins that were found to be regulated by O-GlcNAcylation plus any O-GlcNAcylation targets on the gene product itself. Genes encoding proteins that have been proposed as O-GlcNAcylated are underlined. Arrows refer to the direction of gene expression change after β-cell OGT loss or 8 weeks HFD, relative to controls, as reported by our RNAseq or by Motterle et al, respectively. Fold-change and p-values characterize the same relationships. Blue indicates decreased expression and red, increased expression.
Data Availability Statement
The accession number for the RNA-sequencing data reported in this paper is GEO:GSE144760. Raw western blotting data are deposited through Mendeley Data, Reserved DOI: 10.17632/wswk5z8yvb.1