Abstract
Background:
Most acute decompensated heart failure (ADHF) admissions are driven by congestion. However, residual congestion is common and often driven by the lack of reliable tools to titrate diuretic therapy. the authors previously developed natriuretic response prediction equation (NRPE) which predicts sodium output using a spot urine sample collected 2 hours after loop diuretic administration (22).
Objectives:
The purpose of the study was to validate and describe proof-of-concept that the NRPE can be used to guide diuretic therapy.
Methods:
Two cohorts were assembled. 1) The Diagnosing and Targeting Mechanisms of Diuretic Resistance Cohort was used to validate the NRPE to predict 6-hour sodium output after a loop diuretic, which was defined as poor (<50mmol), suboptimal (<100mmol), or excellent (>150mmol). 2) The Yale Diuretic Pathway (YDP) Cohort utilized the NRPE to guide loop diuretic titration via a nurse-driven automated protocol.
Results:
Evaluating 638 loop diuretic administrations, the NRPE showed excellent discrimination with AUCs ≥0.90 to predict poor, suboptimal, and excellent natriuretic response, and outperformed clinically obtained net fluid loss (p<0.05 for all cutpoints). In the YDP cohort (n=161) utilizing the NRPE to direct therapy mean daily urine output (1.8±0.9 L vs. 3.0±0.8 L), net fluid output (−1.1±0.9 L vs. −2.1±0.9 L), and weight loss (−0.3±0.3 kg vs. −2.5±0.3 kg) improved substantially following initiation of the YDP (p<0.001 for all pre-post comparisons).
Conclusions:
Natriuretic response can be rapidly and accurately predicted by the NRPE and this information can be used to guide diuretic therapy during ADHF. Additional study of diuresis guided by the NRPE is warranted.
Keywords: diuretics, heart failure, sodium, natriuretic response
CONDENSED ABSTRACT:
The lack of reliable tools to titrate diuretic therapy in hospitalized decompensated heart failure patients contributes to the common occurrence of residual congestion after discharge. In this study, we validated a spot urine sample based natriuretic response prediction equation (NRPE), confirming accurate prediction of natriuretic response. Incorporating the NRPE into an automated diuretic titration protocol facilitated rapid diuretic titration with effective diuresis that appeared to be well tolerated. Overall, these findings suggest the NRPE is a valuable tool to guide diuretic therapy in acute decompensated heart failure.
INTRODUCTION
On a population level, hospitalization for acute decompensated heart failure (ADHF) is primarily driven by congestion, with intravenous loop diuretics representing the cornerstone of therapy (1–4). Unfortunately, it is well described that a large percentage of patients are discharged with residual congestion. Notably, in the ADHERE registry, ~20% of patients were discharged with no weight loss or even weight gain (5). The cause for this incomplete decongestion is multifactorial, but under-dosing of diuretics and loop diuretic resistance are contributing factors. Notably, diuretic resistance can often be overcome with administration of higher loop diuretic doses.
Failure to titrate diuretics to effective doses is in part driven by the lack of reliable tools to guide diuresis and decongestion. Serial changes in weight and fluid represent the current standard approach to monitoring diuretic therapy.(6) This is a problem for two reasons: (1) both are crude surrogates for the parameter of interest, sodium output and (2) both parameters are notoriously difficult to accurately obtain in clinical practice. Importantly, sodium is the primary pathophysiologic driver of extracellular volume expansion, with water passively following.(7) However, the sodium content of diuretic induced urine is highly variable and correlates only modestly with fluid and weight loss.(8,9) Notably, a positive sodium balance, even in patients with documented net fluid loss, is strongly associated with increased mortality.(8) Equally important are the practical challenges in collecting accurate cumulative fluid intake/output and weight loss in clinical practice. These limitations have been qualitatively acknowledged in the guidelines(10–13) and are well-documented in the literature.(8,14)
Our team previously developed and published preliminary observations on a natriuretic response prediction equation (NRPE).(15) With a spot urine sample obtained ~2 hours after loop diuretic administration, the 6-hour cumulative total sodium output was predicted accurately [area under the curve (AUC)> 0.9] and outperformed traditional clinical parameters such as net fluid output and weight loss. The objective of the current study was to: 1) validate the NRPE in a rigorous prospective cohort study and 2) describe proof of concept that the NRPE can be implemented in clinical practice and guide diuretic therapy.
METHODS
The present study utilized two cohorts: 1) Diagnosing and Targeting Mechanisms of Diuretic Resistance (MDR) cohort, and 2) The Yale Diuretic Pathway (YDP) cohort. The MDR cohort, was an NIH funded study prospectively designed to validate the NRPE. The YDP cohort describes our initial results implementing an automated, nurse-driven diuretic dosing protocol to guide loop diuretic titration around the NRPE.
Prospective Cohort Validation: Diagnosing and Targeting Mechanisms of Diuretic Resistance (MDR) Cohort
Patients admitted with ADHF to the cardiology service at Yale New Haven Hospital who required treatment with intravenous (IV) loop diuretics were screened. Inclusion was intentionally broad to enroll a broad spectrum of HF patients, thus making the MDR cohort generalizable. The main inclusion criteria were: (a) age ≥ 18 years, (b) use of IV loop diuretic therapy with a projected need by the treating clinician for continued treatment with IV diuretics for at least 3 days with the goal of significant fluid removal (>1 liter net fluid loss/day) and (c) at least one objective sign of volume overload (rales, edema, elevated jugular venous pressure, or preadmission weight gain). Patients with significant bladder dysfunction, urinary incontinence, inability to provide informed consent, inability to comply with urine collection procedures, hematocrit < 21%, or active bleeding, were excluded. Enrollment could occur at any point during the hospitalization that the patients met eligibility (median 1.0 days from admission). IV diuretic dosing was determined by the treating physician. Per protocol, participants were not studied if they had received loop diuretic therapy after midnight for a 9 am study loop diuretic administration, with the majority of patients having >12-hour diuretic free period. Detailed methodology on the MDR Cohort has been previously published.(16) All patients provided written informed consent, and the study was approved by the Yale Institutional Review Board.
Urine Collection Protocol
Prior to the administration of the morning diuretic dose, a blood sample was obtained, patients were asked to completely empty their bladder and a bladder scan was performed to quantitate residual volume in the bladder. Following administration of the loop diuretic, a timed 6-hour urine collection with intensive supervision by study staff was then carried out Supplemental Figure 1. Spot urine samples were obtained at 1, 2, and 6 hours following diuretic administration. Additionally, the second spontaneously produced urine was saved if it did not correspond to the 1-hour or 2-hour time point. After 6 hours, patients were asked to empty their bladder to complete the urine collection and a bladder scan was repeated. This 6-hour urine collection protocol was performed under intense supervision by study staff with verbal and visual reminders provided to patient and staff to ensure all urine was collected. Participants then underwent an 18-hour timed urine collection (to complete 24 hours) which was conducted by the clinical nursing staff. If participants continued IV diuretic therapy after the first study visit day (which we attempted to complete as early in the hospital course as possible) a second repeat collection was performed on a subsequent day (with a goal having this be one of the final doses of IV loop diuretic).
Equations
Rationale and initial description for the development of the NRPE has been previously published (15). Briefly, the instantaneous rate of urine formation can be derived from the product of estimated glomerular filtration rate (GFR) and the ratio of serum to urine creatinine. Multiplication of this product by urine sodium concentration allows conversion from the instantaneous rate of urine formation to sodium excretion (mmol/min). Based on our previously published derivation cohort, a constant of 3.25 optimally converted peak instantaneous natriuresis to cumulative 6-hour natriuresis. This constant was incorporated into the current study. The predicted total sodium output was calculated using the NRPE:
Likewise, the prediction of fluid output was calculated using the urinary response prediction equation:
Calculations
Body surface area (BSA) was calculated with the Du Bois method (17). GFR was estimated using the Chronic Kidney Disease Epidemiology Collaboration (CKD-EPI) equation (18). Fractional excretion of sodium (FENa) was calculated as (Naurine / Naserum) × (Crserum / Crurine) × 100%. Loop diuretic doses were converted to furosemide equivalents with 1 mg bumetanide = 20 mg torsemide = 40 mg intravenous furosemide = 80 mg oral furosemide (19,20). Diuretic efficiency was defined as total sodium excreted per doubling of the diuretic dose as previously described (21).
Assays
A Randox Imola automated clinical chemistry analyzer was used to measure concentration of urine or serum chemistry parameters. Creatinine and sodium, in both serum and urine, were measured in triplicate and the average was taken for analysis. The inter assay coefficient of variation was <3% for all variables. The calibrators, reagents, and urine level 2 and level 3 controls were purchased from Randox Laboratories. All assay measurements were carried out in accordance with the manufacturer’s instructions (Randox Laboratories, UK). Creatinine measurements are standardized to IDMS traceable National Institute of Standards and Technology reference material (SRM 967).
End points
The primary goal of the MDR cohort analysis was to validate the ability of NRPE to predict a poor loop diuretic natriuretic response, defined as a measured cumulative sodium output of <50 mmol in the 6 hours after the dose of the diuretic. This threshold was selected because twice daily dosing would result in <100 mmol of sodium excretion assuming limited sodium excretion in the diuretic-free period. A sodium-restricted diet at Yale is a 3-gram (130 mmol) diet, and therefore <100 mmol excretion would result in positive sodium balance. Secondary end points were: 1) suboptimal natriuretic response defined as <100 mmol of sodium output per diuretic dose which would result in maximum net sodium output of 70 mmol per day for a twice daily diuretic dose, and 2) excellent natriuretic response defined as >150 mmol of sodium output from the diuretic which would result in net sodium output of at least 170 mmol per day.
Clinical Implementation Cohort: Yale Diuretic Pathway Cohort
The YDP was developed as a clinical tool to allow rapid protocolized nurse driven titration of loop diuretics as proof of concept that the NRPE can be used to guide care. Patients were eligible to be included based on the physical/logistic location of the availability of the YDP, which was only deployed on the cardiovascular floors at Yale, with the majority of the time it only being available on the dedicated heart failure unit. We excluded patients with chronic kidney disease on dialysis, or with current use of thiazides diuretics due to concern that overdiuresis might occur with sequential nephron blockade. The YDP was initially clinically implemented (3/23/2016) utilizing urine output to trigger diuretic dosing as the NRPE was undergoing validation. However, the nursing staff implementing the YDP found that, in practice, the fidelity of fluid intake and output data was so poor they did not feel comfortable using these parameters to guide diuretic dosing. Thus, the YDP was re-tooled and re-deployed on 4/18/2017 (after interim validation of the equation with the ongoing MDR cohort) to use the NRPE. The cohort presented here represents all patients who were ordered the NRPE based YDP.
The YDP is initiated with a physician selecting the YDP order set in the EPIC computerized prescriber order entry system (Supplementary appendix 2). The physician either accepts the YDP automated defaults or specifies a starting diuretic dose (default 2 mg bumetanide), goal sodium output for the day (default 370 mmol of sodium, equivalent to ~4L of urine output with a urine Na ~90 mmol/L), and “hold parameters” if an increase in creatinine (default 0.5 mg/dl increase) and systolic blood pressure (default 90mmHg). The YDP algorithm allows another 2 possible sodium goals, 230 mmol, and 500 mmol per day, equivalent to urine output goals of 3 L, and 5 L, respectively. The initial order for the YDP provides evaluation/dosing at 9:00am, 3:00pm, 9:00pm, and 9:00am the following morning. The morning dose is given based on the previous day’s order to allow the provider to re-order the YDP by 3:00 PM each day if continued diuresis or adjustments to the goals/parameters are desired. Spot urine sodium and creatinine is obtained 1–2 hours after loop diuretic administration. The clinical decision support logic in the EPIC computerized prescriber order entry automatically calculates the predicted sodium output via the NRPE and the recommended next dose for the registered nurse. The following day’s AM dose is determined based on the prior day’s output and the dose can be between 2mg and 12.5mg bumetanide (administered as IV piggyback infusion over 1 hour) based on the YDP algorithm. The co-administration of a thiazide-like diuretic is prohibited while patients are on the YDP. An oral potassium sliding scale and twice daily metabolic panel is included as default in the order set. For institutions wanting to implement the YDP instructions and training material can be found in supplementary appendix 3. The study was approved by the Yale Institutional Review Board.
Statistical analysis
Continuous data is shown as mean ± standard deviation or median (quartile 1 – quartile 3) according to observed distribution. Categorical data is shown as frequency (percentage). Skewed variables were log-transformed. Univariate linear regression analysis accounting for the absence of independence of observations was used to assess the proportion of the variance of total sodium excretion explained by NRPE and by other variables commonly used in the clinical setting. 95% confidence interval (CI) for the correlation was estimated with 2000 bootstrap replications. Receiver operating characteristic curves with AUC for the primary and secondary end points of sodium as well as for clinically relevant thresholds of fluid output were performed. AUCs were compared between subgroups with the DeLong method. For the YDP cohort, general linear mixed models were used to analyze the repeated measures data. YDP was included as a fixed effect, and time (3 days before and 3 days on YDP) was included as a random effect. Statistical significance was defined as 2-tailed P<0.05. Categorical paired observations were analyzed with the McNemar test. 95%-confidence intervals and P values presented in this report have not been adjusted for multiplicity, and therefore inferences drawn from these statistics may not be reproducible. Statistical analysis was performed with IBM SPSS Statistics version 26 (IBM Corp, Armonk, NY) and Stata SE version 14.0 (StataCorp, College Station, TX).
RESULTS
MDR cohort
Baseline characteristics
Overall, 638 diuretic administrations from a total of 409 patients were included in the analysis of the MDR Cohort. Supplemental Figure 2 shows patients assessed for eligibility and included in the study. The median time from admission to enrollment was 1 day [interquartile range (IQR) 1 – 3 days). Table 1 illustrates the baseline characteristics of the population. Median dose of intravenous furosemide equivalents administered the day of the study was 80 mg (IQR 40 – 160), which resulted in a median measured cumulative sodium output of 85 mmol (IQR 50 – 143; Supplemental Figure 3) and a median urine output of 960 ml (IQR 640 – 1410) over the 6-hour urine collection period. Poor natriuretic response (<50 mmol of sodium output following diuretic administration) occurred in 25% and suboptimal and excellent natriuretic response was observed in 57% and 21% of the visits, respectively. Poor natriuretic responders had an average measured cumulative sodium output of 29±13 mmol after a median dose of 80 (40 – 160) mg of IV furosemide equivalents. Poor natriuretic responders were more likely to be older, female, white, and to have hypertension, coronary artery disease, lower serum chloride, lower eGFR and higher NTproBNP (Table 1). Baseline [median 44 (21 to 120) days prior to admission] eGFR was lower in patients with poor natriuretic response (mean difference 18±3 ml/min/1.73m2, p<.001). The proportion of patients with an increase of creatinine ≥0.3 mg/dL was not statistically different in patients with (26%) or without (18%) poor natriuretic response (p=0.11).
Table 1.
Characteristics of the MDR Study Population
| Characteristics | All patients n=409 | Natriuretic response <50 mmol n=106 | Natriuretic response ≥50 mmol n=303 | P value |
|---|---|---|---|---|
| Demographics | ||||
| Age (years) | 64±14 | 69±10 | 62±14 | <.001 |
| Male n (%) | 266 (65) | 60 (57) | 206 (68) | <.001 |
| Other | 33 (8) | 4 (4) | 29 (10) | |
| Systolic blood pressure (mmHg) | 118±19 | 118±20 | 118±19 | .897 |
| Body mass index (kg/m2) | 34.7±9.9 | 33.6±8.2 | 35.1±10.4 | .173 |
| Past medical history | ||||
| Hypertension n (%) | 359 (88) | 100 (94) | 259 (85) | .017 |
| Diabetes mellitus n (%) | 226 (55) | 66 (62) | 160 (53) | .092 |
| Coronary artery disease n (%) | 218 (53) | 69 (65) | 149 (49) | .005 |
| Medications (baseline) | ||||
| ACEi, ARB or ARNI n (%) | 190 (46) | 38 (36) | 152 (50) | .011 |
| Beta blocker n (%) | 267 (65) | 71 (67) | 196 (65) | .669 |
| Thiazide type diuretic n (%) | 48 (12) | 18 (17) | 30 (10) | .051 |
| Aldosterone receptor antagonist n (%) | 100 (24) | 23 (22) | 77 (25) | .444 |
| Sodium-glucose cotransporter-2 inhibitors n (%) | 6 (1) | 1 (1) | 5 (2) | >.99 |
| Digoxin n (%) | 26 (6) | 11 (10) | 15 (5) | .049 |
| Prehospital use of loop diuretic n (%) | 323 (79) | 84 (79) | 239 (79) | .936 |
| Loop diuretic dose before study (mg of oral furosemide equivalent per day) | 80 (40 – 240) | 120 (40 – 280) | 80 (40 – 240) | .361 |
| Loop diuretic dose administered the day of the study (mg of IV furosemide equivalent per dose) | 80 (40 – 160) | 80 (40 – 160) | 80 (40 – 160) | .544 |
| Laboratory value | ||||
| Serum sodium (mmol/L) | 136±5 | 136±5 | 137±5 | .251 |
| Serum chloride (mmol/L) | 96±5 | 95±5 | 96±4 | .009 |
| Serum creatinine (mg/dL) | 1.44±.57 | 1.56±.56 | 1.40±.57 | .013 |
| Blood urea nitrogen (mg/dL) | 34±20 | 39±21 | 32±19 | .002 |
| NT-proBNP at admission (pg/mL) | 3535 (1681 – 7360) | 5165 (2149 – 11994) | 3035 (1412 – 6360) | <.001 |
| eGFR (ml/min/1.73 m2) | 57±24 | 49±21 | 60±24 | <.001 |
| eGFR < 60 ml/min/1.73 m2 n (%) | 233 (57) | 77 (73) | 156 (51) | <.001 |
| eGFR < 30 ml/min/1.73 m2 n (%) | 51 (12) | 20 (19) | 31 (10) | .021 |
| Ejection fraction | ||||
| Left ventricular ejection fraction (%) | 38±18 | 39±17 | 38±18 | .518 |
All categorical values are presented as n (%) and continuous values are presented as mean ± SD or median (quartile 1 – quartile 3).
ACEi: Angiotensin-converting enzyme inhibitor. ARB: Angiotensin receptor blocker. ARNI: angiotensin receptor-neprilysin inhibitor. eGFR: estimated glomerular filtration rate. NT-proBNP: N-terminal pro brain natriuretic peptide.
Prediction of poor, suboptimal and excellent natriuretic response
The AUC of the NRPE for the prediction of the 6-hour natriuretic response using the 2-hour spot urine sample was 0.92 (95% CI 0.89 – 0.95), 0.90 (95% CI 0.87 – 0.93), and 0.90 (95% CI 0.87 – 0.93) to predict poor, suboptimal, and excellent natriuretic response, respectively (Figure 1). Calibration of the NRPE to predict poor, suboptimal and excellent natriuretic response is shown in Figure 1. When the NRPE used the 2-hour spot urine sample, or the 2nd spontaneously sample if the 2-hour sample was not produced, or the 1-hour urine sample if neither the 2-hour nor the 2nd spontaneously sample were produced, AUCs were 0.91 (95% CI 0.88 – 0.93), 0.90 (95% CI 0.88 – 0.93), and 0.91 (95% CI 0.89 – 0.94) to predict poor, suboptimal and excellent natriuretic response, respectively. Supplemental Tables 1 to 3 show different stratified cutoff values from NRPE using the 2-hour spot urine sample to predict poor, suboptimal and excellent natriuretic response. Discrimination of the NRPE to predict different natriuretic thresholds is shown in Table 2. The 1-hour sample performed inferiorly to the 2-hour sample whereas the second spontaneously produced urine performed similarly (data not shown).
Figure 1. Discrimination and calibration of the NRPE with the 2-hour sample to predict poor, suboptimal, and excellent natriuretic response in the 6-hour cumulative sodium output.
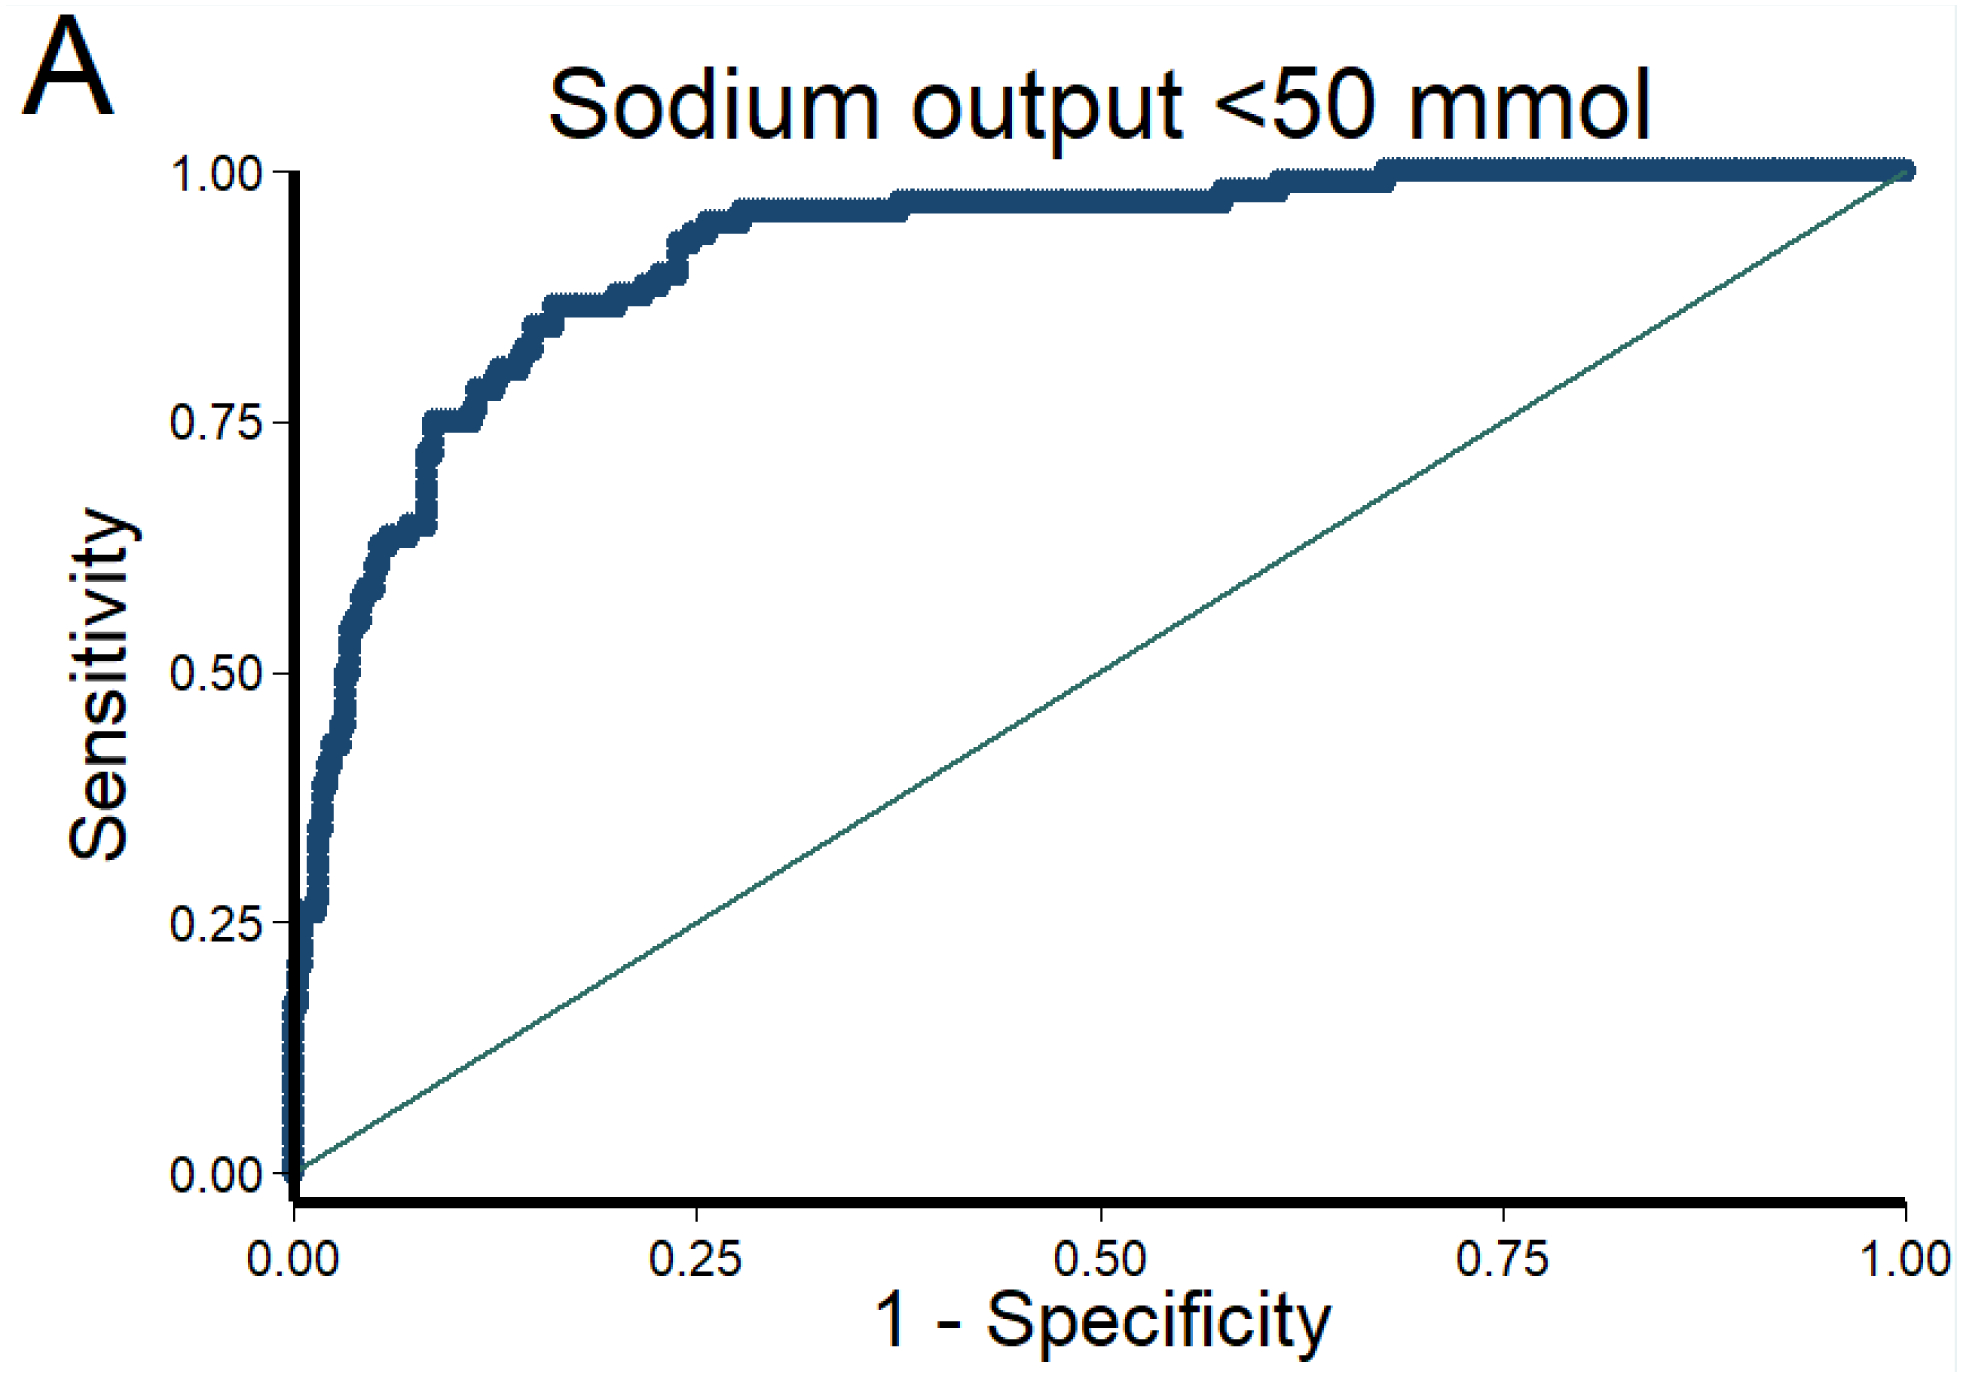
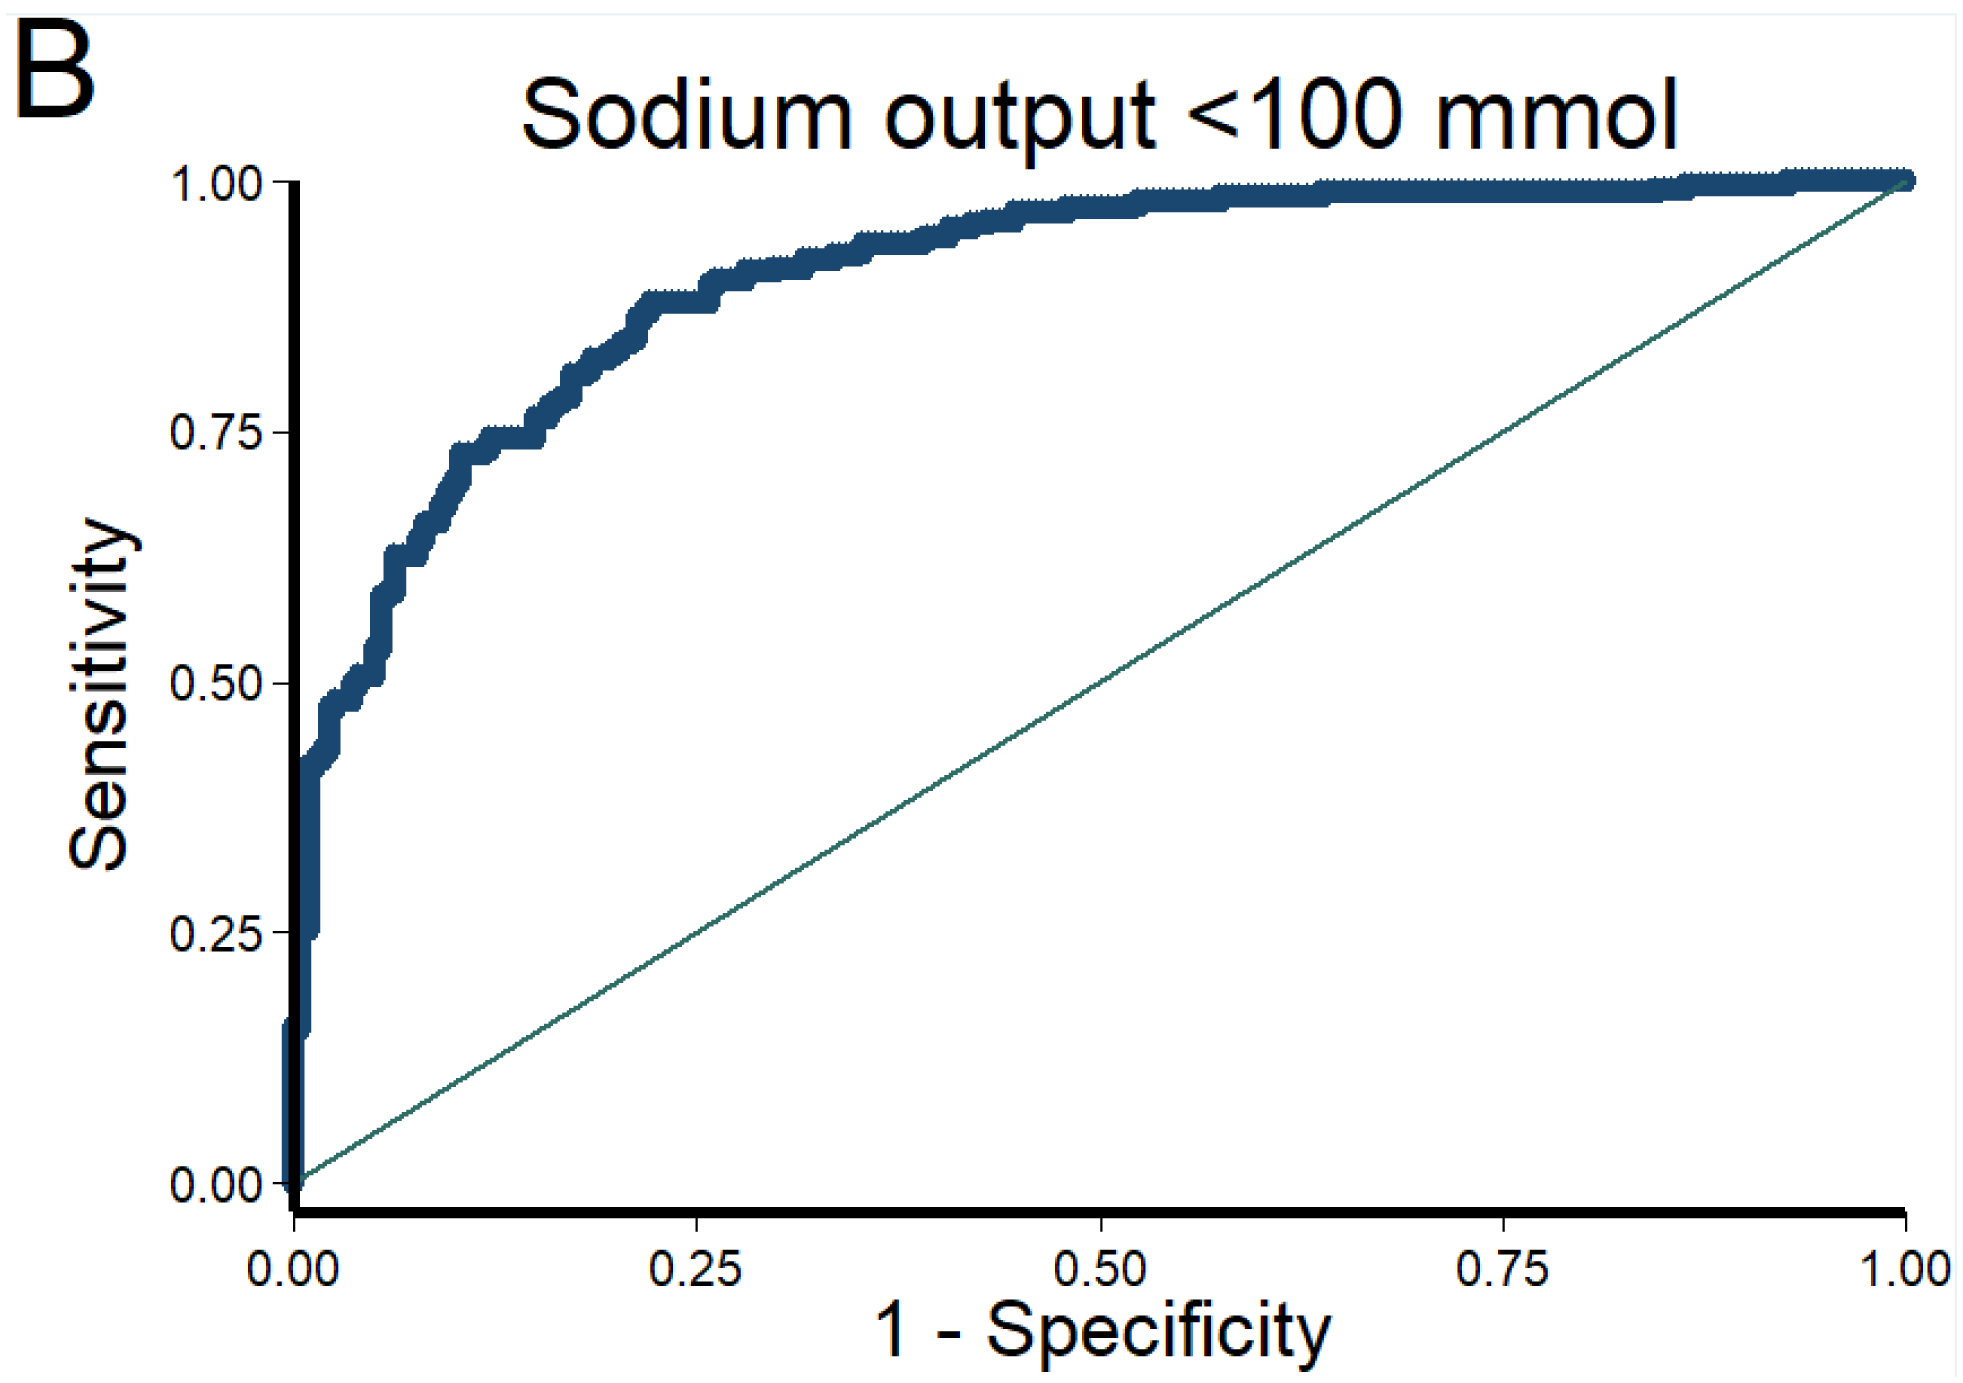
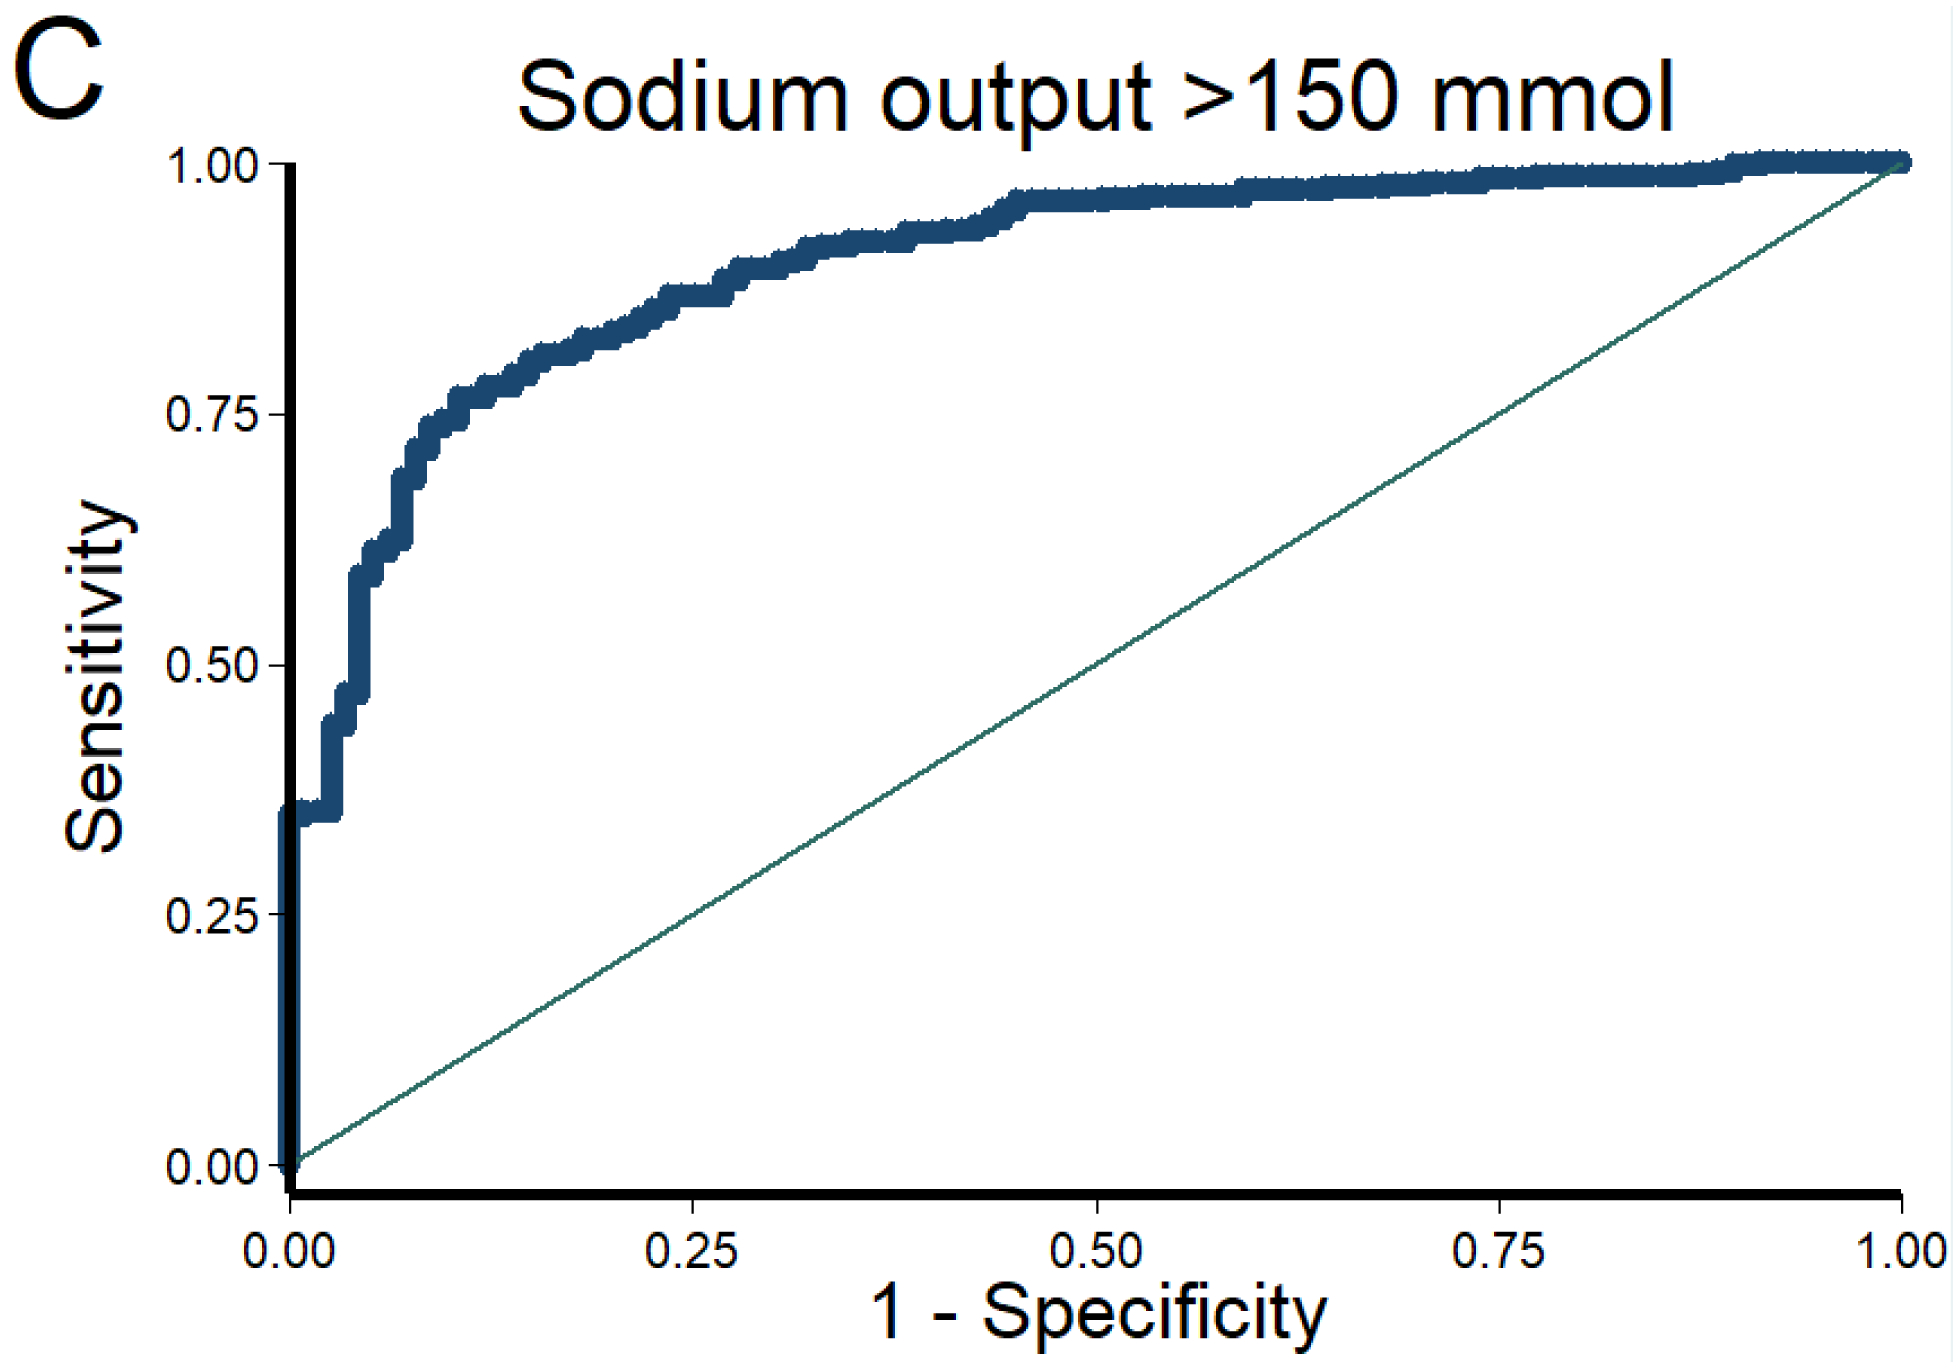
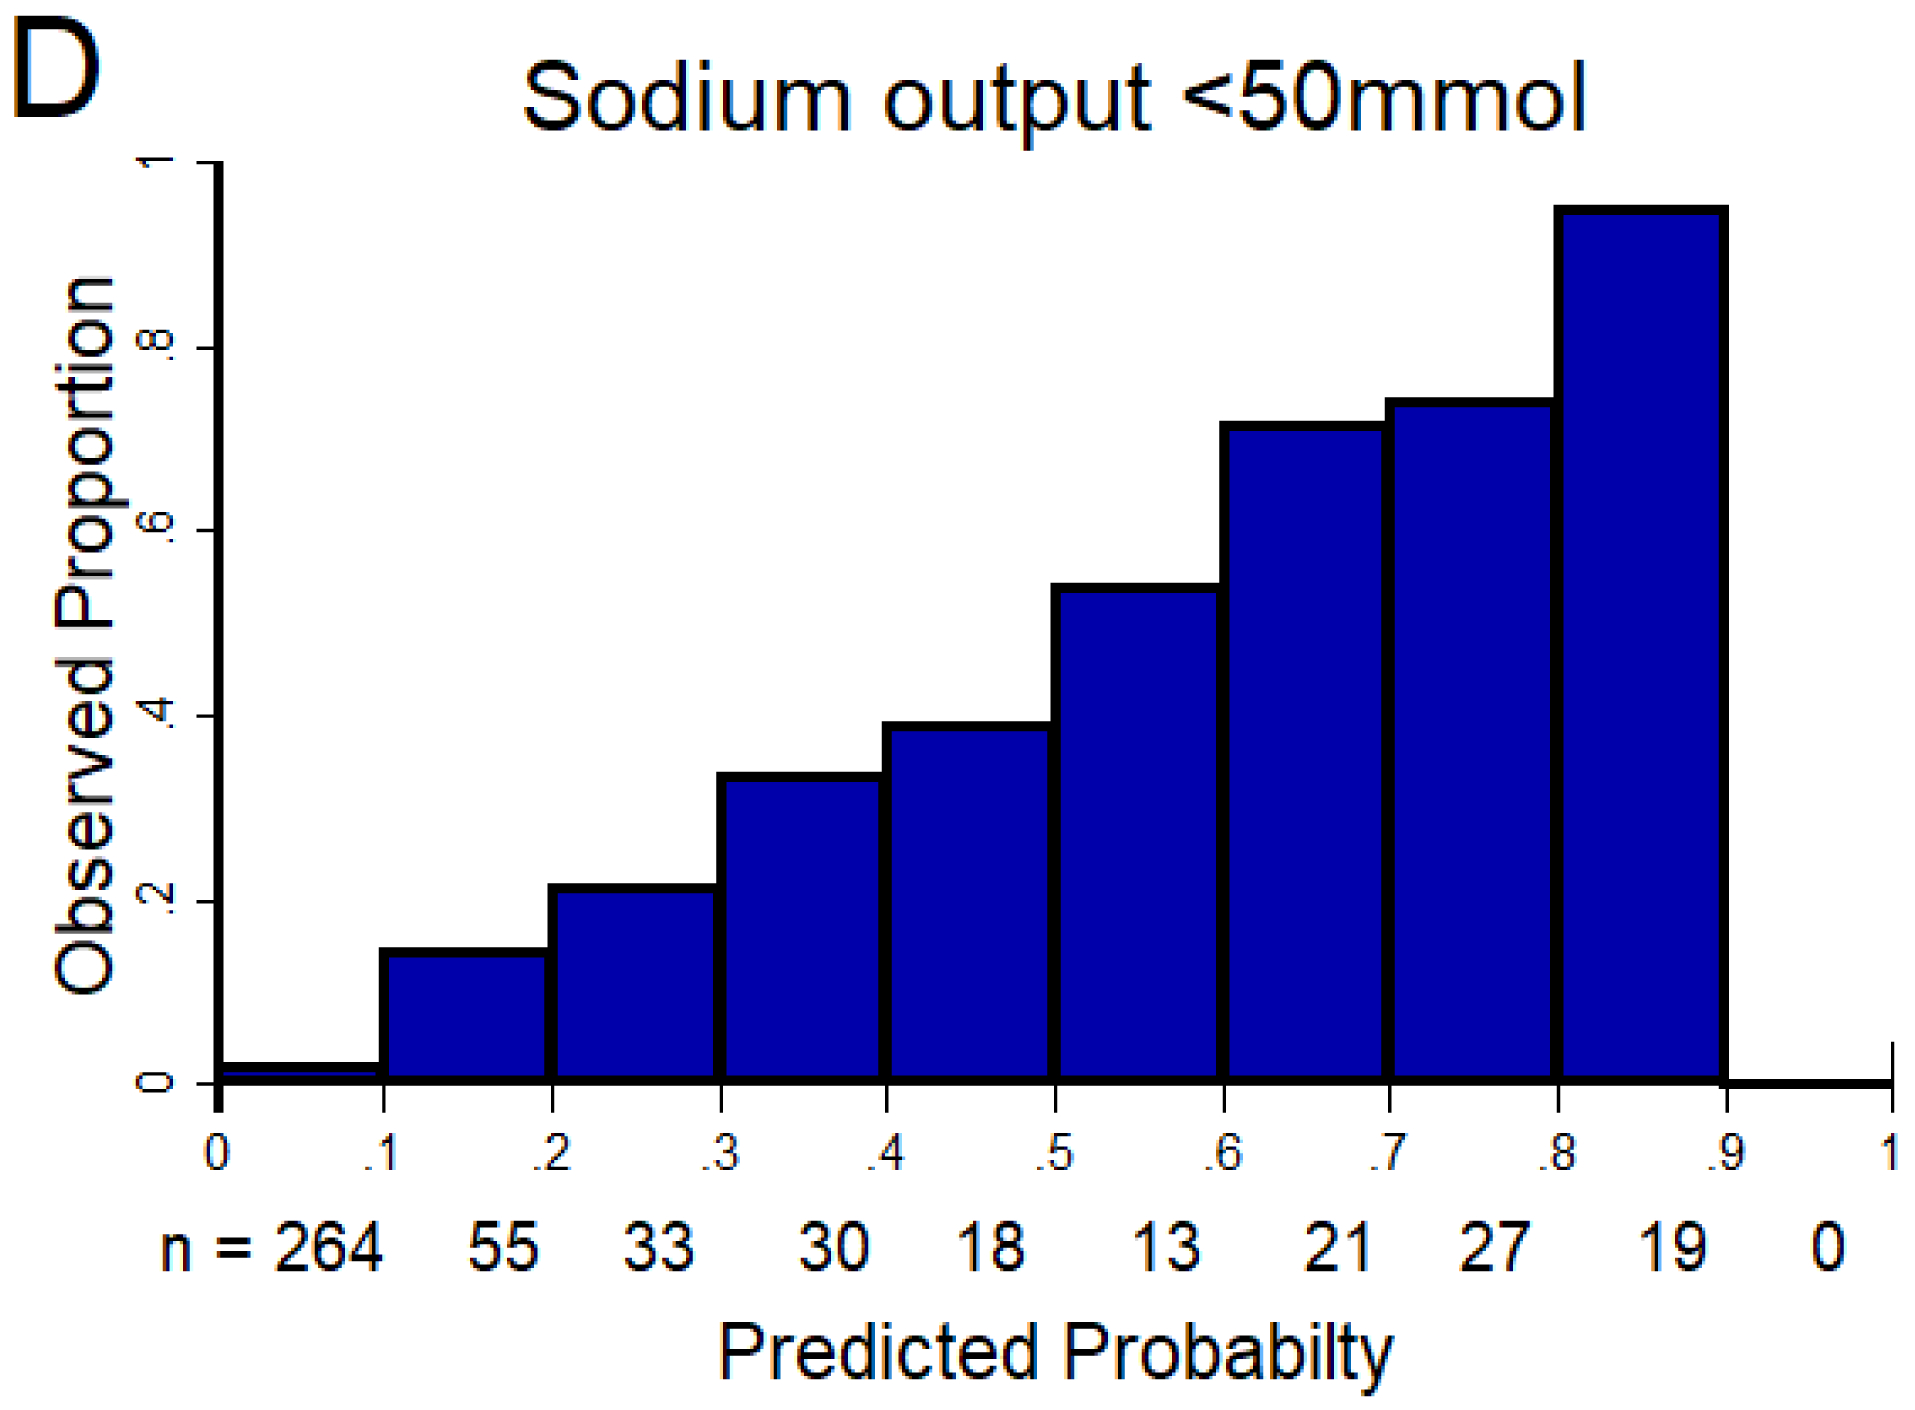
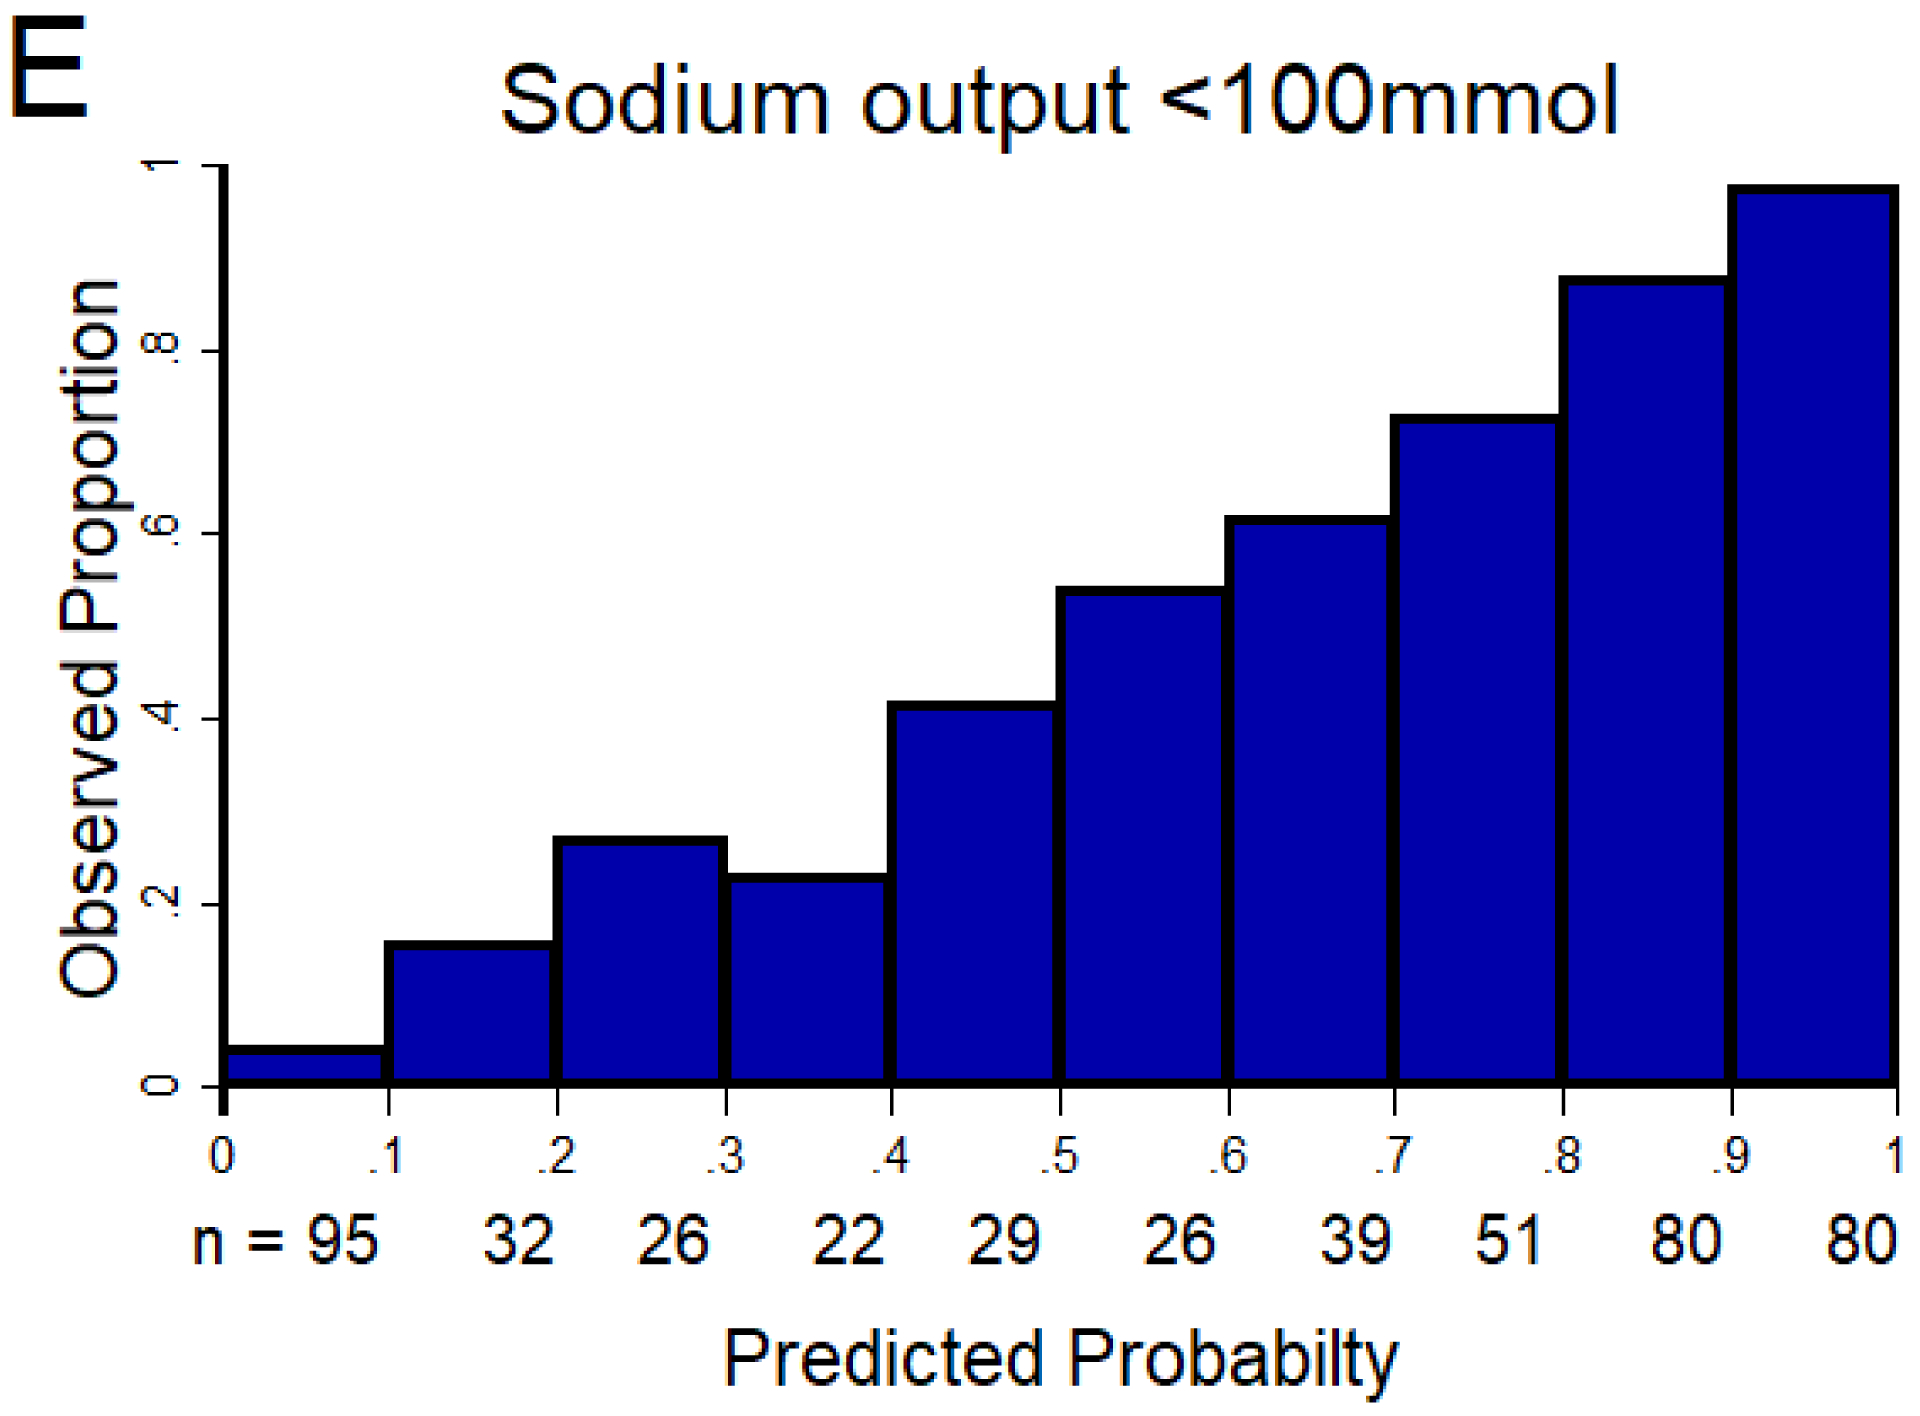
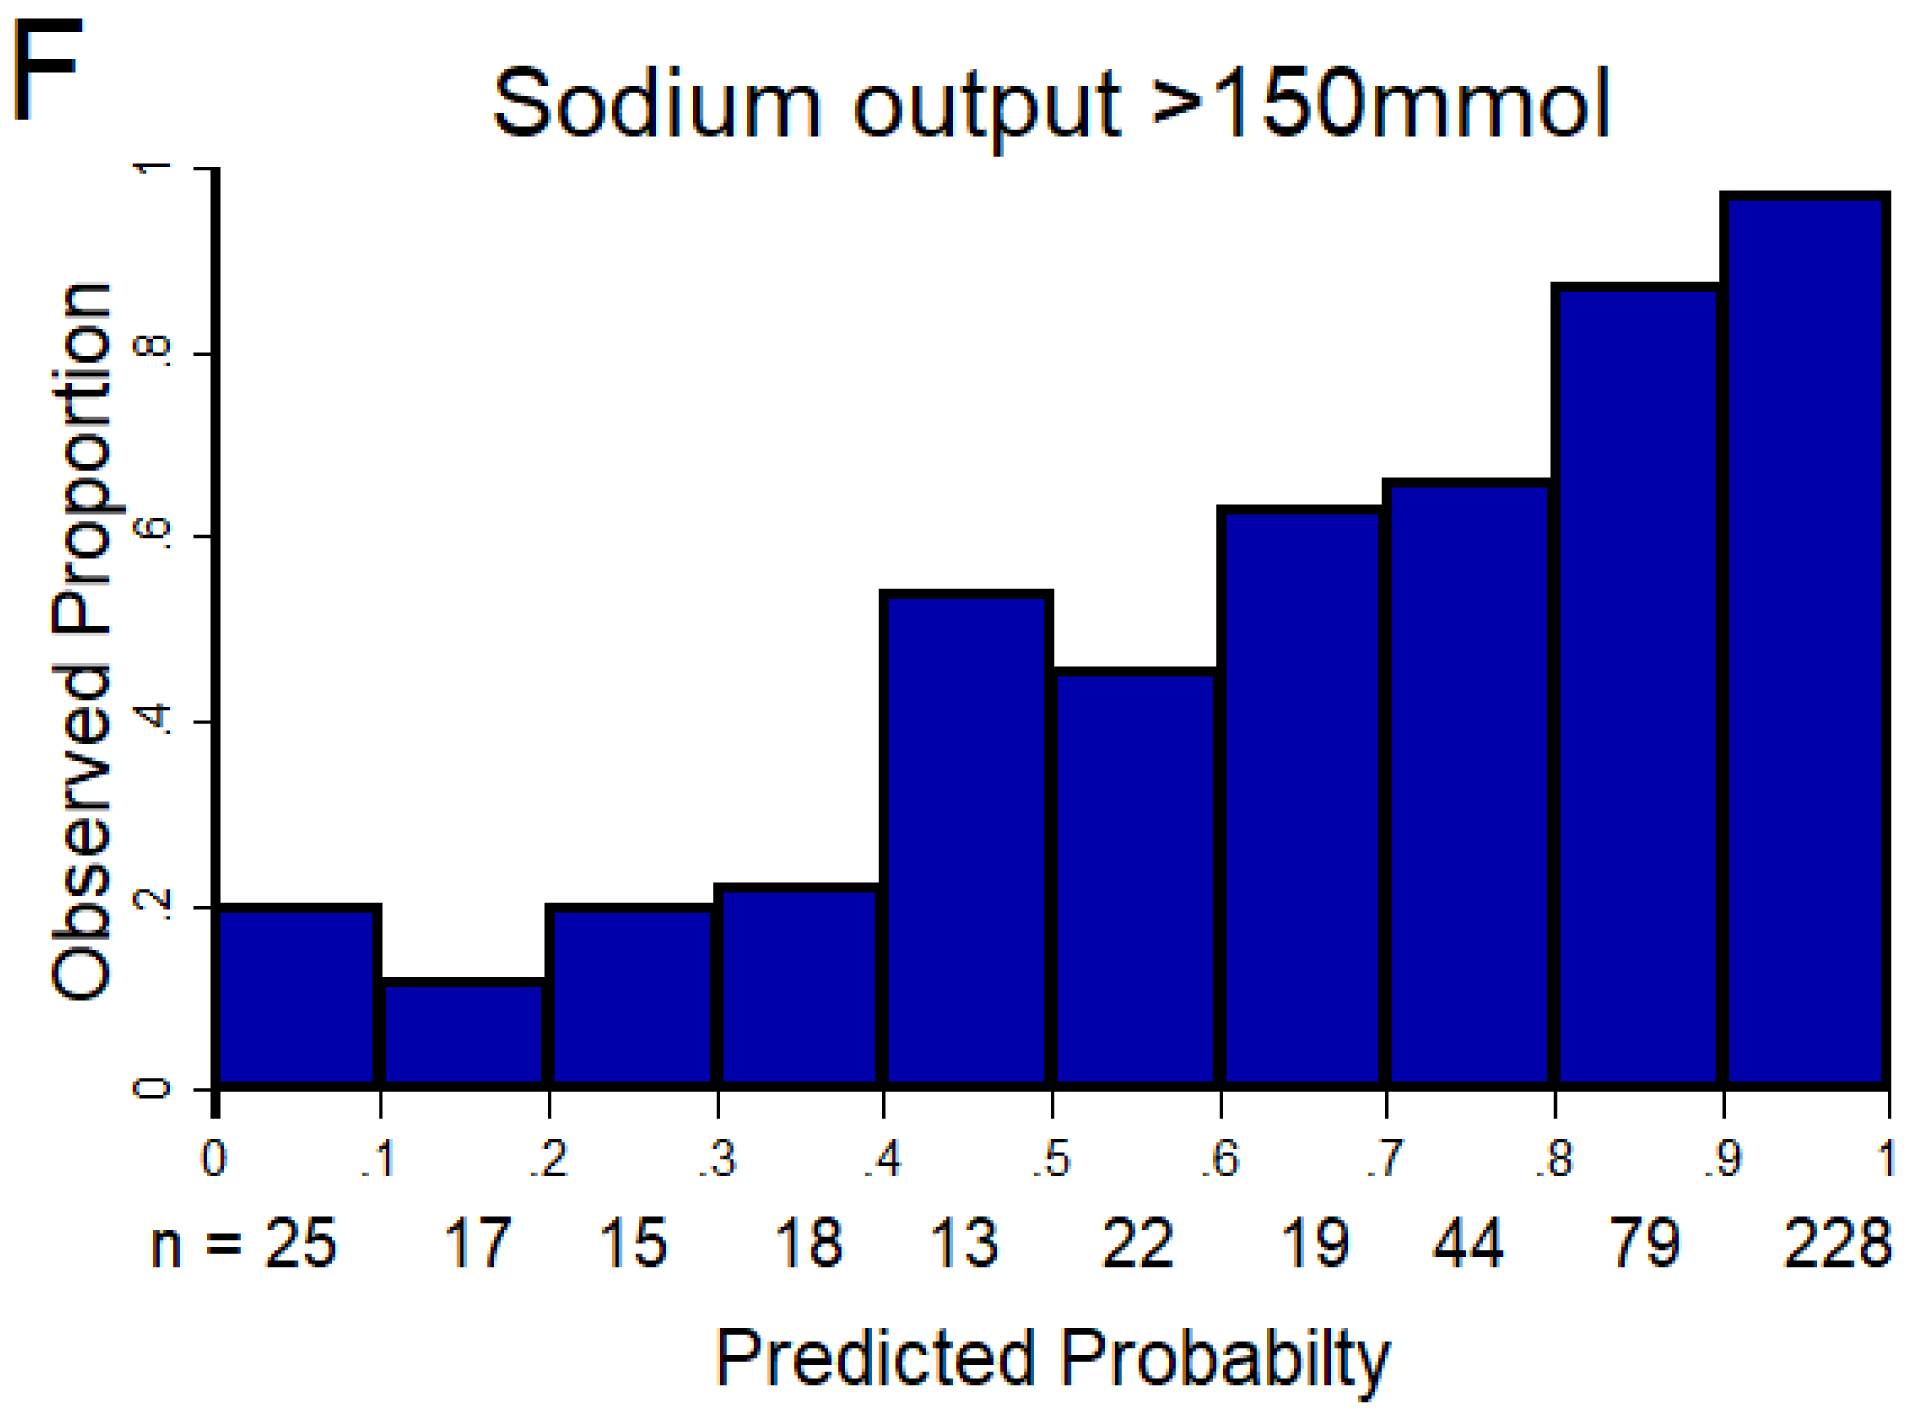
The AUC of the NRPE for the prediction of the 6-hour natriuretic response using the 2-hour spot urine sample was A) 0.92 (95% CI 0.89 – 0.95), B) 0.90 (95% CI 0.87 – 0.93), and C) 0.90 (95% CI 0.87 – 0.93) to predict poor, suboptimal, and excellent natriuretic response, respectively. D (poor), E (suboptimal) and F (excellent natriuretic response): The X-axis shows the predicted probability from 0 to 1 at cutoff values of 0.1 (10 groups), and the Y-axis shows the observed proportion. The number of patients included in each category is described underneath each bar.
Table 2.
Receiver Operating Curve Analysis Results for Prediction of Various Measured 6-hour Cumulative Sodium Output Thresholds
| NRPE (2-h sample) | Urine Sodium Concentration (2-h sample) | Intensively supervised cumulative urine output at hour 2 | Net fluid output from corresponding nursing shift | |||||
|---|---|---|---|---|---|---|---|---|
| AUC | 95% CI | AUC | 95% CI | AUC | 95% CI | AUC | 95% CI | |
| <50 mmol | .92 | .89–.95 | .89* | .85–.92 | .91‡ | .88–.94 | .82† | .79–.86 |
| <75 mmol | .89 | .87–.92 | .83† | .80–.87 | .91‡ | .88–.93 | .80† | .77–.84 |
| <100 mmol | .90 | .87–.93 | .84† | .80–.87 | .91‡ | .89–.94 | .80† | .77–.84 |
| <125 mmol | .89 | .86–.92 | .82† | .79–.86 | .92‡ | .89–.94 | .83† | .80–.87 |
| <150 mmol | .90 | .87–.93 | .81† | .77–.85 | .92‡ | .89–.94 | .85† | .81–.89 |
p=0.08 compared to NRPE
p<0.05 compared to NRPE
p>0.10 compared to NRPE
P-values were calculated with de DeLong method for paired observations.
FENa (2h-sample) also showed statistically lower AUCs compared to the NRPE for all the binary outcomes (p<0.05; data not shown).
AUC: area under the receiver operating curve. CI: confidence interval. FENa: fractional excretion of sodium. NRPE: natriuretic response prediction equation.
Factors influencing accuracy of NRPE
Discrimination of the NRPE using the 2-hour spot urine sample was consistent across different subgroups as the AUC to predict a poor and suboptimal natriuretic response in the 6-hour cumulative sodium output was similar between analyzed subgroups such as 1) gender, 2) BMI, 3) eGFR <30 ml/min/1.73m2, 4) type of administered diuretic (furosemide vs. bumetanide), 5) technical or logistical issues encountered during urine collection, 6) slow bolus (IV piggyback) vs fast bolus (IV push), 7) patient enrolled >24 hours from admission, 8) home use of thiazide diuretic, 9) presence of urinary catheter, and 10) higher vs lower loop diuretic dose per eGFR; p>0.15 for all comparisons of AUCs between subgroups. Finally, the accuracy of the NRPE using the 2-hour spot urine sample was consistent and not statistically different (p>0.15) across a continuum of post-void residual volumes, as its accuracy was similar in those with residual volume >300 ml (i.e., the definition of urinary retention) or <100 ml (i.e., normal) (Supplemental Table 4).
Comparison of NRPE to net fluid output, spot urine sodium concentration and other metrics
Compared to NRPE using the 2-hour sample, spot urine sodium concentration and net fluid output showed lower AUC to predict poor, suboptimal and excellent natriuretic response in the 6-hour cumulative sodium output (Table 2). Supplemental Tables 1 to 3 show sensitivity and specificity at different thresholds of the NRPE to predict poor, suboptimal, and excellent natriuretic response. Supplemental Tables 5 to 7 show sensitivity and specificity at different thresholds of spot urine sodium concentration to predict the same outcomes. NRPE estimates generally outperformed spot sodium concentration. Importantly, the NRPE (2-hour sample) also outperformed FENa, a metric that accounts for many of the same variables included in the NRPE but does not account for GFR. Similarly, NRPE (2-hour sample) outperformed IV furosemide equivalent administered, spot urine creatinine, net fluid output from corresponding nursing shift, estimated GFR, systolic blood pressure, and body mass index Supplemental Table 8.
The association of NRPE (2-hour sample) with 6-hour measured cumulative sodium output as continuous parameters is shown in Figure 2. Supplemental Figure 4 shows the same association stratified by tertiles of GFR. Supplemental Table 9 shows correlations between 6-hour measured cumulative sodium output and other metrics. Importantly, the 6-hour measured cumulative sodium output significantly correlated with the 24-hour cumulative sodium output (r=0.82, Supplemental Table 10). The 1-hour parameters (sodium concentration, urine output, and NRPE) showed weaker correlations compared to the 2-hour NRPE (data not shown).
Figure 2. Association between the 6-hour measured sodium output and the NRPE using the 2-hour spot urine sample.
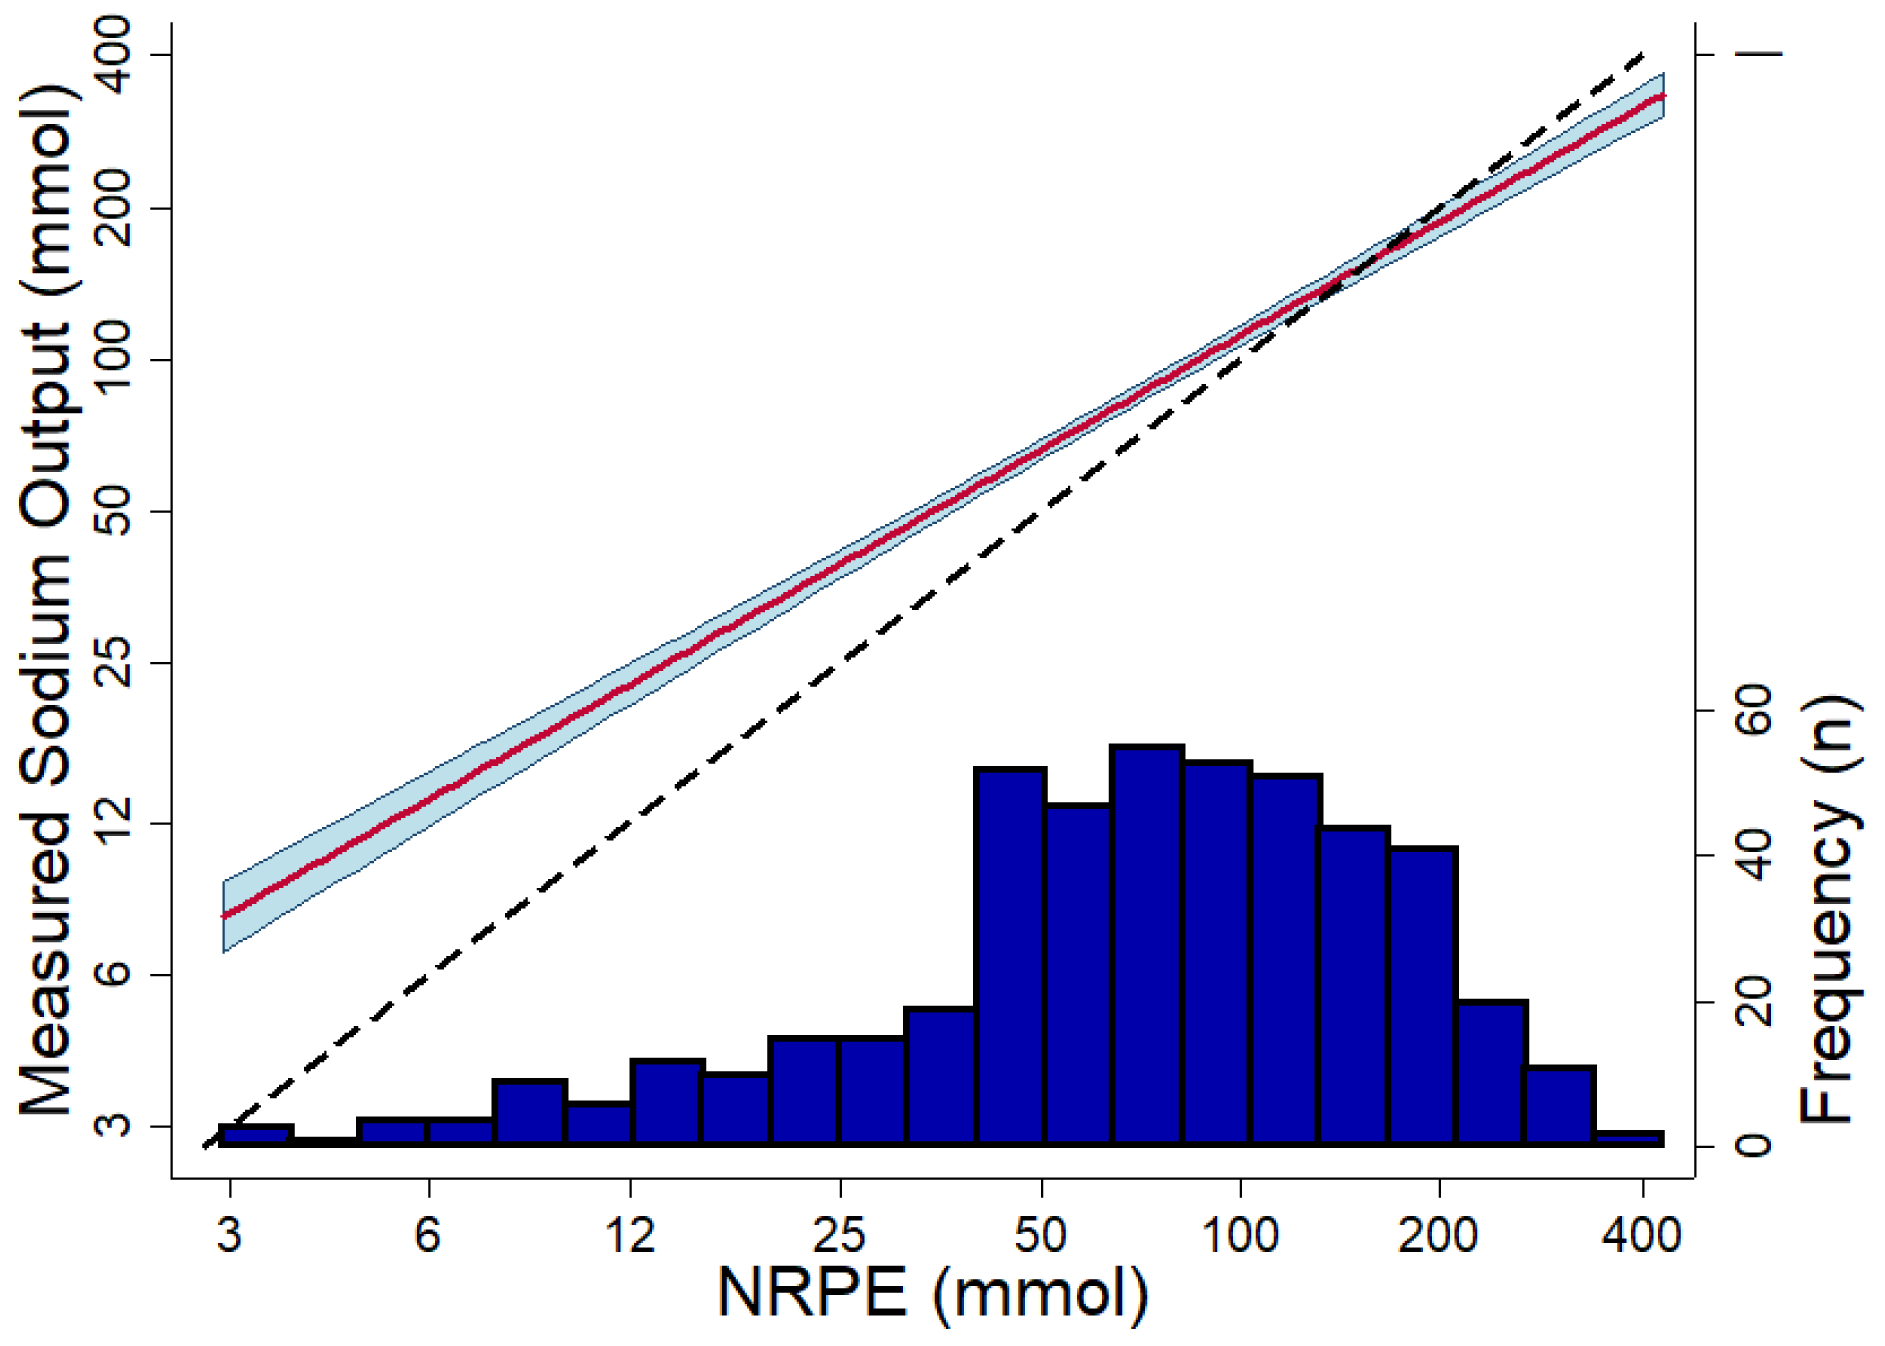
Association between the 6-hour measured sodium output and the NRPE using the 2-hour spot urine sample. The red line shows the predicted association using linear regression, and the blue area shows the 95% confidence interval (P-value for non-linearity = 0.23). The dashed black line is the reference of what would be a perfect association. The dark blue histogram at the bottom show the number of observations. X-axis and Y-axis are in log-scale.
Prediction of urine output
The urinary response prediction equation using the 2-hour spot urine sample showed good discrimination to predict different thresholds of the 6-hour cumulative urine output with AUC values ≥0.86. Supplemental Table 11 shows AUCs for 500ml, 1000ml and 1500 ml. Supplemental Table 12 shows correlations for 6-hour measured urine output with urinary response prediction equation and other variables of interest. The web-based calculator for NRPE and urinary response prediction equation can be found online (22).
Clinical Implementation Study: YDP cohort
In the YDP cohort, a total of 161 patients received diuretic therapy serially guided by the NRPE. Median time from admission to the initiating the YDP was 2 (1–4) days. Table 3 shows baseline characteristics of the YDP cohort. The median dose of IV furosemide equivalents before the YDP was 120 (80–140) mg per day. The median 1–2 hour post diuretic FENa was 2.95 (1.16–5.26) and the calculated 6-hour sodium output was 37 (16–84) mmol with the first loop diuretic dose of the YDP [median IV furosemide equivalents 80 mg (80–160)]. With subsequent doses, an increased peak natriuretic effect was observed by each escalation of loop diuretic dose (Figure 3; p value for trend <.001). Consistently, total urine output, net fluid output and weight loss clinically and statistically improved when patients were on YDP driven by the NRPE compared to before the use of the NRPE (p < 0.001 for all, Figure 4). These improvements occurred regardless of time from admission to initiation of the YDP, being similar for net fluid output and weight loss (P-interaction ≥0.39 for both). Hemoconcentration did not occur before YDP (mean hemoglobin change: −.04±.07 g/dL [p=.56]) but occurred after initiation of YDP (mean hemoglobin change: .26±.06 g/dL [p<.001]; P-interaction = 0.001). In addition, the YDP utilizing the NRPE rapidly facilitated diuretic titration with a peak of 1500 mg furosemide equivalents (980 – 1500 mg) per day, reaching this dose within the first 2 days in 86% of the patients. YDP was terminated for reasons related to satisfactory or complete up-titration of diuretics in 84% of patients (Figure 5). Very few patients had electrolyte abnormalities, increase in creatinine or low blood pressure. Among patients who experienced an increase in creatinine ≥0.5 mg/dL none required dialysis, and their average change in renal function from peak creatinine to discharge was 8±13 ml/min/1.73m2. The only significant finding being a modestly increased use of potassium replacement (Table 4), primarily driven by the sliding scale of potassium included in the YDP protocol. There were no clinically diagnosed episodes of ototoxicity.
Table 3.
Characteristics of the YDP Cohort
| Characteristics | All patients n=161 |
|---|---|
| Demographics | |
| Age (years) | 69±13 |
| Male n (%) | 90 (56) |
| Other | 18 (11) |
| Past medical history | |
| Hypertension n (%) | 144 (89) |
| Diabetes mellitus n (%) | 111 (69) |
| Prehospital use of loop diuretic n (%) | 143 (89) |
| Laboratory value | |
| Serum sodium (mmol/L) | 139±5 |
| Serum chloride (mmol/L) | 100±6 |
| Serum creatinine (mg/dL) | 1.64±.83 |
| Blood urea nitrogen (mg/dL) | 36±21 |
| eGFR (ml/min/1.73 m2) | 51±28 |
| eGFR < 60 ml/min/1.73 m2 n (%) | 107 (66) |
| eGFR < 30 ml/min/1.73 m2 n (%) | 41 (25) |
| Ejection fraction | |
| Left ventricular ejection fraction (%) | 43±17 |
All categorical values are presented as n (%) and continuous values are presented as mean ± SD.
Figure 3. Fractional excretion of sodium by dose of loop diuretic administered on the YDP.
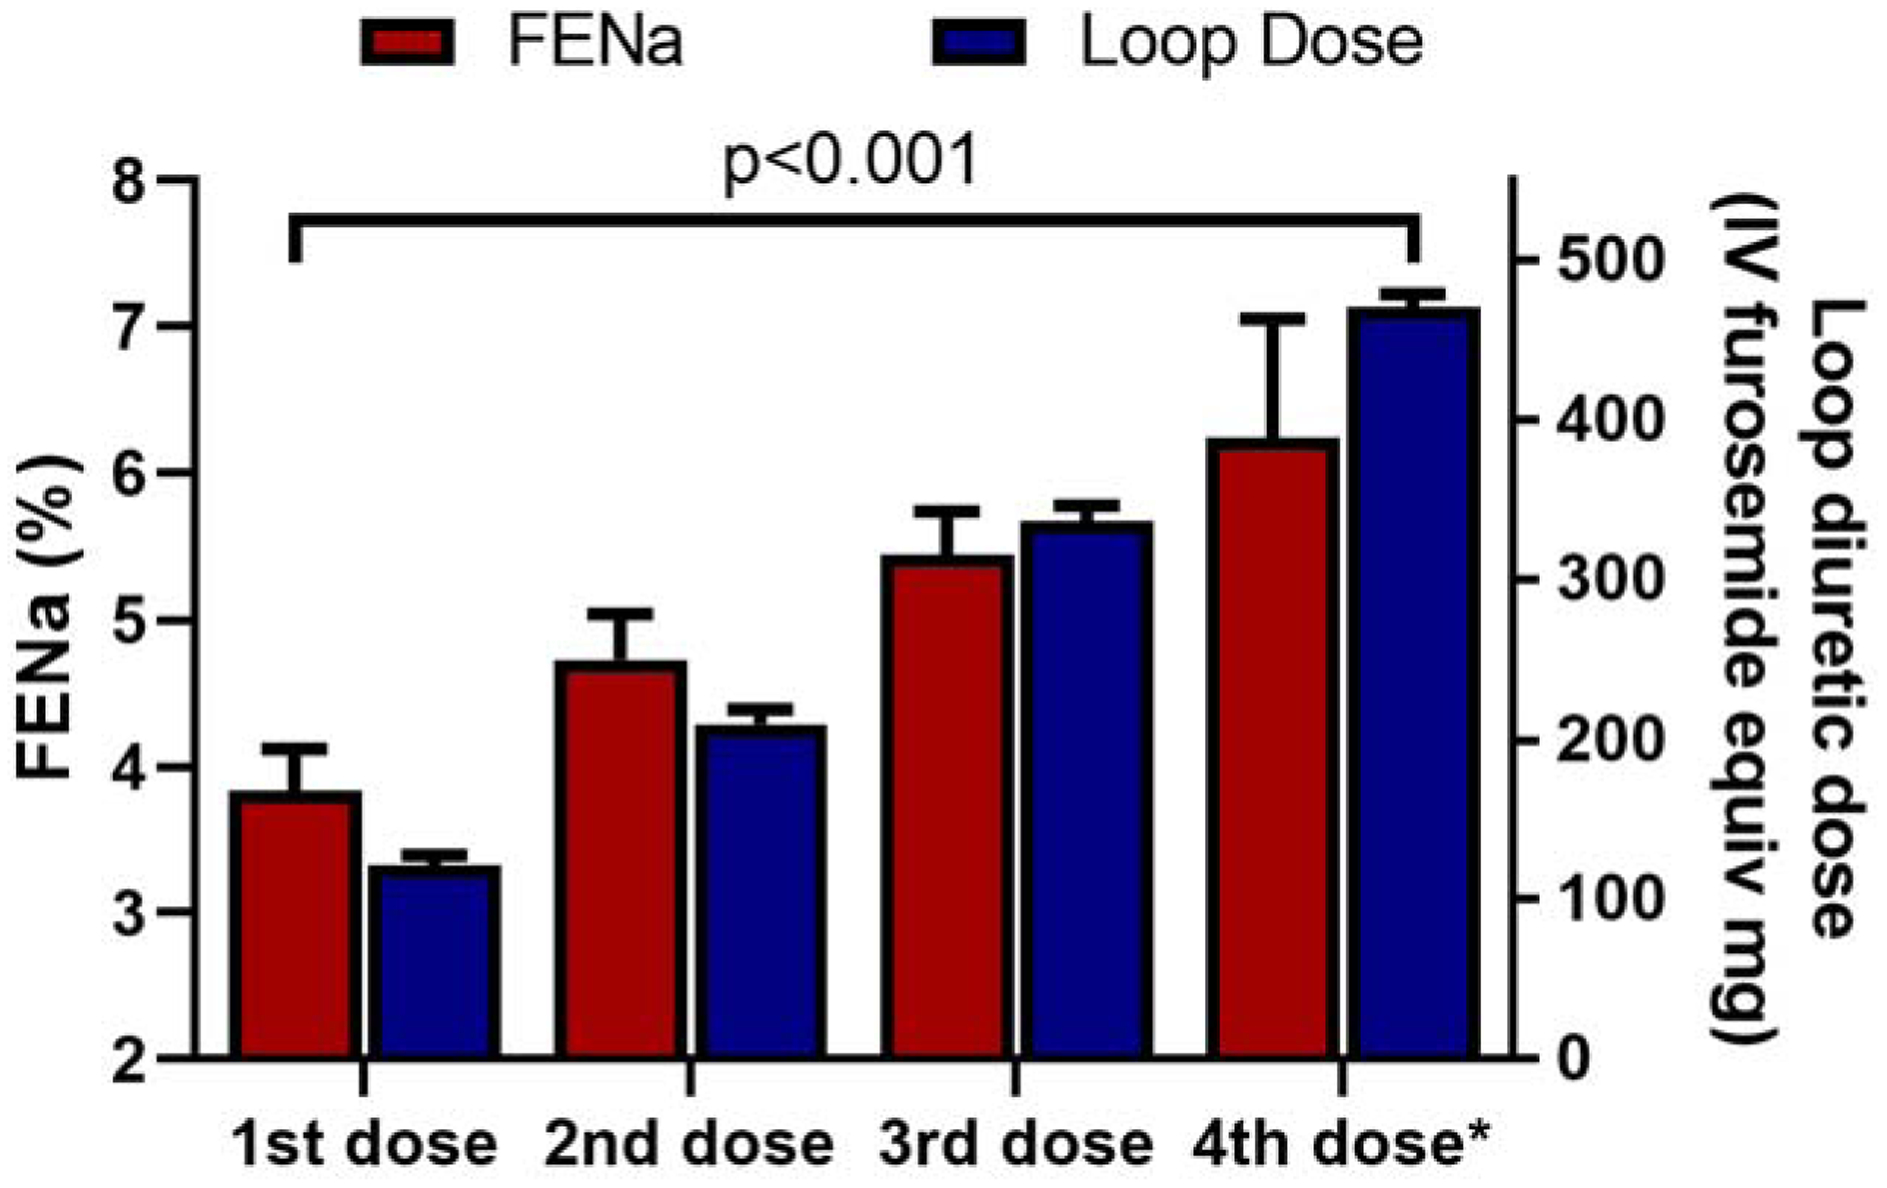
An increased peak natriuretic effect was observed by each escalation of loop diuretic dose (p value for trend <.001). *The 4th dose is the highest dose received on day 2 of the YDP.
Figure 4. Daily total urine output, Net IO and weight change prior to and after initiation of the YDP.
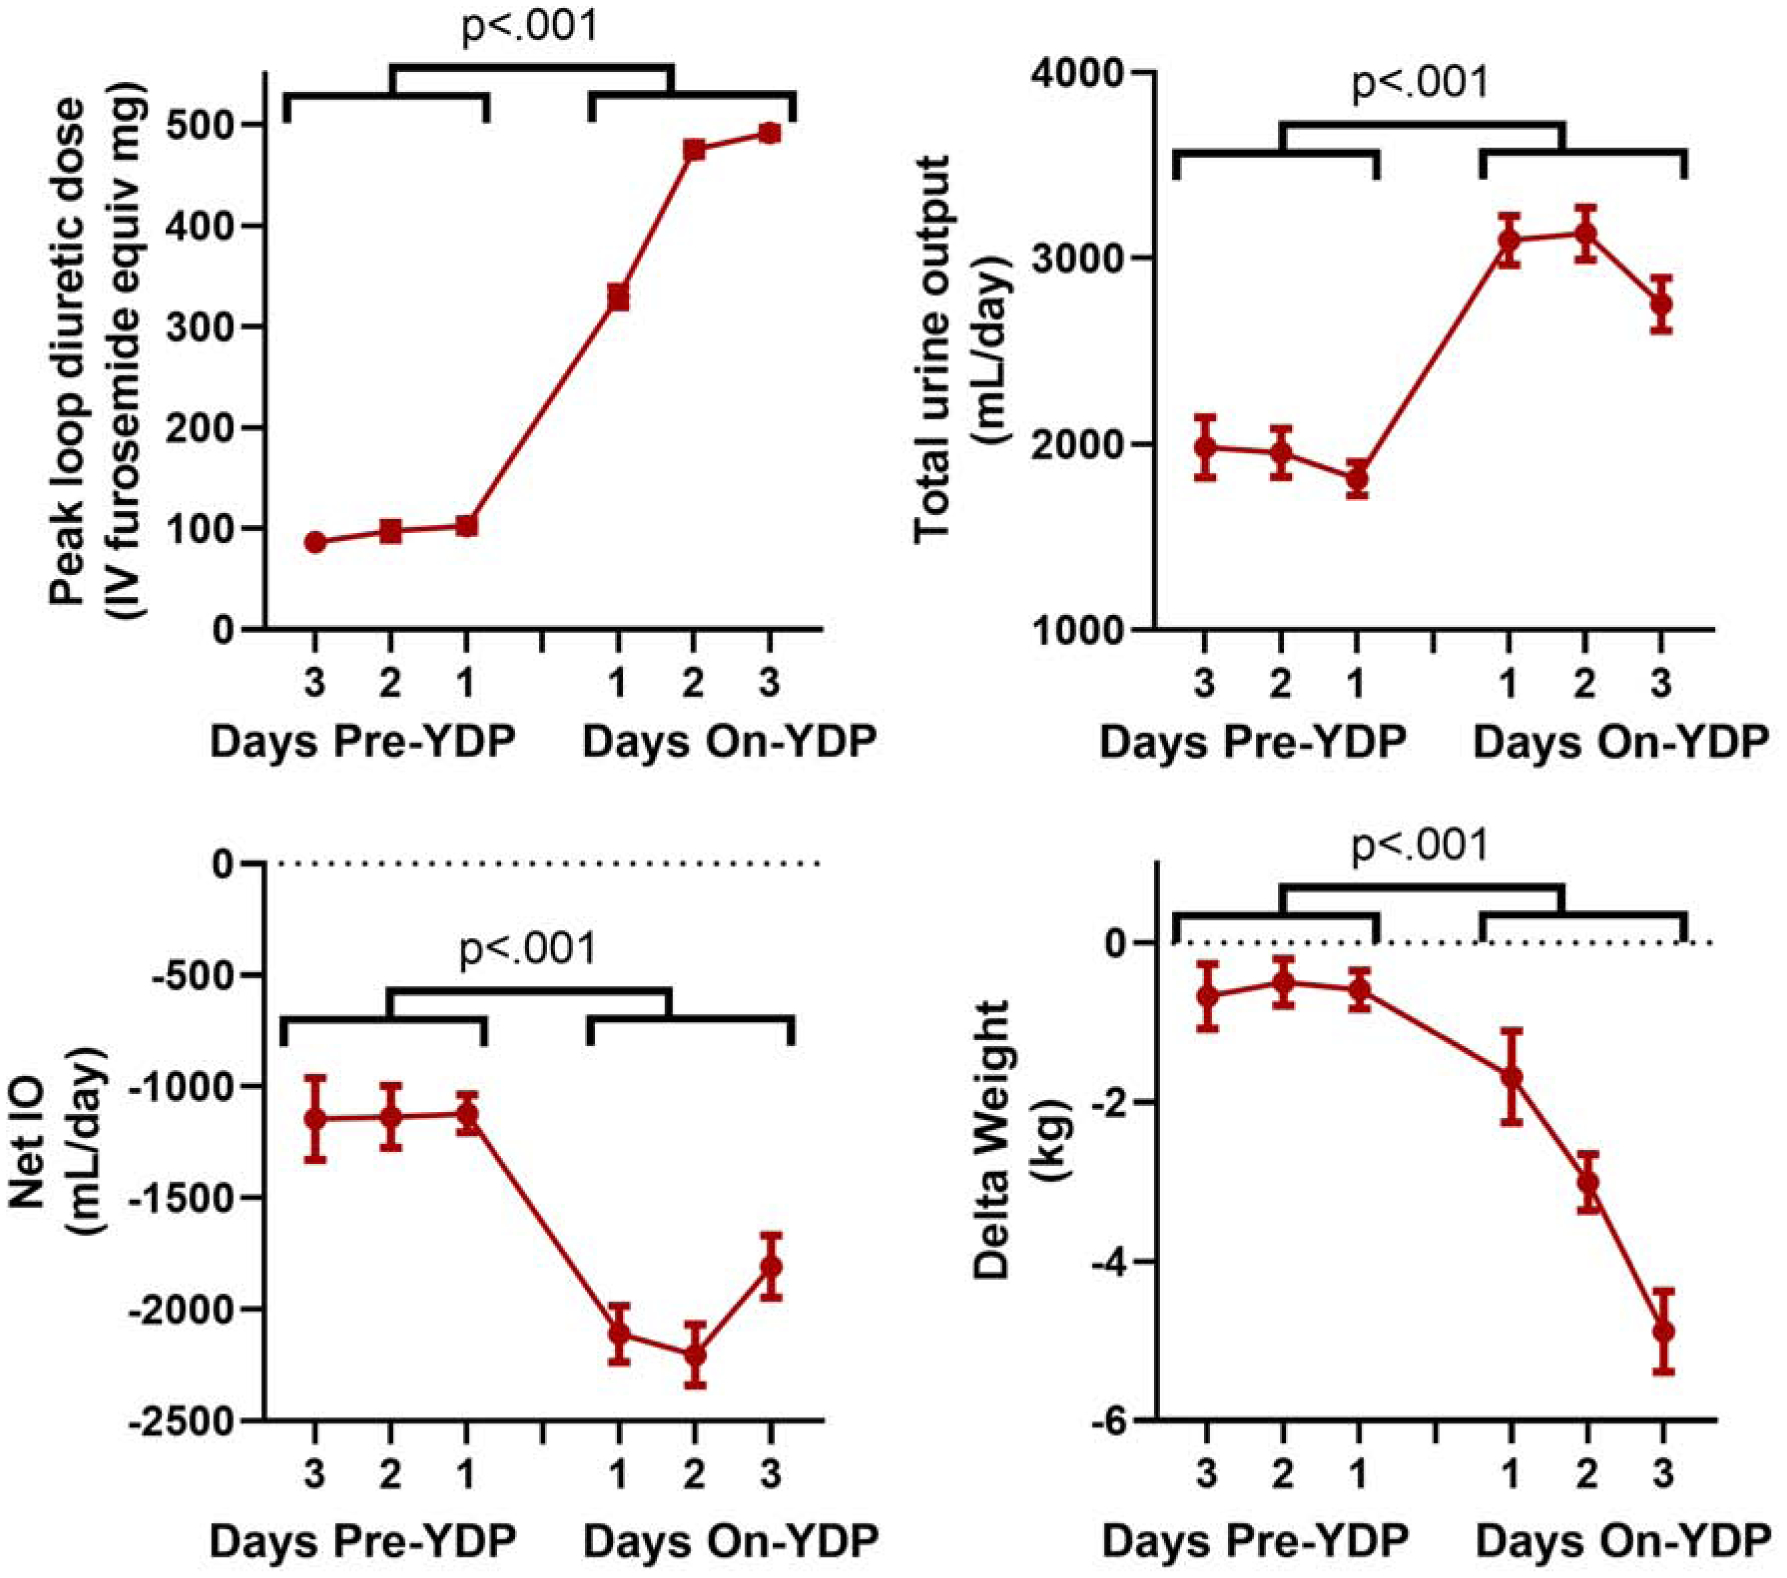
Total urine output, net fluid output and weight loss improved when patients were on YDP driven by the NRPE compared to before the use of the NRPE (p < 0.001 for all). Mean change (95% CI) in total urine output, net IO, and weight change from pre- to on-YDP was 1208 ml (1015 to 1400 ml), −980 ml (−1181 to −778 ml), and −2.2 kg (−2.8 to −1.6 kg) respectively; all p<0.001. Because not all patients had three days pre-YDP or three days on-YDP, data is presented for the available observations.
Figure 5. Reasons for discontinuation of the YDP.
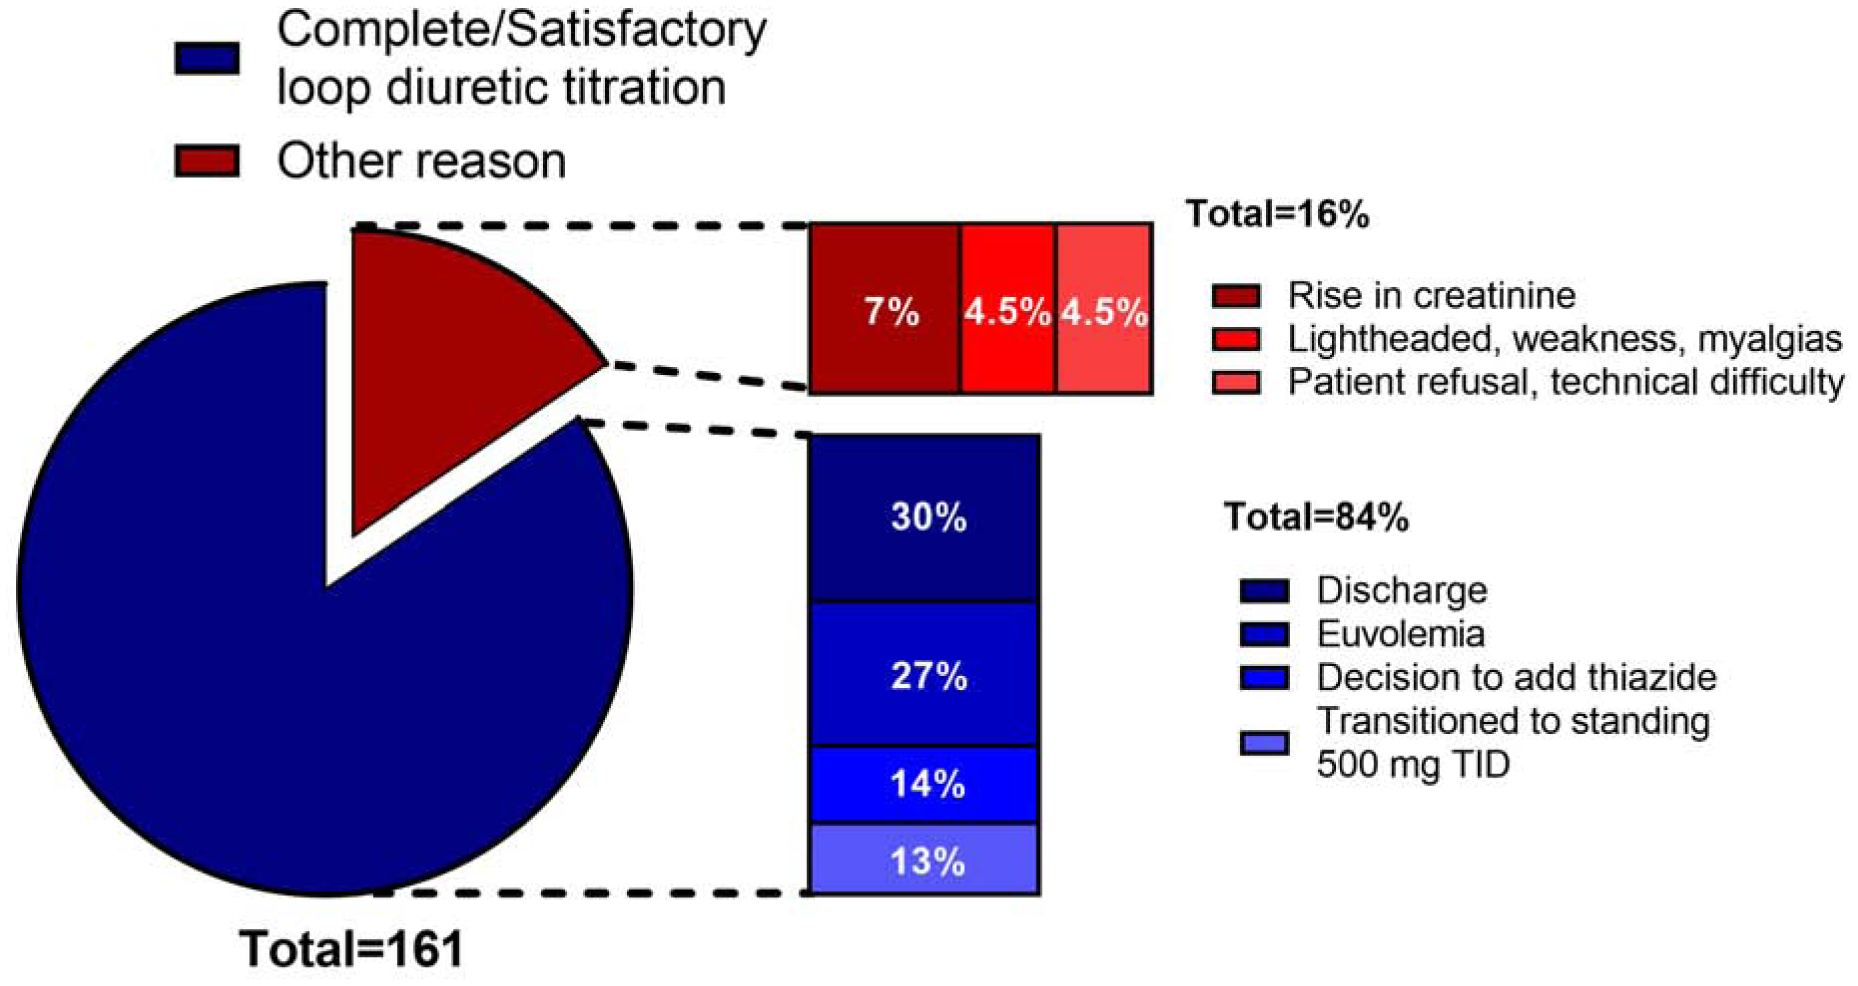
Out of the 161 patients included in the YDP cohort, there were successful reasons for discontinuing YDP in 136 patients (84%): discharge 30%, euvolemia 27%, decision to add a thiazide 14%, transitioned to standing 500mg TID 13%. In 25 patients (16%) YDP was discontinued due to unsuccessful reasons: rise in creatinine 7%; lightheadedness, weakness or myalgia 4.5%; patient refusal or technical difficulty 4.5%. TID: three times a day.
Table 4.
Safety parameters before and on YDP
| Condition | Number of patients | Before YDP N (%) | On YDP N (%) | P value |
|---|---|---|---|---|
| K <3.0 mmol/L | 156 | 0 | 1 (0.6%) | .317 |
| Mg <1.5 mg/dL | 79 | 4 (5.1%) | 3 (3.8%) | .655 |
| Na <135 mmol/L | 156 | 7 (4.5%) | 6 (3.7%) | .564 |
| Na >145 mmol/L | 156 | 4 (2.6%) | 5 (3.2%) | .739 |
| SBP <90 mmHg | 150 | 2 (1.3%) | 1 (0.7%) | .317 |
| Increase in creatinine >0.5 mg/dL | 155 | 3 (1.9%) | 9 (5.8%) | .083 |
| Potassium supplementation | 161 | 48 (29.8%) | 83 (51.6%) | <.001 |
DISCUSSION
The findings of the present study are twofold. First, we validated our previously derived NRPE formula showing that it is capable of rapidly and accurately predicting poor natriuretic response using a spot urine sample collected 2 hours after loop diuretic administration. Discrimination of the NRPE was similar across subgroups, including patients with significant bladder dysfunction, and outperformed clinically obtained net fluid output. Secondly, the NRPE can be successfully used to guide diuretic therapy. When incorporated into an automated diuretic titration protocol we observed rapid and well tolerated decongestion. Overall, these findings suggest the NRPE is a valuable tool to guide diuretic therapy in ADHF and can be used as the primary metric upon which automated rapid titration of diuretics to effective doses can be based (Central Illustration). Further these findings also suggest a semi-automated nurse driven diuretic protocol can be instituted to facilitate decongestion, overcoming the inherent challenges of traditional urine-output guided diuretic titration. Our next step is to formally evaluate this hypothesis, comparing the efficacy of the YDP to improve decongestion when compared to structured usual care in a prospective, blinded randomized trial (NCT04481919).
Central Illustration: Use of the Natriuretic Response Prediction Equation in patients with acute heart failure and its implementation to guide diuretic therapy.
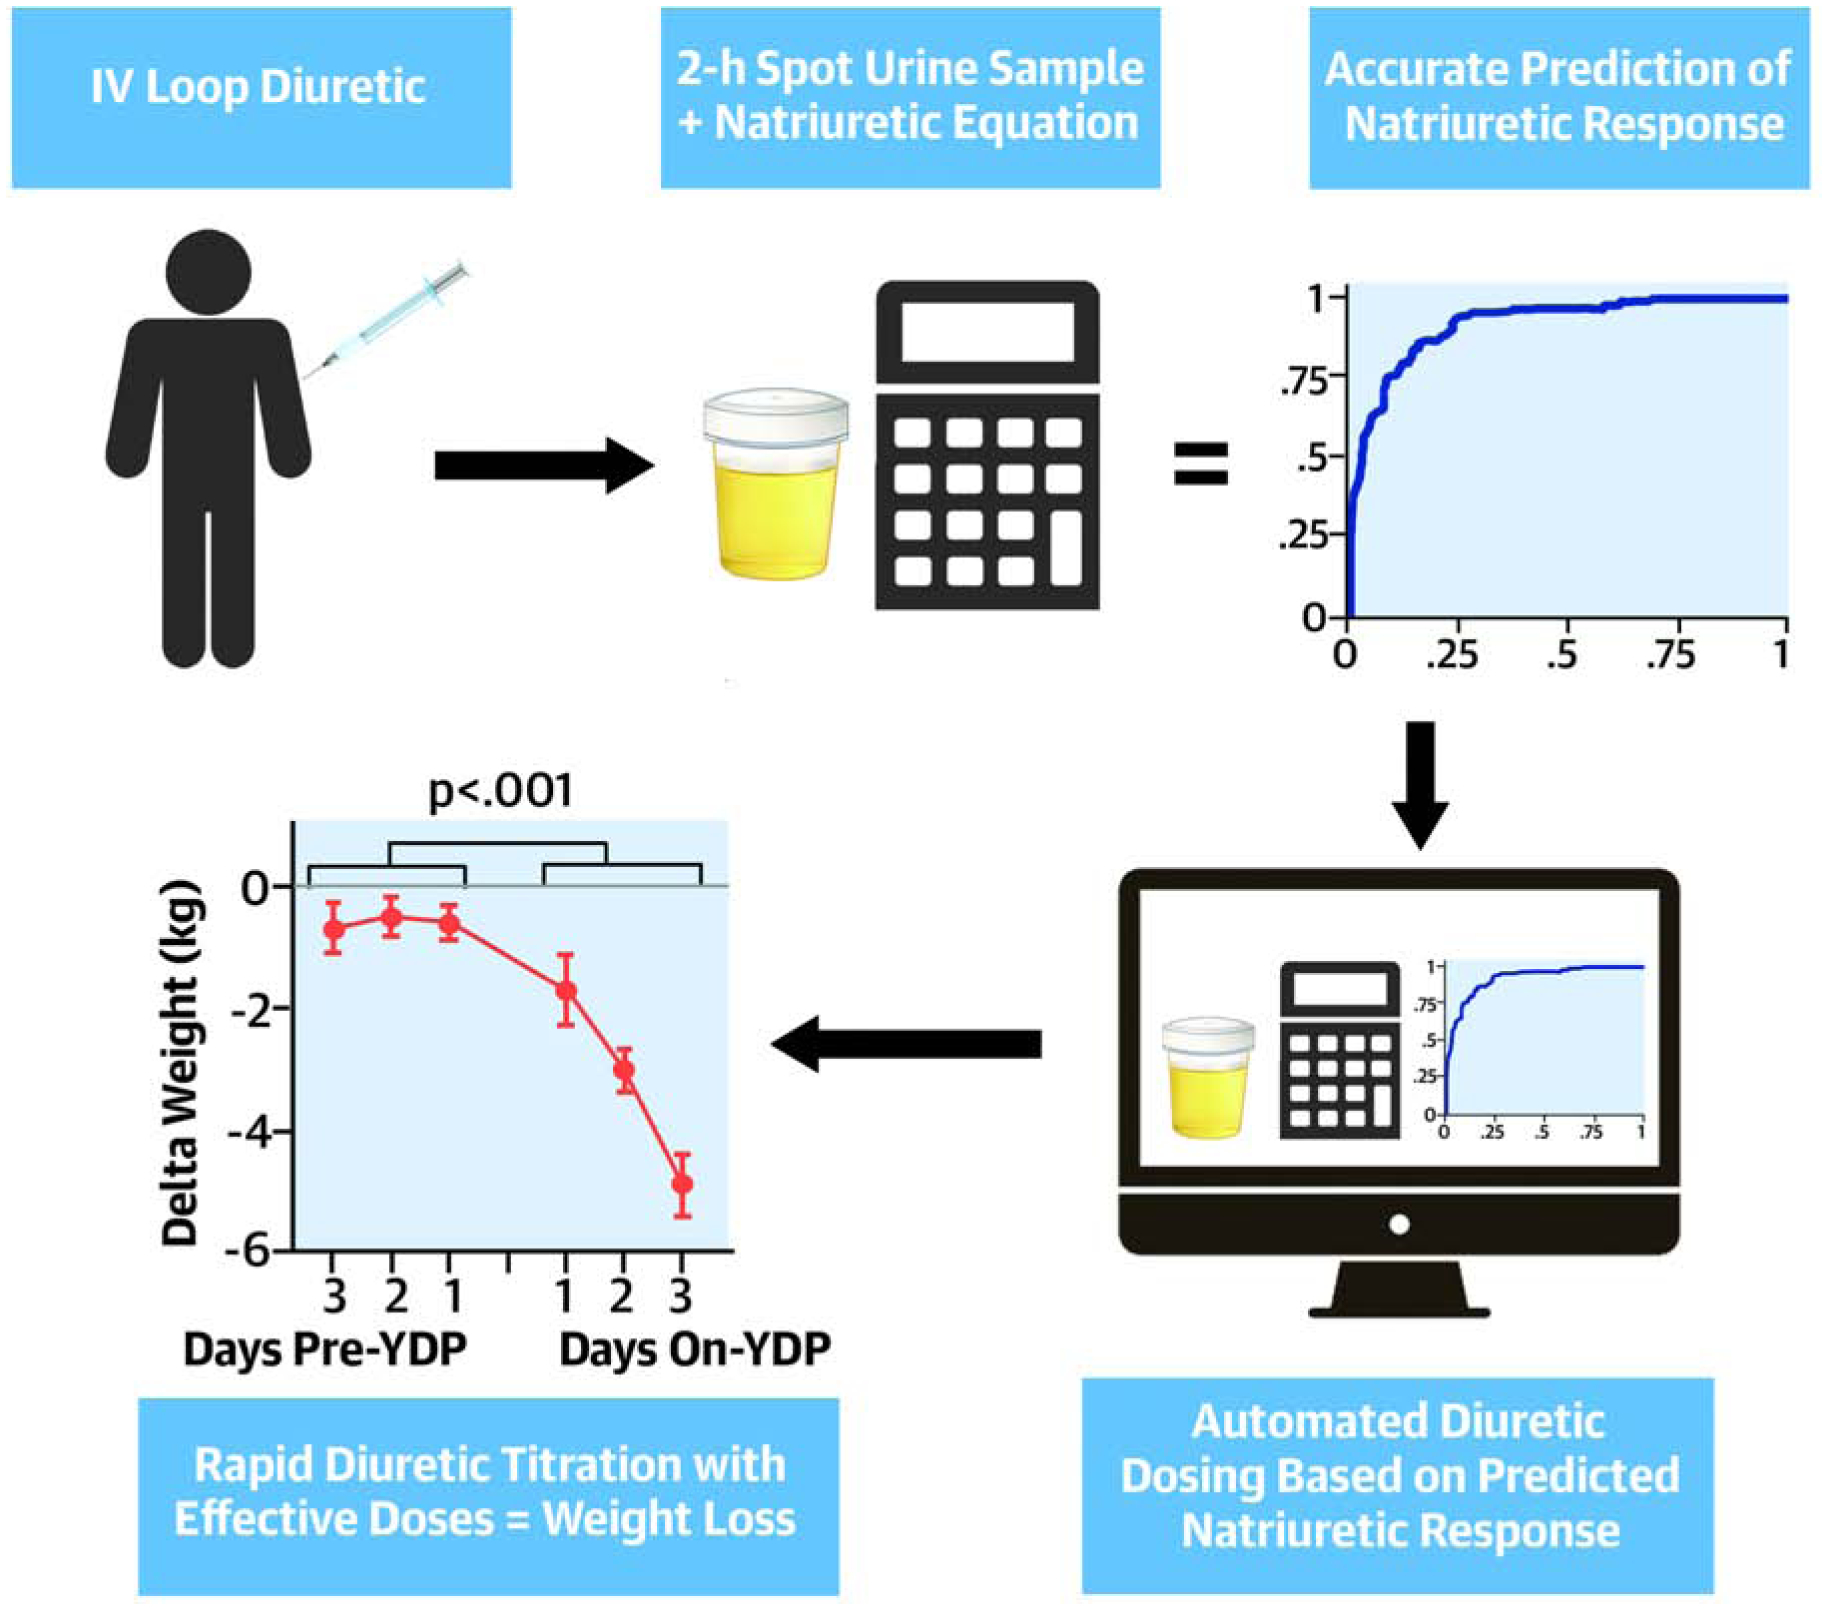
After a loop IV diuretic administration, the natriuretic response prediction equation using a 2-hour spot urine sample rapidly and accurately predicted poor natriuretic response. When this equation was incorporated into an automated diuretic titration protocol a rapid and well tolerated decongestion was observed.
It is widely accepted that fluid balance and weight loss are challenging metrics to accurately obtain in clinical practice. These limitations have been qualitatively acknowledged in the guidelines and have been documented in the literature.(5,8,10–14) Importantly, due to issues such as an inability to stand for to be weighed or urinary incontinence, these parameters are often unavailable in over a quarter of patients in clinical practice.(14) When the data is available, it is often not possible to accurately capture all the fluid intake/output 24 hours a day and ensure weights are obtained under the same conditions (i.e., same scale, time of day, in relation to meals and bowel movements, telemetry boxes, shoes/clothes, etc). Notably, the correlation between fluid and weight loss, two parameters that should correlate almost perfectly, is known to be limited.(5) In the Diuretic Optimization Strategies Evaluation (DOSE) trial, an NIH funded trial of diuretic strategies conducted at HF centers of excellence, the correlation between fluid and weight loss was r=0.55 (r2=0.3). This correlation indicates there is approximately 70% discrepancy between the information provided by these two metrics. In the present study, we observed that the 2-hour intensively supervised urine collections performed similar to the NRPE. This finding could indicate that urine volume per se is not a poor predictor, particularly over short intervals, but urine collection in clinical practice is often of low fidelity and incomplete. Importantly, the reported urine collections were conducted by a study coordinator dedicated specifically to urine collection during the study visit. These dedicated resources are not available in routine clinical practice, thus likely explaining the discrepancy. Therefore, our experience has been that it is much simpler to obtain a single spot urine sample after diuretic dosing; even bed bound patients that are largely incontinent can usually provide a spot sample.
On the backdrop of the literature demonstrating limitations of fluid and weight loss, evidence is accumulating about the importance of monitoring sodium excretion in ADHF. Although different metrics to capture sodium output have been used, results have been strongly consistent. Compared to those with relatively poor natriuresis, increased natriuresis in patients with ADHF is associated with improved outcomes (9,23–29). Notably, even in the setting of a negative fluid balance a positive sodium balance predicts worse survival (23). A recent state-of-the-art review and a position statement from the European Society of Cardiology recommended early evaluation of sodium excretion in patients with ADHF to guide diuretic dosing.(12,30) The current data suggest spot urine chemistries using the NRPE has utility to guide ADHF care in a real-world setting. Given the theoretical advantages provided by improved accuracy in quantitating diuretic effects, monitoring sodium rather than fluid, and the rapidity with which diuretics can be titrated to effective doses, it is possible that strategies such as the NRPE/YDP could significantly improve ADHF outcomes. Prospective randomized clinical trials will be required to prove this hypothesis.
One drawback of an approach such as the NRPE/YDP is the requirement of serial urine sodium and creatinine concentrations to be measured, adding cost to an ADHF hospitalization. Urine sodium costs $5.06 and urine creatinine $5.18, per the 2020 CMS fee schedule for laboratory services, thus the incremental cost would be small. However, this cost could be easily offset by reducing the substantial personnel burden of calculating and documenting fluid intake and output or obtaining accurate daily weights if the NRPE were to replace one of those metrics. Additionally, given the ability of the NRPE/YDP to more rapidly titrate diuretics, which often takes multiple days or never occurs in practice, reductions in length of stay may be possible. We observed in the present study that subjects with a low natriuretic response received similar diuretic doses but had a worse kidney function, suggesting that clinicians find it difficult to dose when renal function is impaired. Therefore, rapid diuretic titration with the NRPE/YDP could potentially overcome diuretic under dosing with rapid up-titration. Again, prospective study will be required to evaluate this.
Study limitations
Although substantial cost and effort was put toward obtaining highly accurate, intensely supervised and timed urine collections, the “gold standard” of a non-catheterized timed urine collection being conducted in the real world ADHF setting is not perfect. However, this was necessary as urinary catheterization would have both introduced risk and hindered our ability to develop an approach that did not require catheterization. As shown in the Supplemental Table 4, the NRPE performed similarly well in patients with and without perfect urine collections, including in challenging subsets such as those with significant bladder dysfunction. Due to the intensive personnel requirement to perform the supervised timed urine collections, this study was executed at two hospitals from the same institution. Although likely not practical to validate the accuracy of the sodium equation in a large multicenter setting, it will be important to test the impact of NRPE/YDP on clinical outcomes outside of the Yale system and ideally in a multicenter population. The YDP cohort lacked specific inclusion/exclusion criteria, therefore, additional research is critically important to identify proper patient selection. The YDP protocol was not initialized at admission in all patients; however, the YDP protocol appeared to be effective when it was initiated in both the early and late initiations. The YDP intervention was set to a goal sodium output of 370 mmol in the majority of patients (97.5%), and although we observed signs of decongestion, additional research is needed to determine the optimal sodium output goals. Parameters of decongestion such as change in NT-proBNP were not systematically assessed in the YDP cohort; thus, other than weight change and hemoconcentration we cannot show that the YDP intervention improved decongestion. Lastly, the YDP cohort lacked a control group for comparison; thus, even though strong signals of efficacy and safety were observed when patients were started on the YDP, we cannot assume causality. Thus, a rigorous controlled prospective investigation will be critical.
Conclusions
In ADHF patients undergoing IV loop diuretic therapy, natriuretic response can be rapidly and accurately predicted using a 2-hour post-diuretic spot urine sample. The NRPE predicted sodium output, outperformed clinically obtained net fluid output and resulted in data available fast enough to allow real-time diuretic titration. Incorporating the NRPE into an automated nurse driven diuretic titration protocol resulted in rapid diuretic titration and what appeared to be safe and effective decongestion. Further research is warranted to understand if this strategy can improve post discharge outcomes.
Supplementary Material
Clinical Perspectives.
Competency in Medical Knowledge:
Natriuretic response can be rapidly and accurately predicted using a 2-hour post-diuretic spot urine sample in patients with acutely decompensated heart failure treated with IV loop diuretics. The natriuretic response equation outperforms clinical parameters and facilitates therapeutic titration of diuretic dosage.
Translational Outlook:
Randomized trials are warranted to compare automated diuretic titration utilizing the natriuretic response equation with conventional management in patients with decompensated heart failure of various etiologies.
Acknowledgments:
We would like to thank Yale New Haven Hospital Heart and Vascular Center nurses, pharmacists, and leadership in their participation in the research developing the NRPE and implementing it in the YDP.
Sources of funding
National Institutes of Health (NIH) K23HL114868, L30HL115790, R01HL139629, R21HL143092, R01HL128973, R01HL148354 (to JMT.); R01DK113191 and P30DK079210 (to FP); and 5T32HL007950 (to MG) Grants. The funding source had no role in study design, data collection, analysis, or interpretation. The contents of this manuscript are solely the responsibility of the authors and do not necessarily represent the official view of NIH.
ABBREVIATION LIST
- ADHF
Acute decompensated heart failure
- AUC
area under the curve
- BSA
body surface area
- CI
Confidence interval
- CKD-EPI
Chronic Kidney Disease Epidemiology Collaboration
- FENa
Fractional excretion of sodium
- GFR
glomerular filtration rate
- MDR
Diagnosing and Targeting Mechanisms of Diuretic Resistance
- NRPE
Natriuretic response prediction equation
- YDP
Yale Diuretic Pathway
Footnotes
Publisher's Disclaimer: This is a PDF file of an unedited manuscript that has been accepted for publication. As a service to our customers we are providing this early version of the manuscript. The manuscript will undergo copyediting, typesetting, and review of the resulting proof before it is published in its final form. Please note that during the production process errors may be discovered which could affect the content, and all legal disclaimers that apply to the journal pertain.
Disclosures
Dr. Rao has a patent treatment of diuretic resistance (US20200079846A1) issued to Yale and Corvidia Therapeutics Inc. with royalties paid to Yale University; has (with Dr. Testani) a patent method for measuring renalase (WO2019133665A2) issued to Yale; and has received personal fees from Translational Catalyst. Dr. Riello has received consulting fees from Janssen, Johnson & Johnson, Pfizer, and Portola; and has served on advisory boards for AstraZeneca, Janssen, Johnson & Johnson, Medicure, and Portola. Ms. Mahoney has received personal fees from Sequana Medical. Dr. Collins has received grants from the NIH, Patient-Centered Outcomes Research Institute, Agency for Healthcare Research and Quality, and AstraZeneca; and has received personal fees from Ortho Clinical, Boehringer Ingelheim, Roche, and Relypsa Medical. Dr. Testani has (with Dr. Rao) a patent method for measuring renalase (WO2019133665A2) issued to Yale; has received personal fees from Reprieve Medical, AstraZeneca, Novartis, Cardionomic, Bayer, MagentaMed, W.L. Gore, and Windtree Therapeutics; has received grants and personal fees from Bristol Myers Squibb, 3ive Labs, Boehringer Ingelheim, Sanofi, and FIRE1; has received grants from Otsuka, Abbott, and Merck outside of the submitted work; and has patents for treating diuretic resistance filed and issued. All other authors have reported that they have no relationships relevant to the contents of this paper to disclose.
References
- 1.Gheorghiade M, Filippatos G, De Luca L, Burnett J. Congestion in acute heart failure syndromes: an essential target of evaluation and treatment. Am J Med 2006;119:S3–S10. [DOI] [PubMed] [Google Scholar]
- 2.Gheorghiade M, Follath F, Ponikowski P et al. Assessing and grading congestion in acute heart failure: a scientific statement from the acute heart failure committee of the heart failure association of the European Society of Cardiology and endorsed by the European Society of Intensive Care Medicine. Eur J Heart Fail 2010;12:423–33. [DOI] [PubMed] [Google Scholar]
- 3.Gheorghiade M, Pang PS. Acute heart failure syndromes. J Am Coll Cardiol 2009;53:557–573. [DOI] [PubMed] [Google Scholar]
- 4.Gheorghiade M, Vaduganathan M, Fonarow GC, Bonow RO. Rehospitalization for Heart Failure: Problems and Perspectives. J Am Coll Cardiol 2012. [DOI] [PubMed] [Google Scholar]
- 5.Ambrosy AP, Cerbin LP, Armstrong PW et al. Body Weight Change During and After Hospitalization for Acute Heart Failure: Patient Characteristics, Markers of Congestion, and Outcomes: Findings From the ASCEND-HF Trial. JACC Heart failure 2017;5:1–13. [DOI] [PMC free article] [PubMed] [Google Scholar]
- 6.Brisco MA, Zile MR, Hanberg JS et al. Relevance of Changes in Serum Creatinine during a Heart Failure Trial of Decongestive Strategies: Insights From the DOSE Trial. J Card Fail 2016. [DOI] [PMC free article] [PubMed] [Google Scholar]
- 7.Guyton AC, Hall JE. Textbook of medical physiology. Philadelphia: Saunders, 2000. [Google Scholar]
- 8.Hodson D, Griffen M, Mahoney D et al. Natriuretic Response Is Highly Variable and Associated With 6-Month Survival: Insights From the ROSE-AHF Trial. JACC Heart failure 2019;In Press. [DOI] [PMC free article] [PubMed] [Google Scholar]
- 9.Verbrugge FH, Nijst P, Dupont M, Penders J, Tang WH, Mullens W. Urinary composition during decongestive treatment in heart failure with reduced ejection fraction. Circulation Heart failure 2014;7:766–72. [DOI] [PubMed] [Google Scholar]
- 10.Lindenfeld J, Albert NM, Boehmer JP et al. HFSA 2010 Comprehensive Heart Failure Practice Guideline. J Card Fail 2010;16:e1–194. [DOI] [PubMed] [Google Scholar]
- 11.Yancy CW, Jessup M, Bozkurt B et al. 2013 ACCF/AHA guideline for the management of heart failure: a report of the American College of Cardiology Foundation/American Heart Association Task Force on Practice Guidelines. J Am Coll Cardiol 2013;62:e147–239. [DOI] [PubMed] [Google Scholar]
- 12.Mullens W, Damman K, Testani JM et al. Evaluation of kidney function throughout the heart failure trajectory - a position statement from the Heart Failure Association of the European Society of Cardiology. Eur J Heart Fail 2020;22:584–603. [DOI] [PubMed] [Google Scholar]
- 13.Ponikowski P, Voors AA, Anker SD et al. 2016 ESC Guidelines for the diagnosis and treatment of acute and chronic heart failure: The Task Force for the diagnosis and treatment of acute and chronic heart failure of the European Society of Cardiology (ESC). Developed with the special contribution of the Heart Failure Association (HFA) of the ESC. Eur J Heart Fail 2016;18:891–975. [DOI] [PubMed] [Google Scholar]
- 14.Testani JM, Brisco MA, Kociol RD et al. Substantial Discrepancy Between Fluid and Weight Loss During Acute Decompensated Heart Failure Treatment. Am J Med 2015;128:776–83.e4. [DOI] [PMC free article] [PubMed] [Google Scholar]
- 15.Testani JM, Hanberg JS, Cheng S et al. Rapid and Highly Accurate Prediction of Poor Loop Diuretic Natriuretic Response in Patients With Heart Failure. Circ Heart Fail 2016;9:e002370. [DOI] [PMC free article] [PubMed] [Google Scholar]
- 16.Cox ZL, Rao V, Ivey-Miranda JB, Fleming J, Testani J. Mechanisms of Diuretic Resistance Study: Design and Rationale. ESC Heart Fail 2020;In Press. [DOI] [PMC free article] [PubMed] [Google Scholar]
- 17.Du Bois D, Du Bois EF. A formula to estimate the approximate surface area if height and weight be known. 1916. Nutrition (Burbank, Los Angeles County, Calif) 1989;5:303–11; discussion 312–3. [PubMed] [Google Scholar]
- 18.Levey AS, Stevens LA, Schmid CH et al. A new equation to estimate glomerular filtration rate. Ann Intern Med 2009;150:604–12. [DOI] [PMC free article] [PubMed] [Google Scholar]
- 19.Brater DC, Day B, Burdette A, Anderson S. Bumetanide and furosemide in heart failure. Kidney Int 1984;26:183–9. [DOI] [PubMed] [Google Scholar]
- 20.Vargo DL, Kramer WG, Black PK, Smith WB, Serpas T, Brater DC. Bioavailability, pharmacokinetics, and pharmacodynamics of torsemide and furosemide in patients with congestive heart failure. Clin Pharmacol Ther 1995;57:601–9. [DOI] [PubMed] [Google Scholar]
- 21.Rao VS, Planavsky N, Hanberg JS et al. Compensatory Distal Reabsorption Drives Diuretic Resistance in Human Heart Failure. J Am Soc Nephrol 2017;28:3414–3424. [DOI] [PMC free article] [PubMed] [Google Scholar]
- 22.Testani JM. [17th Dec 2020];Diuretic response calculator. Available at: http://www.CardioRenalResearch.net, Accessed. [Google Scholar]
- 23.Ferreira JP, Girerd N, Medeiros PB et al. Spot urine sodium excretion as prognostic marker in acutely decompensated heart failure: the spironolactone effect. Clin Res Cardiol 2016;105:489–507. [DOI] [PubMed] [Google Scholar]
- 24.Honda S, Nagai T, Nishimura K et al. Long-term prognostic significance of urinary sodium concentration in patients with acute heart failure. Int J Cardiol 2018;254:189–194. [DOI] [PubMed] [Google Scholar]
- 25.Brinkley DM Jr., Burpee LJ, Chaudhry SP et al. Spot Urine Sodium as Triage for Effective Diuretic Infusion in an Ambulatory Heart Failure Unit. J Card Fail 2018;24:349–354. [DOI] [PubMed] [Google Scholar]
- 26.Luk A, Groarke JD, Desai AS et al. First spot urine sodium after initial diuretic identifies patients at high risk for adverse outcome after heart failure hospitalization. Am Heart J 2018;203:95–100. [DOI] [PubMed] [Google Scholar]
- 27.Collins SP, Jenkins CA, Baughman A et al. Early urine electrolyte patterns in patients with acute heart failure. ESC Heart Fail 2019;6:80–88. [DOI] [PMC free article] [PubMed] [Google Scholar]
- 28.Biegus J, Zymlinski R, Sokolski M et al. Serial assessment of spot urine sodium predicts effectiveness of decongestion and outcome in patients with acute heart failure. Eur J Heart Fail 2019;21:624–633. [DOI] [PubMed] [Google Scholar]
- 29.Damman K, Ter Maaten JM, Coster JE et al. Clinical importance of urinary sodium excretion in acute heart failure. Eur J Heart Fail 2020. [DOI] [PMC free article] [PubMed] [Google Scholar]
- 30.Felker GM, Ellison DH, Mullens W, Cox ZL, Testani JM. Diuretic Therapy for Patients With Heart Failure: JACC State-of-the-Art Review. J Am Coll Cardiol 2020;75:1178–1195. [DOI] [PubMed] [Google Scholar]
Associated Data
This section collects any data citations, data availability statements, or supplementary materials included in this article.


