

Abstract
Background:
Exposure to environmental chemicals may play a role in the development of obesity. Evidence suggests phthalate exposure may be associated with obesity in children and adults.
Objective:
To examine the association of ten urinary phthalate metabolites mono-n-butyl phthalate (MnBP), mono-ethyl phthalate (MEP), mono-isobutyl phthalate (MiBP), mono-2-ethyl-5-carboxypentyl phthalate (MECPP), mono-2-ethyl-5-hydroxyhexyl phthalate (MEHHP), mono-(2-ethyl-5-oxohexyl) phthalate (MEOHP), mono-2-ethylhexyl phthalate (MEHP), mono-benzyl phthalate (MBzP), mono-(carboxylnonyl) phthalate (MCNP), and mono-(carboxyoctyl) phthalate (MCOP) grouped by molecular weight of their parent compounds with body weight outcomes in children, adolescent and adult participants in the National Health and Nutrition Examination Survey (NHANES) 2007–2010.
Methods:
We performed multinomial logistic regression to analyze the association between obesity and urinary phthalate metabolite concentrations in children and adolescents and adults.
Results:
Low molecular weight (LMW) phthalate metabolites (MnBP, MEP and MiBP) are significantly (p < 0.05) associated with higher odds for obesity in male children and adolescents. High molecular weight (HMW) phthalate metabolites (MECPP, MEHHP, MEOHP, MEHP, MBzP, MCNP, and MCOP) and di-2-ethylhexyl phthalate (DEHP) metabolites (MEHHP, MEOHP, MEHP and MECPP) are significantly (p < 0.05) associated with higher OR for obesity in all adults. Additionally, DEHP metabolites are significantly associated with obesity in all female adults; whereas DEHP and HMW metabolites are significantly associated with OR for obesity in males 60 years and older.
Conclusions:
We found age and sex differences in the association between urinary phthalate metabolite concentrations and body weight outcomes. Reverse causation cannot be excluded since overweight and obese people will have more fat mass, they may store more phthalates, thus leading to higher excretion concentrations.
Keywords: Phthalates, Obesity, Children, Adolescents, Adults
Introduction
Two-thirds of the United States population is either overweight or obese, and the prevalence of obesity in adults increased from 14.5% in NHANES I (1972–1974) to 35.1% in NHANES 2005–2006 (http://www.cdc.gov/nchs/data/hestat/overweight/overweight_adult.pdf). Given that more than 80% of obese adolescents become obese adults (Schonfeld-Warden and Warden, 1997) and that the prevalence of obesity in children and adolescents has nearly tripled from NHANES I to NHANES 2007–2008 (http://www.cdc.gov/nchs/data/hestat/obesity_child_07_08/obesity_child_07_08.pdf), adolescents and children represent a growing focus in this epidemic. Many health effects have been associated with obesity including diabetes, hypertension, and nonalcoholic fatty liver disease (Schonfeld-Warden and Warden, 1997). Thus, this increase in obesity is a major public health concern. The rise in obesity coincides with increased exposure to persistent environmental toxins, particularly those that are defined as endocrine disrupting chemicals (EDCs). Recently, Grun and Blumberg (2006) coined the term ‘obesogens’ to identify certain EDCs that promote obesity by acting on fat cells. Prenatal exposure to these obesogens may be an important risk factor for childhood and adult obesity (Janesick and Blumberg, 2011).
Phthalates are considered EDCs and have been used as plasticizers in a wide range of products including vinyl flooring, automotive plastics, and personal-care products such as soaps, shampoos and nail polishes (ATSDR, 2001, 2002). Children are at an especially high risk of exposure as phthalates are used in the manufacturing of many children’s toys (ATSDR, 2001, 2002). Recently, there have been increased regulations regarding the use of phthalates in children’s toys; however, with detectable measures of phthalate metabolites still being found in over 60% of the population aged 6–19, a focus on the health impacts in children warrants attention (NHANES 2007–2010). DEHP is the most widely used plasticizer and is used in polyvinyl chloride (PVC) due to its low cost (ATSDR, 2001, 2002). Several recent studies have looked at the association between phthalate exposure and obesity, though the results from these studies are conflicting.Trasande et al. (2013) found an association between urinary LMW phthalate metabolites and increased BMI z-score and rate of obesity, using NHANES 2003–2008; this association was limited to the subpopulation of non-Hispanic blacks. Similarly, Hatch et al. (2008), using NHANES 1999–2002, found a positive association between mono-ethyl phthalate (MEP), a low molecular weight phthalate metabolite, and BMI in adult males as well as in adolescent and adult females. However, the researchers also found a significant inverse relationship between mono-butyl phthalate (MnBP), a low molecular weight phthalate metabolite, and BMI and waist circumference among 60–80 year olds (Hatch et al., 2008). Teitelbaum et al. (2012) did a longitudinal study and found an association between MEP and LMW phthalate metabolites with BMI and waist circumference in New York City Hispanic and Black children. Due to their ubiquitous nature in our environment and the conflicting results observed in previous studies, phthalates and their potential action as endocrine disruptors merit further study. Therefore, the objective of this study was to investigate the correlation between urinary LMW phthalate metabolites, HMW phthalate metabolites, and DEHP metabolites, as well as each individual phthalate metabolite, with obesity using data from NHANES 2007–2010 in children and adolescents (6–19 years old) and in adults (20 years and older).
Methods
Study population
NHANES are cross-sectional, nationally representative surveys of the non-institutionalized civilian population of the United States conducted by the National Center for Health Statistics (NCHS), CDC (NCHS, 2008a). Beginning in 1999, the survey was conducted continuously and data was released in 2-year cycles. For our study, we merged the publicly available files for NHANES cycles 2007–2008 and 2009–2010 using the NCHS recommendations (NCHS, 2008b). The survey employs a multistage stratified probability sample based on selected counties, blocks, households, and persons within households.
NCHS-trained professionals conducted interviews in participants’ homes and extensive physical examinations, which included blood and urine collection, were conducted at mobile exam centers. In the 2007–2008 and 2009–2010 data set, urinary metabolites of phthalates were measured in a randomly selected one-third subsample of persons 6 years and older by the CDC’s National Center for Environmental Health (NCEH), Division of Laboratory Sciences (DLS) which coordinates the National Biomonitoring Program (NBP) to assess nutritional status and the exposure of the U.S. population to environmental chemicals and toxic substances. For our analysis, we included participants who had measurements for phthalate metabolites. Pregnant women and women breastfeeding were excluded, as well as participants with missing covariates (e.g. caloric intakes, poverty income ratio, etc.) included in the multivariable-adjusted models.
Urinary biomarkers
Spot urine samples were collected from study participants and stored at −20 °C until analysis. The urine samples were analyzed by NCEH DLS for several phthalate metabolites, and only those that were detected in at least 80% of the sample were used in our analyses: mono-n-butyl phthalate (MnBP), a metabolite of di-n-butyl phthalate (DBP); mono-ethyl phthalate (MEP), a metabolite of diethyl phthalate (DEP); mono-isobutyl phthalate (MEP), a metabolite of di-iso-butyl phthalate (DiBP); mono-2-ethyl-5-carboxypentyl phthalate (MECPP), mono-2-ethyl-5-hydroxyhexyl phthalate (MEHHP), mono-(2-ethyl-5-oxohexyl) phthalate (MEOHP), and mono-2-ethylhexyl phthalate (MEHP), metabolites of DEHP; mono-benzyl phthalate (MBzP), a metabolite of butylbenzyl phthalate (BBzP); mono-(carboxynonyl) phthalate (MCNP), a metabolite of di-iso-decyl phthalate (DiDP); and mono-(carboxyoctlyl) phthalate (MCOP), a metabolite of di-iso-nonyl phthalate (DiNP).
These compounds were measured by solid phase extraction coupled on-line to high performance liquid chromatography and tandem mass spectrometry. Urinary concentrations of the metabolites below the level of detection were assigned the limit of detection divided by the square root of 2, as recommended by NHANES (NCHS, 2007).
To account for variation in dilution in spot urinary samples, urinary creatinine was entered in the analyses as an independent variable as suggested by previous studies (Barr et al., 2005; Ikeda et al., 2003).
Obesity outcome
BMI is calculated by the weight divided by height squared (kg/m2). However, since the relation between BMI and body weight in children depends on age and sex, it is more appropriate to calculate the BMI z-score. The BMI z-score is the number of standard deviations by which a child differs from the mean BMI of children of the same age and sex. Thus, the BMI z-score allows comparison of children of different ages and sex. The BMI z-scores were calculated using the methodology provided by the CDC (http://www.cdc.gov/nccdphp/dnpao/growthcharts/resources/sas.htm).
BMI z-score was then used to classify individuals as overweight and obese, defined as BMI greater than or equal to the 95th percentile (obesity) or between the 85th and less than the 95th percentile (overweight).
The adult population (aged ≥20) was classified as overweight and obese with BMI measures of 25–29.9 and ≥30, respectively.
Covariates
In the models for children and adolescents, we adjusted for a priori covariates (Trasande et al., 2013): age, race/ethnicity, sex, urinary creatinine, poverty income ratio (PIR), calorie intake, and serum cotinine as a biomarker of exposure to environmental tobacco smoke. Race/ethnicity was categorized as non-Hispanic white, non-Hispanic black, Mexican-American, other Hispanic, and other. PIR is a measure of socioeconomic status and represents the calculated ratio of household income to the poverty threshold after accounting for inflation and family size. Caloric intake was categorized as “normal” and “excessive” based on the US Department of Agriculture calorie intake guidelines by age and sex (http://health.gov/dietaryguidelines/dga2010/DietaryGuidelines2010.pdf). The individual cut-off caloric need was the highest value for the range by age and sex assuming a moderate physical activity level. The caloric intake is the average of total caloric intake in the first and second day as reported in the dietary data of the corresponding NHANES cycles.
In the models for adults, we adjusted for a priori covariates (Hatch et al., 2008): age (categorized in weighted quartile), sex, race/ethnicity, education, diabetes, alcohol consumption, cigarette smoking, calorie intake, moderate and vigorous recreational activities, urinary creatinine and serum cotinine. We obtained information about age (years), sex, race/ethnicity, and education from the household interview. Alcohol consumption (amount consumed per week) and smoking information (self-reported cigarette use categorized as current, former, and never) were obtained from the physical examination and associated questionnaire. Serum cotinine was categorized as weighted quartile.
Statistical methods
Sample weights were used for analyses to account for the complex sampling design and non-response of NHANES. Weights for combined NHANES survey cycles were calculated according to NHANES guidelines (NCHS, 2008c). We used the MULTILOG procedure in SUDAAN which implements the proportional odds model with a generalized multinomial logit model for nominal outcomes to produce separate parameter vectors for each of the generalized logit equations of interest. We used multinomial logistic regression to calculate adjusted odds ratios (ORs) for obesity or overweight status compared to normal/underweight in participants with urinary phthalate metabolites categorized by weighted quartile distribution. In addition to estimating associations for all observations combined, we performed separate analyses stratified by sex.
Urinary low molecular weight phthalates (LMW), high molecular weight phthalates (HMW) and di-2-ethylhexyl phthalate metabolites (DEHP) were categorized by weighted quartile distribution. The following groups were calculated, as suggested by Zota et al. (2014), by adding the concentration of each individual metabolite divided by its own molecular mass: LMW (sum of MnBP, MEP, and MIBP); HMW (sum of MECPP, MEHHP, MEOHP, MEHP, MBzP, MCNP, and MCOP); and DEHP (sum of MEHHP, MEOHP, MECPP, and MEHP). Analyses were also carried out using the weighted quartiles of each individual metabolite.
SAS 9.3 (SAS Institute, Cary, NC) was used for all statistical analyses and SAS-Callable SUDAAN 10 (Research Triangle Institute, Research Triangle Park, NC) was used to account for the NHANES complex sample design. p-Values from Satterthwaite statistics were presented at the significance level <0.05.
Results
Table 1 illustrates the weighted characteristics of participants aged 6–19 years from NHANES 2007–2010 included in this study. The mean age of the participants was approximately 12 years and 51% were male. Non-Hispanic whites accounted for 58.3% of the total study group; 14.2% were non-Hispanic blacks, and 13.5% were Mexican-American. Twenty-four percent of the participants were from families with income at or below the poverty level. The geometric mean (GM) and standard error (SE) for BMI and BMI z-score were 20.78 (0.13) kg/m2 and 0.78 (0.03), respectively. The geometric mean (SE) urinary concentrations of LMW phthalate metabolites, HMW phthalate metabolites, and DEHP metabolites were 0.54 (0.03) μmol/mL, 0.37 (0.02) μmol/mL, 0.24 (0.01) μmol/mL respectively. Table 1 shows also the geometric mean (SE) of the individual phthalate metabolites. Additionally, Table 1 shows the characteristics of the obese, overweight, and normal/underweight participants.
Table 1.
Weighted characteristics for children and adolescent (aged 6–19) participants in NHANES 2007–2010.
| All | Normal/underweight | Overweight | Obese | |
|---|---|---|---|---|
| Mono-n-butyl phthalate (MnBP) (ng/mL), GM (SE) | 23.00 (0.93) | 22.10 (1.01) | 22.22 (1.51) | 27.12 (2.02) |
| Mono-ethyl phthalate (MEP) (ng/mL), GM (SE) | 60.29 (3.41) | 53.94 (3.29) | 65.81 (6.59) | 81.85 (7.70) |
| Mono-isobutyl phthalate (MiBP) (ng/mL), GM (SE) | 10.43 (0.39) | 9.55 (0.44) | 11.24 (1.08) | 13.23 (0.62) |
| Mono-2-ethylhexyl phthalate (MEHP) (ng/mL), GM (SE) | 2.18 (0.11) | 2.20 (0.14) | 2.11 (0.19) | 2.16 (0.21) |
| Mono-benzyl phthalate (MBzP) (ng/mL), GM (SE) | 11.94 (0.63) | 11.10 (0.61) | 12.78 (1.23) | 14.48 (1.43) |
| Mono-2-ethyl-5-carboxypentyl phthalate (MECPP) (ng/mL), GM (SE) | 34.79 (1.66) | 34.10 (2.05) | 33.33 (2.69) | 38.62 (3.32) |
| Mono-2-ethyl-5-hydroxyhexyl phthalate (MEHHP) (ng/mL), GM (SE) | 21.03 (1.25) | 20.46 (1.47) | 20.86 (1.93) | 23.28 (2.28) |
| Mono-(2-ethyl-5-oxohexyl) phthalate (MEOHP) (ng/mL), GM (SE) | 12.92 (0.72) | 12.67 (0.85) | 12.66 (1.09) | 14.07 (1.45) |
| Mono (carboxynonyl) phthalate (MCNP), (ng/mL), GM (SE) | 3.08 (0.13) | 3.01 (0.14) | 2.98 (0.28) | 3.45 (0.24) |
| Mono (carboxyoctlyl) phthalate (MCOP), (ng/mL), GM (SE) | 12.43 (0.94) | 11.85 (0.92) | 12.28 (1.37) | 14.81 (1.84) |
| Low molecular weight (LMW) phthalates μmol/mL), GM (SE) | 0.54 (0.03) | 0.49 (0.03) | 0.58 (0.05) | 0.71 (0.05) |
| High molecular weight (HMW) phthalates μmol/mL), GM (SE) | 0.37 (0.02) | 0.36 (0.02) | 0.37 (0.03) | 0.43 (0.04) |
| Di-2-ethylhexyl phthalate (DEHP) metabolites μmol/mL), GM (SE) | 0.24 (0.01) | 0.24 (0.02) | 0.24 (0.02) | 0.27 (0.02) |
| Age (years), GM (SE) | 11.88 (0.10) | 11.89 (0.11) | 11.97 (0.23) | 11.79 (0.19) |
| BMI z-score, GM (SE) | 0.78 (0.03) | 0.37 (0.02) | 1.29 (0.01) | 2.06 (0.02) |
| BMI (kg/m2), GM (SE) | 20.78 (0.13) | 18.52 (0.08) | 23.18 (0.19) | 28.74 (0.28) |
| Serum cotinine (ng/mL), GM (SE) | 0.11 (0.01) | 0.10 (0.01) | 0.11 (0.02) | 0.19 (0.04) |
| Urinary creatinine (mg/dL), GM (SE) | 99.27 (2.49) | 96.88 (2.83) | 95.19 (5.38) | 112.48 (3.72) |
| Sex | ||||
| Male % (SE) | 50.71 (1.55) | 50.71 (1.55) | 47.31 (2.58) | 55.37 (2.51) |
| Female % (SE) | 49.29 (1.55) | 49.29 (1.55) | 52.69 (2.58) | 44.63 (2.51) |
| Income | ||||
| PIR ≤ 1 (indicating at or below poverty level) % (SE) | 21.63 (1.69) | 21.63 (1.69) | 23.28 (1.75) | 33.70 (2.90) |
| PIR > 1 (above poverty level). | 78.37 (1.69) | 78.37 (1.69) | 76.82 (1.75) | 66.30 (2.90) |
| Caloric intake | ||||
| Normal intake % (SE) | 66.48 (1.80) | 66.48 (1.80) | 73.86 (2.88) | 70.24 (2.57) |
| Excessive intake % (SE) | 33.52 (1.80) | 33.52 (1.80) | 26.14 (2.88) | 29.76 (2.57) |
| Race | ||||
| White (non-Hispanic) % (SE) | 62.18 (2.79) | 62.18 (2.79) | 52.82 (3.88) | 49.02 (4.42) |
| Non-Hispanic black % (SE) | 12.31 (1.19) | 12.31 (1.19) | 15.82 (1.88) | 19.88 (2.28) |
| Mexican-American % (SE) | 11.57 (1.82) | 11.57 (1.82) | 16.81 (2.33) | 17.93 (3.21) |
| Other Hispanic % (SE) | 5.89 (1.24) | 5.89 (1.24) | 6.17 (1.70) | 8.84 (2.01) |
| Other % (SE) | 8.05 (1.10) | 8.05 (1.10) | 8.37 (1.99) | 4.32 (1.11) |
Table 2 illustrates the weighted characteristics of participants aged 20 years and older from the NHANES 2007–2010 included in this study. The geometric mean age of the participants was approximately 44 years and 51.8% were female. Non-Hispanic whites accounted for 68.3% of the total study group; 11.3% were non-Hispanic blacks, 8.5% were Mexican-American, approximately 5% were other Hispanic, and 6.8% belong to other race/ethnicity or designated themselves as multiracial. Approximately 56%, 31%, and 54% of the people reported that they attended some college, never used alcohol, and never smoked, respectively.
Table 2.
Weighted characteristics for adults (≥20 years of age) in NHANES 2007–2010.
| All | Normal/underweight | Overweight | Obese | |
|---|---|---|---|---|
| Mono-n-butyl phthalate (MnBP) (ng/mL), GM (SE) | 15.21 (0.56) | 13.61 (0.88) | 14.43 (0.76) | 17.77 (0.69) |
| Mono-ethyl phthalate (MEP) (ng/mL), GM (SE) | 80.87 (3.11) | 65.85 (4.97) | 76.21 (4.61) | 102.42 (5.99) |
| Mono-isobutyl phthalate (MiBP) (ng/mL), GM (SE) | 6.75 (0.23) | 5.86 (0.35) | 6.43 (0.31) | 8.08 (0.30) |
| Mono-2-ethylhexyl phthalate (MEHP) (ng/mL), GM (SE) | 2.01 (0.10) | 1.97 (0.13) | 2.01 (0.11) | 2.02 (0.15) |
| Mono-benzyl phthalate (MBzP) (ng/mL), GM (SE) | 5.88 (0.25) | 5.15 (0.37) | 5.47 (0.30) | 7.12 (0.29) |
| Mono-2-ethyl-5-carboxypentyl phthalate (MECPP) (ng/mL), GM (SE) | 24.30 (1.20) | 20.26 (1.16) | 23.84 (1.48) | 29.00 (1.93) |
| Mono-2-ethyl-5-hydroxyhexyl phthalate (MEHHP) (ng/mL), GM (SE) | 15.86 (0.85) | 13.18 (0.87) | 15.52 (1.01) | 18.97 (1.30) |
| Mono-(2-ethyl-5-oxohexyl) phthalate (MEOHP) (ng/mL), GM (SE) | 9.16 (0.47) | 7.57 (0.50) | 9.08 (0.57) | 10.92 (0.71) |
| Mono (carboxynonyl) phthalate (MCNP), (ng/mL), GM (SE) | 2.54 (0.10) | 2.14 (0.12) | 2.60 (0.15) | 2.93 (0.15) |
| Mono (carboxyoctlyl) phthalate (MCOP), (ng/mL), GM (SE) | 8.59 (0.52) | 6.84 (0.55) | 8.69 (0.72) | 10.44 (0.67) |
| Low molecular weight (LMW) phthalates μmol/mL), GM (SE) | 0.61 (0.02) | 0.51 (0.04) | 0.57 (0.03) | 0.75 (0.04) |
| High molecular weight (HMW) phthalates μmol/mL), GM (SE) | 0.26 (0.01) | 0.22 (0.01) | 0.26 (0.01) | 0.31 (0.02) |
| Di-2-ethylhexyl phthalate (DEHP) metabolites μmol/mL), GM (SE) | 0.18 (0.01) | 0.15 (0.01) | 0.17 (0.01) | 0.21 (0.01) |
| Age (years), GM (SE) | 43.86 (0.42) | 40.60 (0.76) | 45.38 (0.58) | 45.29 (049) |
| BMI (kg/m2), GM (SE) | 28.02 (0.12) | 22.05 (0.05) | 27.29 (0.04) | 35.50 (0.14) |
| Serum cotinine (ng/mL), GM (SE) | 0.34 (0.04) | 0.54 (0.11) | 0.30 (0.04) | 0.25 (0.03) |
| Urinary creatinine (mg/dL), GM (SE) | 95.64 (1.43) | 81.85 (2.85) | 94.55 (2.02) | 110.97 (1.56) |
| Sex | ||||
| Male % (SE) | 48.21 (0.65) | 40.77 (1.63) | 55.01 (1.09) | 48.02 (1.38) |
| Female % (SE) | 51.79 (0.65) | 59.23 (1.63) | 44.99 (1.09) | 51.98 (1.38) |
| Caloric intake | ||||
| Normal intake % (SE) | 67.94 (1.05) | 67.41 (1.72) | 67.02 (1.67) | 68.86 (1.27) |
| Excessive intake % (SE) | 32.06 (1.05) | 32.59 (1.72) | 32.98 (1.67) | 31.14 (1.27) |
| Race | ||||
| White (non-Hispanic) % (SE) | 68.34 (2.62) | 71.36 (2.43) | 68.20 (2.97) | 65.63 (3.08) |
| Non-Hispanic black % (SE) | 11.35 (0.93) | 8.82 (0.64) | 9.28 (0.95) | 15.68 (1.61) |
| Mexican-American % (SE) | 8.54 (1.56) | 5.41 90.87) | 10.34 (1.93) | 9.71 (1.99) |
| Other Hispanic % (SE) | 4.96 (0.91) | 4.40 (0.85) | 5.42 (0.99) | 5.05 (1.03) |
| Other % (SE) | 6.81 (0.93) | 10.01 (1.55) | 6.76 (1.29) | 3.93 (0.60) |
| Smokers | ||||
| Current smoker % (SE) | 21.14 (0.90) | 27.11 (2.07) | 19.72 (1.17) | 17.30 (1.02) |
| Former smoker % (SE) | 24.77 (1.12) | 20.74 (1.12) | 25.11 (1.52) | 27.85 (1.58) |
| Never smoked % (SE) | 54.08 (1.45) | 52.15 (2.61) | 55.17 (1.57) | 54.85 (1.50) |
| Alcohol consumption | ||||
| No alcohol % (SE) | 30.60 (1.06) | 31.14 (1.39) | 28.42 (1.28) | 31.62 (1.26) |
| 1–4 drinks per week % (SE) | 61.79 (1.26) | 62.46 (1.48) | 63.80 (1.75) | 59.74 (1.72) |
| >4 drinks per week % (SE) | 7.61 (0.67) | 6.39 (0.85) | 7.78 (1.00) | 8.64 (0.98) |
| Education level | ||||
| Less than high school % (SE) | 19.28 (1.03) | 16.26 (1.46) | 20.76 (1.25) | 20.50 (1.26) |
| Completed high school % (SE) | 24.67 (1.00) | 23.96 (1.41) | 24.83 (1.87) | 25.40 (1.24) |
| More than high school % (SE) | 56.05 (1.43) | 59.77 (2.11) | 54.41 (1.87) | 54.10 (1.53) |
| Diabetes | ||||
| No % (SE) | 90.16 (0.43) | 97.00 (0.33) | 93.84 (0.64) | 81.05 (0.96) |
| Yes % (SE) | 9.84 (0.43) | 3.00 (0.33) | 6.16 (0.64) | 18.95 (0.96) |
| Moderate recreational activities | ||||
| Yes % (SE) | 43.51 (1.35) | 49.22 (2.11) | 43.68 (1.38) | 38.46 (1.88) |
| No % (SE) | 56.49 (1.35) | 50.78 (2.11) | 56.32 (1.38) | 61.54 (1.88) |
| Vigorous recreational activities | ||||
| Yes % (SE) | 23.41 (1.04) | 31.07 (2.11) | 23.88 (1.33) | 16.41 (1.06) |
| No % (SE) | 76.59 (1.04) | 68.93 (2.11) | 76.12 (1.33) | 83.59 (1.06) |
The geometric mean (SE) BMI was 28.02 (0.12) kg/m2. The geometric mean (SE) urinary concentrations of LMW phthalate metabolites, HMW phthalate metabolites, and DEHP metabolites were 0.61 (0.02) μmol/mL, 0.26 (0.01) μmol/mL, 0.18 (0.01) μmol/mL, respectively. Approximately 35.6% of the population was obese. Table 2 shows the geometric mean (SE) of the individual phthalate metabolites. Additionally, Table 2 shows the characteristics of the obese, overweight, and normal/underweight participants.
Children and adolescent (6–19 years old)
In multinomial logistic regressions, we found a statistically significant positive association between urinary concentrations of LMW phthalate metabolites and obesity in children and adolescents (Table 3). Compared to persons in the lowest LMW phthalate metabolite quartile, individuals in the second, third and highest LMW phthalate metabolite quartiles had a significantly higher adjusted ORs (aORs) for obesity [aOR = 2.96, 95% CI: 1.66, 5.30; aOR = 2.80, 95% CI: 1.60, 4.90, and aOR = 2.84, 95% CI: 1.40, 5.78, respectively]. This association was maintained in males upon stratification: compared to persons in the lowest LMW phthalate metabolite quartile, male children and adolescents in the second, third and highest LMW phthalate metabolite quartiles had significantly higher adjusted OR for obesity [aOR = 3.97, 95% CI: 2.23, 7.08; aOR = 3.13, 95% CI: 1.69, 5.81, and aOR = 5.39, 95% CI: 1.87, 15.53, respectively]. Analyses of the individual phthalate metabolite components of LMW found the association of obesity with the highest quartile of MEP compared to the referent in all CHA and in males [aOR = 2.05, 95% CI: 1.03, 4.09; and aOR = 3.49, 95% CI: 1.20, 10.17, respectively] (Table 3). Furthermore, in males, the highest quartile of MiBP was found to be statistically significantly associated with increased odds of obesity [aOR = 4.29, 95% CI: 1.32, 13.74] (Table 3). No association was found between urinary HMW phthalate metabolite or urinary DEHP metabolite concentrations and obesity (Table 3). However, analyses of individual metabolites found an association between the highest MBzP quartile with higher OR to be obese in CHA males (Table 3).
Table 3.
Multilogistic regression (OR and 95% CI) of obese and overweight with phthalate quartiies in children and adolescenta participants in NHANES 2007–2010.
| Children/adolescent |
Males children/adolescent |
Females children/adolescent |
||||
|---|---|---|---|---|---|---|
| Obese | Overweight | Obese | Overweight | Obese | Overweight | |
| LMW Quartile 1 | Ref | Ref | Ref | Ref | Ref | Ref |
| LMW Quartile 2 | 2.96 (1.66, 5.30) | 0.87 (0.41, 1.86) | 3.97 (2.23, 7.08) | 1.71 (0.67, 4.33) | 1.97 (0.61, 6.36) | 0.41 (0.15, 1.13) |
| LMW Quartile 3 | 2.80 (1.60, 4.90) | 1.24 (0.66, 2.35) | 3.13 (1.69, 5.81) | 1.99 (0.75, 5.24) | 2.41 (0.71, 8.20) | 0.75 (0.37, 1.52) |
| LMW Quartile 4 | 2.84 (1.40, 5.78) | 1.49 (0.59, 3.77) | 5.39 (1.87, 15.53) | 1.73 (0.46, 6.49) | 1.31 (0.57, 2.97) | 1.17 (0.48, 2.82) |
| HMW Quartile 1 | Ref | Ref | Ref | Ref | Ref | Ref |
| HMW Quartile 2 | 1.15 (0.60, 2.21) | 1.87 (0.95, 3.67) | 1.23 (0.57, 2.67) | 1.85 (0.63, 5.44) | 1.03 (0.40, 2.63) | 2.03 (0.79, 5.21) |
| HMW Quartile 3 | 1.22 (0.54, 2.77) | 1.56 (0.74, 3.29) | 1.46 (0.48, 4.48) | 2.14 (0.75, 6.07) | 1.00 (0.39, 2.58) | 1.11 (0.45, 2.71) |
| HMW Quartile 4 | 1.26 (0.49, 3.26) | 1.38 (0.63, 3.03) | 2.08 (0.66, 6.57) | 1.84 (0.61, 5.56) | 0.70 (0.27, 1.86) | 1.17 (0.39, 3.48) |
| DEHP Quartile 1 | Ref | Ref | Ref | Ref | Ref | Ref |
| DEHP Quartile 2 | 1.57 (0.79, 3.14) | 1.31 (0.62, 2.75) | 1.52 (0.60, 3.85) | 0.93 (0.44, 1.99) | 1.57 (0.64, 3.86) | 1.72 (0.62, 4.79) |
| DEHP Quartile 3 | 0.92 (0.44, 1.95) | 1.44 (0.69, 2.99) | 0.97 (0.36, 2.58) | 1.56 (0.60, 4.04) | 0.81 (0.34, 1.88) | 1.26 (0.54, 2.94) |
| DEHP Quartile 4 | 1.09 (0.48, 2.49) | 1.02 (0.44, 2.39) | 1.39 (0.47, 4.12) | 1.02 (0.34, 3.03) | 0.86 (0.36, 2.08) | 1.04 (0.36, 2.95) |
| 4th MnBP | 1.62 (0.54, 4.93) | 0.95 (0.51, 1.75) | 3.15 (0.90, 11.01) | 1.49 (0.62, 11.01) | 0.55 (0.15, 2.05) | 0.64 (0.27, 1.53) |
| 4th MiBP | 1.82 (0.73, 4.57) | 1.85 (0.78, 4.40) | 4.26 (1.32, 13.74) | 2.22 (0.78, 6.28) | 0.57 (0.18, 1.83) | 1.57 (0.58, 4.25) |
| 4th MEP | 2.05 (1.03, 4.09) | 1.87 (1.02, 3.44) | 3.49 (1.20, 10.17) | 1.59 (0.41, 6.16) | 1.17 (0.62, 2.20) | 1.97 (0.93, 4.20) |
| 4th MECPP | 0.96 (0.41, 2.24) | 1.11 (0.54, 2.30) | 1.10 (0.41, 2.96) | 1.22 (0.47, 3.14) | 0.85 (0.35, 2.05) | 1.07 (0.37, 3.11) |
| 4th MEHHP | 1.08 (0.51, 2.29) | 1.11 (0.50, 2.50) | 1.33 (0.49, 3.59) | 1.14 (0.36, 3.61) | 0.85 (0.38, 1.88) | 1.15 (0.46, 2.90) |
| 4th MEOHP | 1.07 (0.45, 2.58) | 1.35 (0.59, 3.08) | 1.78 (0.58, 5.49) | 1.71 (0.51, 5.75) | 0.60 (0.23, 1.53) | 1.16 (0.46, 2.93) |
| 4th MEHP | 0.84 (0.39, 1.80) | 0.84 (0.41, 1.72) | 1.33 (0.53, 3.30) | 0.90 (0.33, 2.46) | 0.48 (0.20, 1.15) | 0.84 (0.28, 2.48) |
| 4th MBzP | 2.15 (0.80, 5.57) | 1.50 (0.75, 3.02) | 3.99 (1.20, 13.23) | 3.23 (1.12, 9.34) | 0.84 (0.23, 3.06) | 1.01 (0.45, 2.24) |
| 4th MCNP | 0.84 (0.39, 1.81) | 0.98 (0.56, 1.71) | 0.65 (0.25, 1.70) | 0.82 (0.34, 2.01) | 1.12 (0.44, 2.89) | 1.28 (0.59, 2.78) |
| 4th MCOP | 1.34 (0.68, 2.66) | 1.19 (0.65, 2.19) | 1.61 (0.72, 3.59) | 1.61 (0.69, 3.78) | 1.16 (0.44, 3.10) | 1.06 (0.37, 3.01) |
Adjusted for age, race/ethnicity, calorie intake, serum cotinine, urinary creatinine, income level. Quartiles LMW μmol/mL): Q1: ≤0.26; Q2: 0.27–0.52; Q3: 0.53–1.10; Q4: >1.10. Quartiles HMW (μmol/mL): Q1: ≤0.19; Q2: 0.20–0.37; Q3: 0.38–0.73; Q4: >0.73. Quartiles DEHP μmol/mL): Q1: ≤0.12; Q2: 0.13–0.23; Q3: 0.24–0.45; Q4: >0.45. Quartiles MEP (ng/mL): Q1: ≤24.79; Q4: >142.12. Quartiles MnBP (ng/mL): Q1: ≤12.05; Q4: >47.54. Quartiles MiBp (ng/mL): Q1: ≤5.38; Q4: >20.84. Quartiles MECPP (ng/mL): Q1: ≤17.48; Q4: >63.79. Quartiles MEHHP (ng/mL): Q1: ≤9.54; Q4: >41.78. Quartiles MEOHP (ng/mL): Q1: ≤5.98; Q4: >24.66. Quartiles MEHP (ng/mL): Q1: ≤0.78; Q4: >4.00. Quartiles MBzP (ng/mL): Q1: ≤5.66; Q4: >27.58. Quartiles MCNP (ng/mL): Q1: ≤ 1.78; Q4: >5.42. Quartiles MCOP (ng/mL): Q1: ≤5.50; Q4: >26.09.
Adults (age 20 years and older)
Using multinomial logistic regression, a statistically significant higher OR for obesity was found for urinary DEHP metabolite concentrations for the fourth quartile compared to the lowest quartile in all adults [aOR = 1.62, 95% CI: 1.11, 2.37] (Table 4). This association was maintained in female adults upon stratification [aOR = 1.72, 95% CI: 1.09, 2.71] (Table 4). Among the individual metabolite components of DEHP, we found statistically significant higher OR for obesity associated with the highest quartiles of MECPP, MEHHP, and MEOHP in all participants. In the female subgroup, the 4th quartiles of MECPP and MEHHP were associated with higher OR to be obese (Table 4).
Table 4.
Multilogistic regression (OR and 95% CI) of obese and overweight with phthalate quartiles in adulta participants in NHANES 2007–2010.
| Adults |
Males |
Females |
||||
|---|---|---|---|---|---|---|
| Obese | Overweight | Obese | Overweight | Obese | Overweight | |
| LMW Quartile 1 | Ref | Ref | Ref | Ref | Ref | Ref |
| LMW Quartile 2 | 1.10 (0.74, 1.66) | 1.04 (0.73, 1.49) | 0.98 (0.58, 1.64) | 1.14 (0.73, 1.77) | 1.21 (0.76, 1.91) | 0.92 (0.56, 1.50) |
| LMW Quartile 3 | 1.05 (0.72, 1.54) | 0.93 (0.71, 1.23) | 1.12 (0.59, 2.11) | 1.23 (0.78, 1.95) | 1.05 (0.68, 1.61) | 0.73 (0.49, 1.10) |
| LMW Quartile 4 | 1.11 (0.77, 1.59) | 0.97 (0.69, 1.37) | 0.95 (0.57, 1.59) | 0.93 (0.53, 1.62) | 1.37 (0.83, 2.27) | 1.08 (0.64, 1.82) |
| HMW Quartile 1 | Ref | Ref | Ref | Ref | Ref | Ref |
| HMW Quartile 2 | 1.36 (0.99, 1.88) | 0.87 (0.58, 1.31) | 1.12 (0.71, 1.79) | 0.77 (0.50, 1.18) | 1.43 (0.97, 2.10) | 0.87 (0.48, 1.56) |
| HMW Quartile 3 | 1.59 (1.19, 2.13) | 1.10 (0.79, 1.54) | 1.26 (0.79, 2.00) | 0.86 (0.55, 1.33) | 1.77 (1.19, 2.63) | 1.32 (0.93, 1.88) |
| HMW Quartile 4 | 1.77 (1.26, 2.48) | 1.32 (0.90, 1.94) | 1.76 (1.09, 2.85) | 1.42 (0.83, 2.41) | 1.61 (0.97, 2.69) | 1.16 (0.65, 2.08) |
| DEHP Quartile 1 | Ref | Ref | Ref | Ref | Ref | Ref |
| DEHP Quartile 2 | 1.00 (0.72, 1.40) | 0.74 (0.53, 1.02) | 0.77 (0.51, 1.17) | 0.67 (0.44, 1.04) | 1.11 (0.70, 1.78) | 0.71 (0.43, 1.20) |
| DEHP Quartile 3 | 1.32 (0.94, 1.85) | 0.90 (0.67, 1.20) | 1.09 (0.69, 1.72) | 0.75 (0.52, 1.09) | 1.39 (0.89, 2.19) | 1.05 (0.73, 1.52) |
| DEHP Quartile 4 | 1.62 (1.11, 2.37) | 1.22 (0.89, 1.67) | 1.34 (0.78, 2.30) | 1.27 (0.80, 2.03) | 1.72 (1.09, 2.71) | 1.08 (0.64, 1.83) |
| 4th MnBP | 0.89 (0.65, 1.23) | 0.91 (0.63, 1.30) | 0.75 (0.42, 1.36) | 0.87 (0.50, 1.53) | 0.97 (0.54, 1.75) | 0.92 (0.56, 1.51) |
| 4th MiBP | 1.40 (0.90, 2.16) | 1.18 (0.79, 1.78) | 0.98 (0.57, 1.67) | 1.06 (0.60, 1.89) | 1.81 (0.94, 3.48) | 1.25 (0.66, 2.36) |
| 4th MEP | 1.19 (0.85, 1.67) | 1.11 (0.78, 1.56) | 1.08 (0.68, 1.71) | 1.20 (0.73, 1.95) | 1.44 (0.94, 2.19) | 1.08 (0.64, 1.82) |
| 4th MECPP | 1.85 (1.29, 2.64) | 1.26 (0.87, 1.84) | 1.60 (0.92, 2.78) | 1.32 (0.77, 2.27) | 1.96 (1.18, 3.26) | 1.15 (0.59, 2.24) |
| 4th MEHHP | 1.51 (1.07, 2.14) | 1.15 (0.87, 1.53) | 1.14 (0.71, 1.82) | 1.05 (0.68, 1.62) | 1.73 (1.07, 2.78) | 1.15 (0.73, 1.80) |
| 4th MEOHP | 1.44 (1.02, 2.05) | 1.28 (0.98, 1.69) | 1.28 (0.76, 2.15) | 1.47 (0.96, 2.27) | 1.46 (0.94, 2.29) | 1.07 (0.70, 1.65) |
| 4th MEHP | 0.84 (0.55, 1.29) | 1.02 (0.78, 1.34) | 0.99 (0.57, 1.74) | 1.27 (0.89, 1.83) | 0.74 (0.43, 1.27) | 0.88 (0.57, 1.38) |
| 4th MBzP | 1.09 (0.80, 1.47) | 0.88 (0.64, 1.21) | 0.97 (0.59, 1.58) | 0.89 (0.55, 1.43) | 1.06 (0.61, 1.83) | 0.78 (0.44, 1.37) |
| 4th MCNP | 1.78 (1.08, 2.94) | 1.50 (0.91, 2.48) | 2.18 (1.07, 4.45) | 1.64 (0.86, 3.14) | 1.40 (0.81, 2.42) | 1.41 (0.82, 2.42) |
| 4th MCOP | 1.75 (1.25, 2.47) | 1.46 (0.92, 2.31) | 1.50 (0.88, 2.58) | 1.52 (0.80, 2.91) | 1.97 (1.33, 2.92) | 1.38 (0.83, 2.30) |
Adjusted for age, gender, race/ethnicity, calorie intake, recreational activity, serum cotinine, education level, smoking status, alcohol intake, diabetes. Quartiles LMW μmol/mL): Q1: ≤0.24; Q2: 0.25–0.55; Q3: 0.56–1.38; Q4: >1.38. Quartiles HMW (μmol/mL): Q1: ≤0.13; Q2: 0.14–0.26; Q3: 0.27–0.54; Q4: >0.55. Quartiles DEHP (μmol/mL): Q1: ≤0.08; Q2: 0.09–0.17; Q3: 0.18–0.36; Q4: >0.36. Quartiles MEP (ng/mL): Q1: ≤27.74; Q4: >218.73. Quartiles MnBP (ng/mL):Q1: ≤7.69; Q4: >31.59. Quartiles MiBP (ng/mL): Q1: ≤3.49; Q4: >14.40. Quartiles MECPP (ng/mL): Q1: ≤11.03; Q4: >49.07. Quartiles MEHHP (ng/mL): Q1: ≤6.79; Q4: >34.00. Quartiles MEOHP (ng/mL): Q1: ≤4.19; Q4: >19.50. Quartiles MEHP (ng/mL): Q1: ≤0.78; Q4: >4.24. Quartiles MBzP (ng/mL): Q1: ≤2.66; Q4: >143.04. Quartiles MCNP (ng/mL): Q1: ≤1.24; Q4: >4.91. Quartiles MCOP (ng/mL): Q1: ≤3.46; Q4: >20.59.
We found that the third and fourth quartiles of urinary HMW phthalate metabolite concentrations were associated with a significantly higher ORs for obesity [aOR = 1.59, 95% CI: 1.19, 2.13; and aOR = 1.77, 95% CI: 1.26, 2.48, respectively] (Table 4). After stratification by sex, we found that this association was maintained for males in the highest HMW quartile [aOR = 1.76, 95% CI: 1.09, 2.85]; whereas, in females, the association between HMW and higher OR for obesity was found in the third quartile [aOR = 1.77, 95% CI: 1.19, 2.63] (Table 4). Analyses of individual metabolites found that in addition to the DEHP metabolites that reached significance, the highest quartiles of MCNP and MCOP were statistically significantly associated with higher OR for obesity in all adults. After stratification by sex, MCNP remained statistically significantly associated only in males while MCOP remained statistically significantly associated in females.
No associations were found between urinary LMW phthalate metabolite concentrations or individual metabolite components of LMW with OR prevalence of obesity (Table 4).
Since phthalate metabolites have anti-androgenic activities, we looked at whether the associations we found in males may be affected by decrease testosterone milieu that is observed with age. We found that males in the highest age quartile (60 years and older) had a significantly higher risk of obesity with higher urinary DEHP metabolite and HMW phthalate metabolite concentrations (Fig. 1). No effect was observed in males less than 60 years of age (data not shown).
Fig. 1.
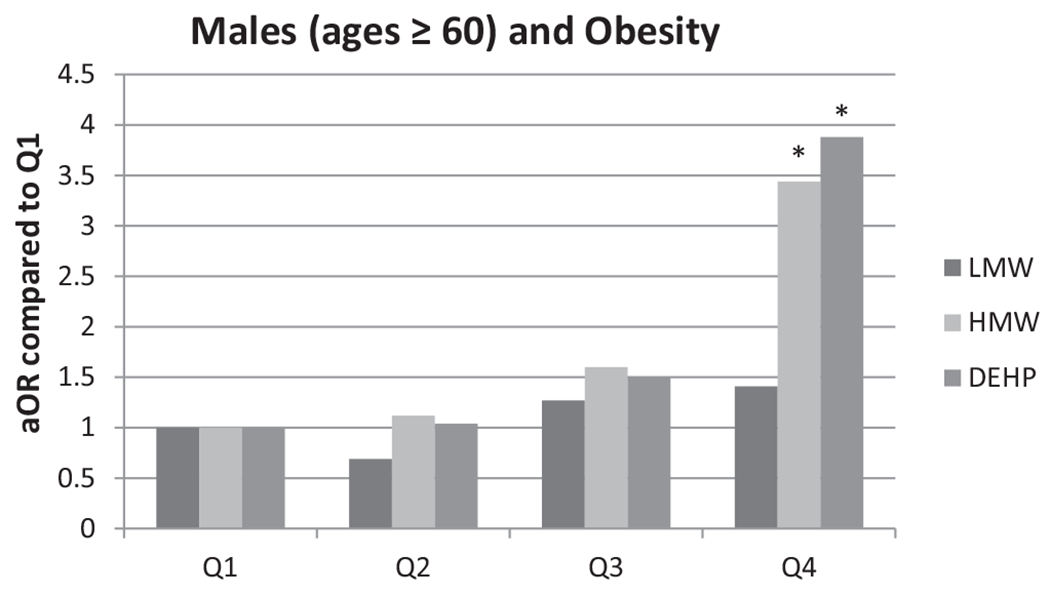
Adjusted OR stratified by age quartile between obesity and phthalates. *Indicate significant association (p < 0.05).
Discussion
We found a statistically significant (p < 0.05) positive association between LMW phthalate metabolite concentrations and obesity in children and adolescents. Analyses by sex found that this positive association was present in males, but not in females. In adults, we found a statistically significant association with increased OR for obesity with both HMW phthalate metabolite concentrations and DEHP metabolite concentrations; the association with DEHP metabolites was maintained in females upon stratification, whereas the association with HMW phthalates was maintained in males. Interestingly, when stratified by age quartile, older males (60 years and older) higher OR for obesity with higher urinary HMW phthalate metabolite concentrations and DEHP metabolite concentrations (Fig. 1).
Some of our findings are different from other studies looking at NHANES data for phthalate exposure and body weight outcomes (Hatch et al., 2008; Stahlhut et al., 2007; Trasande et al., 2013). This could be a methodological difference since we used urinary creatinine as a covariate in the model whereas the other studies used creatinine-standardized concentrations of the phthalates.
Stahlhut et al. (2007) looked at six phthalate metabolites and their association with WC as well as insulin resistance using NHANES 1999–2002 in males 18 years and older. They found a positive association between certain low molecular (MEP) and high molecular (MBzP, MEOHP, MEHHP) phthalate metabolites and WC. We did not find that any of these individual metabolites were associated with higher OR for obesity in males; however, we found that MCNP, a HMW phthalate metabolite, was statistically significantly associated with obesity in males as well as the molar sum of all HMW metabolites.
Hatch et al. (2008) looked at the association between six phthalate metabolites and WC and BMI for men and women ages 6–80 in NHANES 1999–2002. They observed a positive association between the LMW phthalate metabolite MEP and BMI for males (adults) and female (adolescents and adults). The LMW phthalate metabolite MnBP had a statistically significant inverse relationship with BMI and WC among 60–80 year old men and women. Similar to Stahlhut et al. (2007), Hatch et al. (2008) observed a strong, positive relationship between the HMW phthalate metabolite MBzP and BMI and WC among adult males.
In a longitudinal study of 387 Hispanic and Black, New York City children (6–8 years old), 307 of which were female, Teitelbaum et al. (2012) found an association of MEP and a mixture of LMW phthalate metabolites with BMI and WC among overweight children. Similarly, we found that MEP, as well as the sum of LMW phthalate metabolites, were associated with higher OR for obesity in all CHA and in male CHA after stratification by sex.
Trasande et al. (2013) found that LMW phthalate metabolite concentrations were statistically significantly associated with obesity and BMI z-score among non-Hispanic blacks children/adolescent (6–19 years) using NHANES 2003–2008. We found similar results that LMW phthalate metabolite concentrations were associated with obesity in children and adolescents (ages 6–19 years); however, our association was limited to male children and adolescents.
Phthalate exposure may affect adipogenesis by interfering with the biological actions of: (i) steroid hormones; (ii) thyroid hormones; and (iii) peroxisome proliferator-activated receptors in adipocytes. Evidence of the anti-androgenic effect of phthalates comes from in vivo and in vitro studies.
An in vitro study using human testis showed that phthalates inhibit the biosynthesis of testosterone (Desdoits-Lethimonier et al., 2012). Animal studies have demonstrated an altered sexual differentiation in male rats after exposures to several phthalates and their metabolites, e.g. butylbenzylphthalate and its metabolite MBzP (Gray et al., 2000); di-n-butyl phthalate (DBP) and its metabolite MnBP (Fisher et al., 2003; Foster et al., 2000); and DEHP and its metabolites (Gray et al., 2000). Among the observed effects were decreased testosterone levels, cryptorchidism, abnormalities in the Sertoli cells, hypospadias, and reduction in sperm production. Similar anti-androgenic effects have been shown in rats exposed to DiNP during development with DiNP less potent than DEHP (Boberg et al., 2011; Borch et al., 2004). The effects on the male rat reproductive system are similar to the human testicular dysgenesis syndrome (TDS), which may result from the disruption of gonadal development during fetal life (Fisher et al., 2003; Skakkebaek et al., 2001).
Low levels of total and free testosterone in men have been linked to obesity (Wang et al., 2011; Yassin and Doros, 2013). If phthalates work through anti-androgenic mechanisms, one might expect an increased body mass in adult males with reduced testosterone levels, specifically those males 60 years and older. Interestingly, when we stratified our analyses by age group, we found that in the highest age group (60 years and older), males had significantly higher risk of obesity. This would be expected if phthalates work through an anti-androgenic mechanism because the already low levels of testosterone would be further reduced. This could lead to increased body mass and maybe even obesity, similar to the results we observed. Our results indicate a positive association in adult females of DEHP metabolites with higher OR for obesity. This may also reflect the anti-androgenic action of the chemicals which results in higher estrogen/androgen ratio in females.
Another possible mechanism of action of phthalates on adiposity is through the perturbation of the thyroid hormone system which is critical to the maintenance of basal metabolism. Both in vivo and in vitro studies have reported anti-thyroid activities of phthalates (reviewed in Andra and Makris 2012; Ibhazehiebo and Koibuchi, 2011; Li et al., 2010; Shen et al., 2009). Several epidemiological studies have also found a negative association of urinary phthalate metabolite concentrations and thyroid hormones (Meeker et al., 2007; Meeker and Ferguson, 2011).
The best evidence supporting a role of phthalate exposure in adipogenesis comes from in vitro studies investigating the effects of phthalates on peroxisome proliferator-activated receptors (PPARs), a group of nuclear receptor proteins that regulate cell differentiation, development, and metabolism of lipids, carbohydrates and proteins (Grun and Blumberg, 2006). Activation of PPARγ causes differentiation of pre-adipocyte cells into fat tissue. In the 3T3-L1 cell model, several phthalates have been shown to induce adipogenesis through this mechanism (Feige et al., 2007; Hurst and Waxman, 2003; Sargis et al., 2010). Furthermore, MEHP induces mouse and human PPARγ activity (Bility et al., 2004; Feige et al., 2007; Hao et al., 2012; Hurst and Waxman, 2003; Venkata et al., 2006) and MEP increases activity of human PPARγ (Bility et al., 2004). Additionally, MEHP and MnBP induce activation of PPARα and PPARβ, two other nuclear receptors in the PPAR family (Bility et al., 2004; Feige et al., 2007; Hurst and Waxman, 2003).
There are several limitations of our study. The cross-sectional nature of the study prevents us from proving causality on the associations we found. A major limitation is the use of single-spot urine measures as an estimate of exposure. Phthalates are rapidly metabolized and excreted, and a single exposure measurement does not reflect long-term exposure. However, individual exposure sources based on use of personal care products, medications, and other factors may likely remain relatively constant over a long stretch of time. Additionally, reverse causation cannot be excluded since overweight and obese people will have more fat mass, they may store more phthalates, thus leading to higher excretion concentrations.
Conclusion
We found a sex difference in association between phthalates and body weight outcomes. We found that urinary concentrations of LMW phthalate metabolites are associated with higher rates of obesity in male children and adolescents. We found that urinary concentrations of DEHP metabolites are positively associated with obesity in female adults. Furthermore, HMW and DEHP phthalate metabolites are associated with higher OR for obesity in male adults 60 years and older.
Acknowledgement
This research was supported in part by an appointment to the Research Participation Program at the Centers for Disease Control and Prevention (CDC) administered by the Oak Ridge Institute for Science and Education through an interagency agreement between the U.S. Department of Energy and CDC (MCB).
Footnotes
The findings and conclusion in this report are those of the authors and do not necessarily represent the official position of CDC/ATSDR.
References
- Andra SS, Makris KC, 2012. Thyroid disrupting chemicals in plastic additives and thyroid health. J. Environ. Sci. Health C Environ. Carcinog. Ecotoxicol. Rev 30 (2), 107–151. [DOI] [PubMed] [Google Scholar]
- ATSDR. Agency for Toxic Substances and Disease Registry, 2001. Toxicological Profile for Di-n-Butyl. US Department of Health and Human Services, Public Health Service, Atlanta, GA. [Google Scholar]
- ATSDR. Agency for Toxic Substances and Disease Registry, 2002. Toxicological Profile for Di(2-thylhexyl) Phthalate. US Department of Health and Human Services, Public Health Service, Atlanta, GA. [Google Scholar]
- Barr DB, Wilder LC, Caudill SP, Gonzalez AJ, Needham LL, Pirkle JL, 2005. Urinary creatinine concentrations in the U.S. population: implications for urinary biologic monitoring measurements. Environ. Health Perspect 113 (2), 192–200. [DOI] [PMC free article] [PubMed] [Google Scholar]
- Bility MT, Thompson JT, McKee RH, David RM, Butala JH, Vanden Heuvel JP, Peters JM, 2004. Activation of mouse and human peroxisome proliferator-activated receptors (PPARs) by phthalate monoesters. Toxicol. Sci 82 (1), 170–182. [DOI] [PubMed] [Google Scholar]
- Boberg J, Christiansen S, Axelstad M, Kledal TS, Vinggaard AM, Dalgaard M, Nellemann C, Hass U, 2011. Reproductive and behavioral effects of diisononyl phthalate (DINP) in perinatally exposed rats. Reprod. Toxicol 31 (2), 200–209. [DOI] [PubMed] [Google Scholar]
- Borch J, Ladefoged O, Hass U, Vinggaard AM, 2004. Steroidogenesis in fetal male rats is reduced by DEHP and DINP, but endocrine effects of DEHP are not modulated by DEHA in fetal, prepubertal and adult male rats. Reprod. Toxicol 18(1), 53–61. [DOI] [PubMed] [Google Scholar]
- Desdoits-Lethimonier C, Albert O, Le Bizec B, Perdu E, Zalko D, Courant F, et al. , 2012. Human testis steroidogenesis is inhibited by phthalates. Hum. Reprod 27 (5), 1451–1459. [DOI] [PubMed] [Google Scholar]
- Feige JN, Gelman L, Rossi D, Zoete V, Métivier R, Tudor C, et al. , 2007. The endocrine disruptor monoethyl-hexyl-phthalate is a selective peroxisome proliferator-activated receptor gamma modulator that promotes adipogenesis. J. Biol. Chem 282 (26), 19152–19166. [DOI] [PubMed] [Google Scholar]
- Fisher JS, Macpherson S, Marchetti N, Sharpe RM, 2003. Human ‘testicular dysgenesis syndrome’: a possible model using in-utero exposure of the rat to dibutyl phthalate. Hum. Reprod 18 (7), 1383–1394. [DOI] [PubMed] [Google Scholar]
- Foster PM, Cattley RC, Mylchreest E, 2000. Effects of di-n-butyl phthalate (DBP) on male reproductive development in the rat: implications for human risk assessment. Food Chem. Toxicol 38 (1 Suppl.), S97–S99. [DOI] [PubMed] [Google Scholar]
- Gray LE Jr., Ostby J, Furr J, Price M, Veeramachaneni DN, Parks L, 2000. Perinatal exposure to the phthalates DEHP, BBP, and DINP, but not DEP, DMP, or DOTP, alters sexual differentiation of the male rat. Toxicol. Sci 58 (2), 350–365. [DOI] [PubMed] [Google Scholar]
- Grun F, Blumberg B, 2006. Environmental obesogens: organotins and endocrine disruption via nuclear receptor signaling. Endocrinology 147 (6 Suppl.), S50–S55. [DOI] [PubMed] [Google Scholar]
- Hatch EE, Nelson JW, Qureshi MM, Weinberg J, Moore LL, Singer M, Webster TF, 2008. Association of urinary phthalate metabolite concentrations with body mass index and waist circumference: a cross-sectional study of NHANES data, 1999–2002. Environ. Health 7, 27–41. [DOI] [PMC free article] [PubMed] [Google Scholar]
- Hao C, Cheng X, Xia H, Ma X, 2012. The endocrine disruptor mono-(2-ethylhexyl) phthalate promotes adipocyte differentiation and induces obesity in mice. Biosci. Rep 32 (6), 619–629. [DOI] [PMC free article] [PubMed] [Google Scholar]
- Hurst CH, Waxman DJ, 2003. Activation of PPARalpha and PPARgamma by environmental phthalate monoesters. Toxicol. Sci 74 (2), 297–308. [DOI] [PubMed] [Google Scholar]
- Ibhazehiebo K, Koibuchi N, 2011. Thyroid hormone receptor-mediated transcription is suppressed by low dose phthalate. Niger. J. Physiol. Sci 26 (2), 143–149. [PubMed] [Google Scholar]
- Ikeda M, Ezaki T, Tsukahara T, Moriguchi J, Furuki K, Fukui Y, et al. , 2003. Bias induced by the use of creatinine-corrected values in evaluation of beta2-microgloblin levels.Toxicol. Lett 145 (2), 197–207. [DOI] [PubMed] [Google Scholar]
- Janesick A, Blumberg B, 2011. Endocrine disrupting chemicals and the develop-menta programming of adipogenesis and obesity. Birth Defects Res. C, Embryo Today: Rev 93, 34–50. [DOI] [PMC free article] [PubMed] [Google Scholar]
- Li N, Wang D, Zhou Y, Ma M, Li J, Wang Z, 2010. Dibutyl phthalate contributes to the thyroid receptor antagonistic activity in drinking water processes. Environ. Sci. Technol 44 (17), 6863–6868. [DOI] [PubMed] [Google Scholar]
- Meeker JD, Calafat AM, Hauser R, 2007. Di(2-ethylhexyl) phthalate metabolites may alter thyroid hormone levels in men. Environ. Health Perspect 115 (7), 1029–1034. [DOI] [PMC free article] [PubMed] [Google Scholar]
- Meeker JD, Ferguson KK, 2011. Relationship between urinary phthalate and bisphenol A concentrations and serum thyroid measures in U.S. adults and adolescents from the National Health and Nutrition Examination Survey (NHANES) 2007–2008. Environ. Health Perspect 119 (10), 1396–1402. [DOI] [PMC free article] [PubMed] [Google Scholar]
- NCHS. National Center for Health Statistics, 2007. National Health and Nutrition Examination Survey 2005–2006. Laboratory Procedure Manuals. Centers for Disease Control an Prevention, National Center for Health Statistics, Atlanta, GA: (accessed March 2012). [Google Scholar]
- NCHS. National Center for Health Statistics, (accessed March 2012) 2008a. National Health and Nutrition Examination Survey Home Page. Centers for Disease Control and Prevention, National Center for Health Statistics, Atlanta, GA: http://www.cdc.gov/nchs/nhanes.htm [Google Scholar]
- NCHS. National Center for Health Statistics, 2008b. National Health and Nutrition Examination. Survey analytic guidelines. Centers for Disease Control and Prevention, National Center for Health Statistics, Atlanta, GA: (accessed October 2012). [Google Scholar]
- NCHS. National Center for Health Statistics, (accessed March 2012) 2008c. Continuous National Health and Nutrition Examination Survey (NHANES) Web Tutorial. Constructing Weights for Combined NHANES Survey Cycles. Centers for Disease Control and Prevention, National Center for Health Statistics, Atlanta, GA: http://www.cdc.gov/nchs/tutorials/nhanes/SurveyDesign/Weighting/intro.htm [Google Scholar]
- Sargis RM, Johnson DN, Choudhury RA, Brady MJ, 2010. Environmental endocrine disruptors promote adipogenesis in the 3T3-L1 cell line through glucocorticoid receptor activation. Obesity (Silver Spring) 18 (7), 1283–1288. [DOI] [PMC free article] [PubMed] [Google Scholar]
- Schonfeld-Warden N, Warden CH, 1997. Pediatric obesity: an overview of etiology and treatment. Pediatr. Clin. North Am 44 (2), 339–361. [DOI] [PubMed] [Google Scholar]
- Shen O, Du G, Sun H, Wu W, Jiang Y, Song L, Wang X, 2009. Comparison of in vitro hormone activities of selected phthalates using reporter gene assays. Toxicol. Lett 191 (1), 9–14. [DOI] [PubMed] [Google Scholar]
- Skakkebaek NE, Rajpert-De Meyts E, Main KM, 2001. Testicular dysgenesis syndrome: an increasingly common developmental disorder with environmental aspects. Hum. Reprod 16 (5), 972–978. [DOI] [PubMed] [Google Scholar]
- Stahlhut RW, van Wijngaarden E, Dye TD, Cook S, Swan SH, 2007. Concentrations of urinary phthalate metabolites are associated with increased waist circumference and insulin resistance in adult U.S. males. Environ Health Perspect 115 (June 6), 876–882 (Epub 2007 Mar 14. Erratum in: Environ Health Perspect. 2007 Sep; 115(9):A443). [DOI] [PMC free article] [PubMed] [Google Scholar]
- Teitelbaum SL, Mervish N, Moshier EL, Vangeepuram N, Galvez MP, Calafat AM, et al. , 2012. Associations between phthalate metabolite urinary concentrations and body size measures in New York City children. Environ. Res 112, 186–193. [DOI] [PMC free article] [PubMed] [Google Scholar]
- Trasande L, Attina TM, Sathyanarayana S, Spanier AJ, Blustein J, 2013. Race/ethnicity-specific associations of urinary phthalates with childhood body mass in a nationally representative sample. Environ. Health Perspect 121 (4), 501–506. [DOI] [PMC free article] [PubMed] [Google Scholar]
- Venkata NG, Robinson JA, Cabot PJ, Davis B, Monteith GR, Roberts-Thomson SJ, 2006. Mono(2-ethylhexyl)phthalate and mono-n-buty phthalate activation of peroxisome proliferator activated-receptors alpha and gamma in breast. Toxicol. Lett 163 (3), 224–234. [DOI] [PubMed] [Google Scholar]
- Wang C, Jackson G, Jones TH, Matsumoto AM, Nehra A, Perelman MA, Swerdloff RS, Traish A, Zitzmann M, Cunningham G, 2011. Low testosterone associated with obesity and the metabolic syndrome contributes to sexual dysfunction and cardiovascular disease risk in men with type 2 diabetes. Diabetes Care 34 (7), 1669–1675. [DOI] [PMC free article] [PubMed] [Google Scholar]
- Yassin A, Doros G, 2013. Testosterone therapy in hypogonadal men results in sustained and clinically meaningful weight loss. Clin. Obes 3 (3–4), 73–83. [DOI] [PMC free article] [PubMed] [Google Scholar]
- Zota AR, Calafat AM, Woodruff TJ, 2014. Temporal trends in phthalate exposures: findings from the national health and nutrition examination survey, 2001–2010. Environ. HealthPerspect 10.1289/ehp.1306681. [DOI] [PMC free article] [PubMed] [Google Scholar]