Abstract
Objective:
Patients with chronic, subjective tinnitus are often administered a battery of audiometric tests to characterize their tinnitus percept. Even a comprehensive battery, if applied just once, cannot capture fluctuations in tinnitus strength or quality over time. Moreover, subjects experience a learning curve when reporting the detailed characteristics of their tinnitus percept, such that a single assessment will reflect a lack of familiarity with test requirements. We addressed these challenges by programming an automated software platform for at-home tinnitus characterization over a two-week period.
Study design:
Prospective case series.
Setting:
Tertiary referral center, patients’ homes.
Interventions:
Following an initial clinic visit, 25 subjects with chronic subjective tinnitus returned home with a tablet computer and calibrated headphones to complete questionnaires, hearing tests and tinnitus psychoacoustic testing. We repeatedly characterized loudness discomfort levels and tinnitus matching over a 2-week period.
Main outcome measures:
Primary outcomes included intra-subject variability in loudness discomfort levels, tinnitus intensity, and tinnitus acoustic matching over the course of testing.
Results:
Within-subject variability for all outcome measures could be reduced by approximately 25–50% by excluding initial measurements and by focusing only on tinnitus matching attempts where subjects report high confidence in the accuracy of their ratings.
Conclusions:
Tinnitus self-report is inherently variable but can converge on reliable values with extended testing. Repeated, self-directed tinnitus assessments may have implications for identifying malingerers. Further, these findings suggest that extending the baseline phase of tinnitus characterizations will increase the statistical power for future studies focused on tinnitus interventions.
Introduction:
Disabling tinnitus affects 5–15% of the general population1,2 and imposes a financial health care burden that reaches as high as 7.5 billion dollars in some developed nations.3,4 There are no approved therapeutics for tinnitus; cognitive behavioral therapy, sound therapy and hearing aids are the only recommended management strategies for US-based clinicians.5 There are no objective measures of tinnitus; it can only be identified by subjective self-report. Self-report measures are vulnerable to placebo effects and malingering. These challenges are not unique to tinnitus. In more mature therapeutic areas such chronic pain management, clinicians and scientists have worked together for decades to identify core assessment domains and novel assessment approaches to improve the quality of clinical trials, an effort that has only recently begun in the field of tinnitus research and clinical management.6,7
Tinnitus quality and severity are naturally fluctuant, yet most clinical measures of tinnitus are based on a single snapshot of a subject’s symptoms. Moreover, these measures are typically limited to assessments of the tinnitus handicap index or tinnitus loudness, which can be obtained quickly, but can also be influenced by a subject’s general psychological state. Here, we address these challenges by developing a mobile software platform for repeated tinnitus measurements that include quantification of the tinnitus percept and related changes in loudness discomfort.
Ecological momentary assessments have been increasingly adopted in neuropsychiatric research as a means to track symptoms in real-world environments using consumer-grade mobile electronics.8–11 Building self-directed tinnitus measurement software introduces a few new challenges that are not faced when measuring changes in mood or anxiety. For example, subjects often lack the vocabulary to describe their phantom auditory percept and are unfamiliar with using audio mixers to match their tinnitus percept or identify their loudness discomfort level. Here, we recruited a diverse cohort of subjects with tinnitus and tracked the daily variations in their symptoms over a several week period as they learned to tune into their tinnitus characteristics using an unsupervised custom software application from the comfort of their own homes.
Materials and Methods:
Patients evaluated at the Massachusetts Eye and Ear for the complaint of subjective tinnitus from February 2015 to February 2016 were recruited for this study. Thirteen patients were survivors of the 2013 Boston Marathon Bombing while 12 patients were seen for the chief complaint of tinnitus at the Massachusetts Eye and Ear who expressed interest in participating in research. Subjects used the research software on this tablet with calibrated headphones during 5 testing sessions over the course of 2 weeks. This study was approved by the Massachusetts Eye and Ear Institutional Review Board.
Testing interface
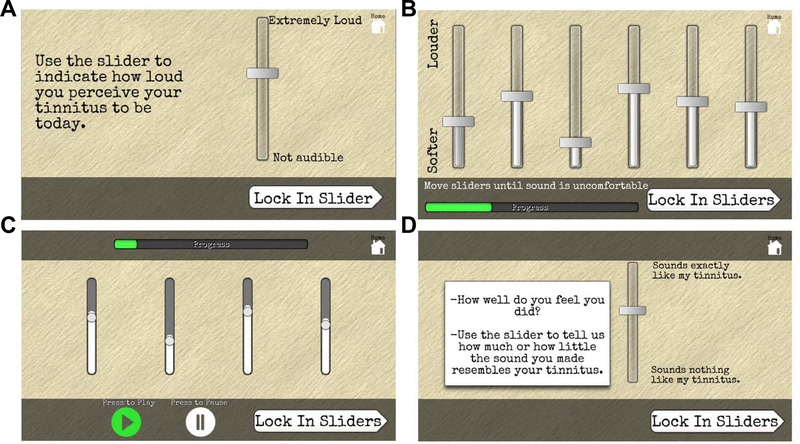
Tablets and calibrated headphones were provided to participants to complete this study. Tablets were loaded with tinnitus research software programmed by the authors for this project. During an initial informational clinic visit, subjects were shown how to use the tablet-based study application. On Day 1 of the study, participants answered questionnaires about their overall health and completed an at-home audiogram (125 to 16000 Hz) in a quiet space, which had previously been shown to have good validity compared with clinical audiograms.12 On days 2, 4, 8, 10, and 12, participants rated their tinnitus intensity and loudness discomfort level in addition to matching the laterality, spectrum, modulation rate and loudness of their tinnitus. Each session lasted approximately 30 minutes. Participants rated tinnitus intensity on a sliding visual analog scale (VAS) that ranged from “not audible” to “extremely loud” (Figure 1A) and these positions on the slider translate to a rating of 0 to 100 respectively. The scale bar was 9cm long on the tablet screen. Loudness discomfort levels (LDL) were assessed with pure tones (125–16000Hz in 1 octave increments) in each ear (Figure 1B). In the tinnitus matching interface, participants used sliders controlling the center frequency, level and bandwidth of a sound output from the tablet until they generated sounds that matched their tinnitus (Figure 1C). Once a sound was locked in, a subject then rated how similar this sound was to his or her current tinnitus percept on a slider that ranges from “sounds nothing like my tinnitus” to “sounds exactly like my tinnitus”, where these positions translate to numerical ratings of 0 to 100 respectively (Figure 1D). Each participant created 10 tinnitus-matching sounds per session over 5 sessions. There were no labels on the sliders that controlled the sounds to indicate the feature that was controlled. Additionally, the position of each slider as well as the spatial mapping of sound feature onto the range of the slider bar was scrambled between each measurement, making it impossible to reproduce the sound by any non-auditory cue. Surface Pro II tablets and consumer-grade headphones (model AE2i) were donated for this research study by Microsoft and Bose, respectively.
Figure 1.
Software for psychoacoustic testing. A) VAS for tinnitus intensity. Scale bar = 9cm on tablet screen. B) Loudness discomfort levels are reported for pure tones (125Hz-8000Hz, presented in a random order) by adjusting the virtual slider until loudness first becomes uncomfortable. C) Participants adjust the frequency, level, modulation rate and bandwidth of a continuous sound that matches their tinnitus as closely as possible. Slider starting point and dynamic range are varied between trials. D) Subjects are then asked to rate the resemblance of this sound to their tinnitus percept.
Statistics
Descriptive and analytic statistics were performed using Graphpad Prism 7 (La Jolla, CA) and Matlab (Natick, MA). To determine whether intra-subject reliability in VAS or LDL was impacted by the inclusion of initial testing sessions, we first computed the standard deviation (SD) of scores for each subject based on all five measurements, the last four measurements, or just the last three measurements. A repeated measures ANOVA was then used to determine whether there was a main effect across these three arrangements of test conditions. For tinnitus matching, each attempt was grouped according to whether it corresponded to the lowest, middle, or upper third of the confidence rating range for each individual subject. Dividing the confidence scores into tertiles ensured that every subject had at least 3 tinnitus matching data points in any confidence category. On average, there were 16.7 matches per category. We then computed the standard deviation of the match values within each category per subject and performed a 2-way ANOVA, with confidence category and acoustic parameter as repeated measures. Finally, a one-way ANOVA was also performed on confidence ratings with matching attempts as the repeated measure. Violations of the sphericity assumption for repeated measures ANOVA was determined with Mauchly’s sphericity test. P values were reported with the more conservative, lower bound sphericity correction if the assumption was violated.
Subject demographics
Twenty-five subjects participated in this study, of whom 12 were female (48%). The average participant was 52 years old (SD=12.2). Past medical history of participants was notable for 12 subjects with psychiatric comorbidities (most commonly anxiety, depression, and post-traumatic stress disorder), 9 subjects with cardiovascular disease (most commonly hyperlipidemia), 2 subjects with asthma, 2 subjects with thyroid disease, 2 subjects with central nervous system diseases (frontal lobe injury, spinal tumor), 1 diabetic subject and 1 subject with Ehlers-Danlos syndrome. Twelve subjects were directly affected by the 2013 Boston Marathon bombing and these participants attributed their tinnitus to the blast trauma that occurred 2–3 years prior to our tinnitus characterization. All subjects completed the full battery of tests other than a single subject who did not complete loudness discomfort level testing.
Results:
Tinnitus Intensity
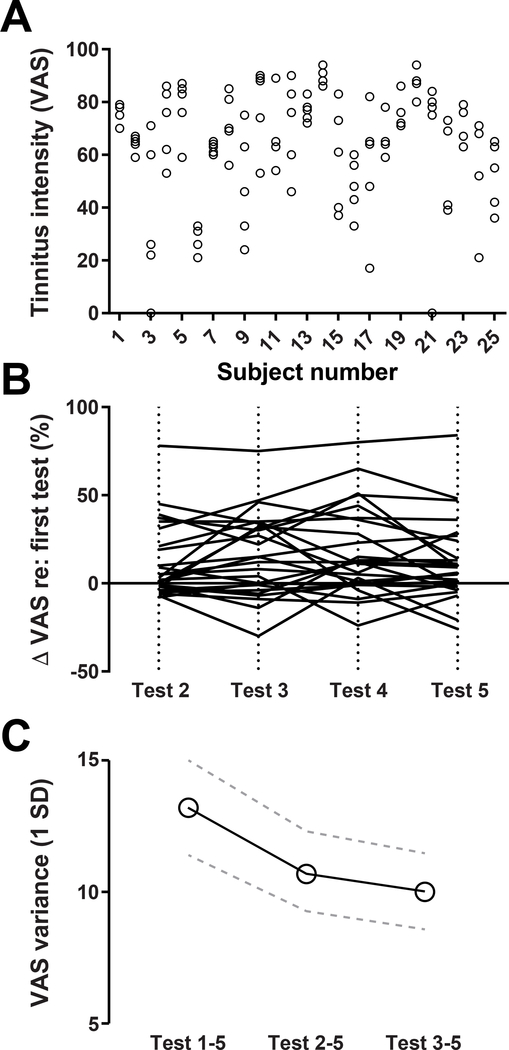
VAS ratings varied between subjects, but also varied substantially across the five measurement sessions within individual subjects, as evidenced by the spread of individual measurement points within each vertical column (Figure 2A). The direction of change was not random, but rather tended to increase across the five test sessions, which could reflect an increased awareness of their tinnitus or else a recalibration of how to most accurately characterize their tinnitus (ANOVA, main effect for test session, F = 5.594, p = 0.0015). Plotting the change in VAS relative to the first test session confirms that most subjects reported increased tinnitus intensity, particularly between the first and second measurements (Figure 2B).
Figure 2.
Subjects rated their tinnitus intensity 5 times over a 2-week period on a visual analogue scale. A) Ratings within and between subjects were highly variable. Each circle represents a single VAS measurement per subject. B) The change in VAS relative to the first test are shown for tests 2–5. Individual subjects are represented by individual lines. C) The average variance (1SD) of VAS ratings decrease by dropping early test sessions. Error bars indicate standard error of the mean (SEM).
Apart from calculating changes in the direction of VAS reports over measurement sessions, we also determined how the first few reports contributed to the variability of tinnitus intensity scores within any given subject. We calculated the standard deviation of each subject’s VAS scores in three conditions: i) based on all five measurements, ii) after dropping the first measurement, and iii) after dropping the first two measurements. Variability in tinnitus intensity was reduced by 18.3 and 24.1 percentage points after dropping the first, or the first two measurements, respectively (Fig. 2C). While a reduction in VAS variability was apparent in the average data, inconsistencies across subjects resulted in only a statistically marginal trend once a sphericity correction was applied to the data (Repeated measure ANOVA, main effect for test configuration, F = 3.35, p = 0.08).
Loudness Discomfort Levels
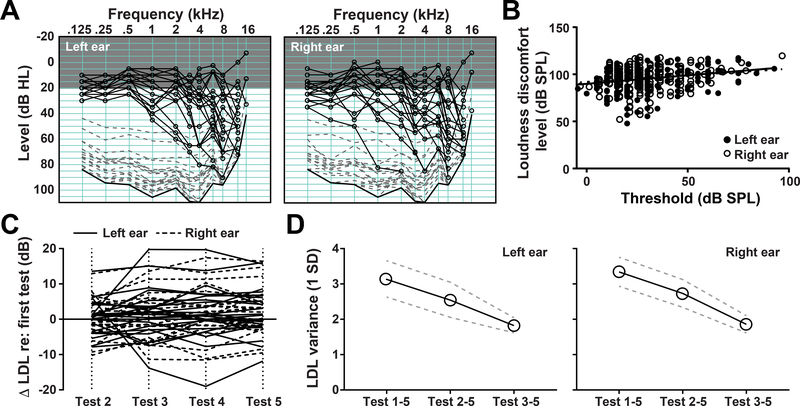
All tinnitus assays rely on subjective self-report, but measures like VAS are particularly problematic because the measurement scale itself is based on imaginary units, rather than physical units. Because reduced sound level tolerance often accompanies tinnitus and can be measured in physical units of sound pressure level (SPL), we extended our analysis of variability in tinnitus-related self-report measures to include loudness discomfort levels (LDL).13,14 Subjects’ pure tone averages for air conduction ranged from 8.75 dB to 67.5 dB HL, with an average of 26 dB in the left ears and 27 dB in the right ears (Figure 3A). Blast patients did not have significantly different pure tone averages compared with non-blast patients (Mann-Whitney U test, p>0.05).
Figure 3.
A) Loudness discomfort levels were measured from the left and right ears with pure tone frequencies ranging from 125 Hz to 16 kHz (dashed gray lines). Tone detection thresholds (audiograms) are represented in black lines with round marks. Thick black line represents the output limit of the equipment. Gray shaded region represents the range of normal hearing thresholds. Data reflect measurements from each subject at the first test session. B) Loudness discomfort thresholds increase with threshold, but the change is not proportionate, resulting in a reduced comfortable listening range with increasing audibility thresholds. Black line represents the linear fit to the data. C) Loudness discomfort levels measured five times over a 2-week period. The change in LDL relative to the first measurement are shown for tests 2–5. Individual subjects are represented by individual lines. D) The average variance (1SD) of loudness discomfort level measured in the left and right ears is reduced by dropping the first test session.
Pure tone LDL varied between subjects (Figure 3A) but was only weakly related to the pure tone audibility threshold (Figure 3B). LDL did not increase proportionately with increasing audibility thresholds, resulting in a compressed comfortable listening range in subjects with hearing loss. LDL varied substantially for individual subjects across test sessions, though unlike the VAS reports, LDL did not shift systematically in any one direction with additional testing (ANOVA, main effect for test session, left ear F=0.990, p=0.376; right ear F=1.30, p=0.283, Figure 3C). When calculated across both the left and right ears, intra-subject LDL variability was significantly reduced, by 18.6 and 43.1 percentage points, after dropping the first, or the first two measurements, respectively (2-way repeated measures ANOVA, main effect for number of test conditions F = 12.86, P = 0.0008; test condition × ear interaction term, p = 0.81; Figure 3D).
Tinnitus Matching
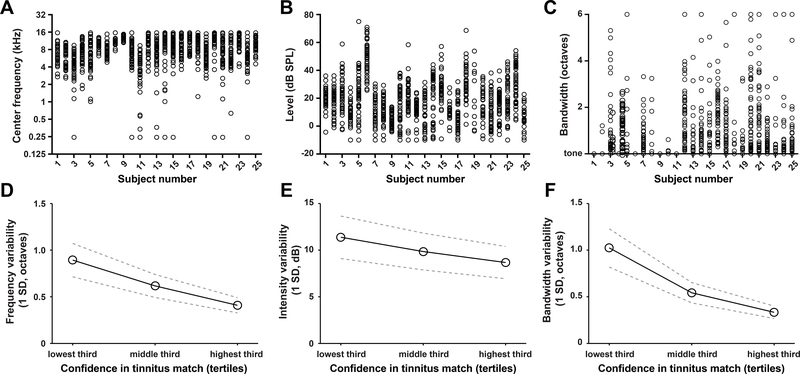
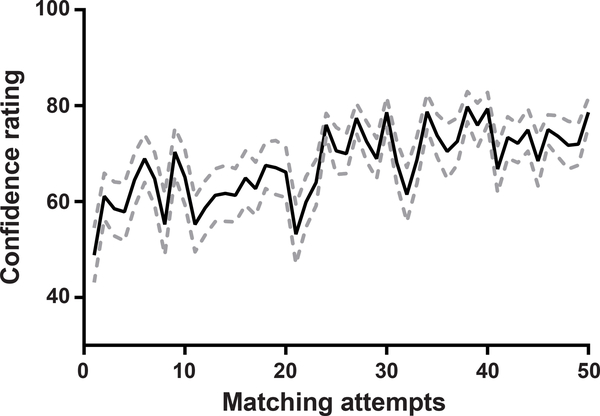
Subjects used virtual sliders in the graphical user interface (Fig. 1C) to manipulate the center frequency (Figure 4A), sound level (Figure 4B) and bandwidth (Figure 4C) of an audio signal in real time until they felt it was a good match to their tinnitus sound. We noted substantial variability across each subject’s 50 tinnitus matching measurements for all three acoustic parameters, as evidenced by the dispersion of data points within any vertical column (Fig. 4A–C). To determine whether this variability was related to a subject’s confidence in the accuracy of their tinnitus match, we divided their range of confidence scores into tertiles and computed the SD of the acoustic matching values within the low, middle and high confidence sub-ranges. We confirmed that tinnitus matching values coalesced into a more consistent range as subjects’ confidence in their matching increased (repeated measures one-way ANOVA on center frequency, level and bandwidth, F = 10.87, p = 0.003; F = 4.38, p =0.04; F = 14.91, p = 0.0007, respectively, Figure 4D–F). Furthermore, we found that confidence increased significantly across the 50 measurement attempts, suggesting that attaching confidence scores and allowing for repeated practice can improve the reliability of tinnitus matching data (repeated measures one-way ANOVA, main effect for test session, F=4.493, p=0.008; Fig 5).
Figure 4.
Subjects matched the sound of their tinnitus over fifty attempts. A-C) Subjects adjusted the center frequency (A), level (B) and bandwidth (C) of an ongoing sound to match their tinnitus. Circles represent individual matching attempts. Each match was associated with a confidence score. B-D) Variability in the center frequency (D), level (E) and bandwidth (F) of the matching sound was related to their confidence in the quality of the match. Data reflect mean SD values and the SEM (dotted lines).
Figure 5.
Subject confidence in the quality of their tinnitus match improves with practice. Data reflect mean and SEM (dotted lines).
Discussion
Absent widely accepted objective biomarkers for tinnitus, subjective reporting is the only option for assessing the efficacy of potential interventions. Here, we developed a suite of psychoacoustic testing software for self-directed use at home. Quantification of self-reported tinnitus intensity, loudness discomfort thresholds and percept characteristics revealed that tinnitus was variable over time. While some of this variability reflects actual differences in their tinnitus percept over time, it could also reflect the learning curve in reporting tinnitus characteristics using study-specific research instruments (i.e., measurement noise). By training subjects with sufficient testing trials and excluding initial measurements, it is possible to remove some of the variability due to measurement noise and converge on more reliable, quantitative markers of each subject’s tinnitus.
Measurement methods for tinnitus fall into four broad categories: psychoacoustic tests, rating scales, questionnaires of functional effects, and global assessments of treatment-related changes.15 We focused on the first two strategies because while questionnaires of functional effects have excellent discriminatory and diagnostic ability, they are not often designed to measure the responsiveness of an intervention.16 Similarly global assessments of treatment related changes (where patients report generally whether the intervention has helped their tinnitus) lack precision in determining effect size and introduce concerns about reliability and validity.16 Most questionnaires such as the Tinnitus Reaction Questionnaire give answers in a small number of possible responses, restricting their ability to detect treatment related changes.15,17 Finally, measurements of tinnitus handicap and subjective intensity might be influenced by more global psychological states and could overlook potentially important fluctuations in the quality of the tinnitus percept and related changes in loudness discomfort over time.18 For example, an intervention that was able to change the tinnitus percept without affecting the intensity of the phantom sound could nonetheless provide an important subclinical clue that could spur additional modifications to improve the efficacy of an intervention strategy.
Psychoacoustic tests like tinnitus matching and rating scales like the visual analog scale have excellent test-retest reliability and good responsiveness to treatment-related changes.19 Serial psychoacoustic testing has been difficult to employ in clinical studies because of the need for specialized audiometric tools and appropriately trained staff. The use of an at-home testing strategy makes it feasible to perform repeated assessments. This study builds on ecological momentary assessment strategies using text message questions8 or mobile applications like “TrackYourTinnitus” 20. These contemporary approaches to repeated tinnitus assessment have found, for example, that subjects who retrospectively rate their tinnitus loudness as “varying” or “non-varying” have comparable prospective assessments of their tinnitus loudness.21 This current study corroborates evidence in the literature that tinnitus characteristics are variable over time, suggesting that clinical studies that ask subjects to provide a single report of tinnitus severity at various study milestones are at risk for poor statistical validity. This study suggests that robust, quantifiable measures of tinnitus characteristics are possible, but only if subjects are given ample trials over time familiarize themselves with the task demands for reporting intervention outcomes.
Repeated at-home testing offers several benefits for future clinical trials on tinnitus. First, the tablet driven system represents an obvious cost savings in the ability to conduct a long-term trial with repeated measurements without the need for expensive clinic visits driven by health care providers. In this study, the cost of a tablet and headphone set-up for each subject is approximately $1000 and sets of equipment could be reused between subjects. The overall cost is significantly lower than the cost required to run 5 sessions of testing for 25 patients over at least 60 hours of clinical time. In addition, researchers of traditional studies might need to pay remunerative incentives to subjects who must repeatedly travel back to the testing site to participate. Similar testing equipment could be developed for smartphones or desktop/laptop computers in the future that could leverage patients’ existing home devices.
Second, this study demonstrates that participants can be “trained” to use to the study instruments to decrease the variability of subjective reports of their symptoms. With this decrease in variability, there is the possibility of decreasing the sample size necessary to find a statistically significant difference in the study outcome. Given that the calculation for sample size is proportional to the square of the standard deviation of the study population, a decrease in variance results in a significant decrease in the sample size. In this study, the variability of tinnitus intensity scores was reduced by 24 percentage points and loudness discomfort level by 43 percentage points, simply by discarding the first two sets of trials. These reductions in baseline measurement variability could reduce the estimated sample size by approximately 50% for a clinical study with tinnitus patients. Of course, these back-of-the-envelope estimates assume that repeated measurement on these instruments would not change overall tinnitus ratings in absence of an intervention, an assumption that is reasonable but not yet validated.
Third, repeated tinnitus matching could be used to uncover fraudulent claims of tinnitus. Here, we introduced an approach for spatially scrambling the acoustic virtual sliders and randomly reassigning the mapping of the dynamic range for each feature onto the virtual slider. Although not explicitly tested here, malingering subjects may not be able to converge on stable acoustic parameters for their tinnitus matching. For future studies, it would be feasible and potentially important to determine how the software developed here could separate malingering subjects from subjects genuinely believed to have tinnitus.
Limitations:
The limitations of this study stem from the restricted sample size and heterogeneity in subject age, varying degrees of familiarity with tablet devices, varying duration of tinnitus, and not controlling for the time of day or circadian phase at the time of testing. The inclusion of a significant number of blast patients in the study population may also limit the study’s generalizability. In sub-analyses of our data, there were no significant difference in the qualities of tinnitus reported by blast and non-blast patients including tinnitus loudness intensity and sound level thresholds. However, patients who developed tinnitus after the Boston Marathon bombing were younger, and had more psychiatric comorbidities specifically related to their traumatic experiences. Lastly, there is a possibility that any tinnitus testing may have observer bias, exacerbating subject’s tinnitus by asking them to focus on their symptoms. This study’s finding that VAS ratings for intensity increased over the study period may be a result of this bias; however, we did not see this effect in ratings of loudness discomfort level. The potential ramifications of this possible bias must carefully be weighed in the setting of future designs for clinical trials.
Conclusions:
In more mature therapeutic areas such as pain, clinicians and scientists have worked together for decades to identify core assessment domains and novel assessment approaches (including psychophysical training) to improve the quality of clinical trials, an effort that has only recently begun in the field of tinnitus.6,7 Serial trials over time are necessary to converge on reliable subjective markers of tinnitus and thereby decrease the sample size necessary to detect meaningful changes in tinnitus percepts. Tablet-based technology makes serial at-home testing feasible for future studies of tinnitus interventions.
Acknowledgments
Funding: This work was supported by a research award from the Boston One Fund and NIDCD P50 DC015817. Tablet computers were donated by Microsoft. Headphones were donated by Bose. We thank Drs. AK Remenschneider, AM Quesnel and DJ Lee for assisting the Boston One Fund in establishing a database of marathon bombing survivors with complaints of tinnitus.
References
- 1.Gallus S, Lugo A, Garavello W, Bosetti C, Santoro E, Colombo P, Perin P, La Vecchia C, Langguth B. Prevalence and Determinants of Tinnitus in the Italian Adult Population. Neuroepidemiology. 2015;45(1):12–19. doi: 10.1159/000431376. [DOI] [PubMed] [Google Scholar]
- 2.Bhatt JM, Lin HW, Bhattacharyya N. Tinnitus Epidemiology: Prevalence, Severity, Exposures And Treatment Patterns In The United States. JAMA Otolaryngol-- Head Neck Surg. 2016;142(10):959–965. doi: 10.1001/jamaoto.2016.1700. [DOI] [PMC free article] [PubMed] [Google Scholar]
- 3.Maes IHL, Cima RFF, Vlaeyen JW, Anteunis LJC, Joore MA. Tinnitus: A Cost Study. Ear Hear. 2013;34(4):508. doi: 10.1097/AUD.0b013e31827d113a. [DOI] [PubMed] [Google Scholar]
- 4.Stockdale D, McFerran D, Brazier P, Pritchard C, Kay T, Dowrick C, Hoare DJ. An economic evaluation of the healthcare cost of tinnitus management in the UK. BMC Health Serv Res. 2017;17(1):577. doi: 10.1186/s12913-017-2527-2. [DOI] [PMC free article] [PubMed] [Google Scholar]
- 5.Tunkel DE, Bauer CA, Sun GH, Rosenfeld RM, Chandrasekhar SS, Cunningham ER, Archer SM, Blakley BW, Carter JM, Granieri EC, Henry JA, Hollingsworth D, Khan FA, Mitchell S, Monfared A, Newman CW, Omole FS, Phillips CD, Robinson SK, Taw MB, Tyler RS, Waguespack R, Whamond EJ. Clinical practice guideline: tinnitus. Otolaryngol--Head Neck Surg Off J Am Acad Otolaryngol-Head Neck Surg. 2014;151(2 Suppl):S1–S40. doi: 10.1177/0194599814545325. [DOI] [PubMed] [Google Scholar]
- 6.Hall DA, Smith H, Hibbert A, Colley V, Haider HF, Horobin A, Londero A, Mazurek B, Thacker B, Fackrell K. The COMiT’ID Study: Developing Core Outcome Domains Sets for Clinical Trials of Sound-, Psychology-, and Pharmacology-Based Interventions for Chronic Subjective Tinnitus in Adults. Trends Hear. 2018;22. doi: 10.1177/2331216518814384. [DOI] [PMC free article] [PubMed] [Google Scholar]
- 7.McFerran DJ, Stockdale D, Holme R, Large CH, Baguley DM. Why Is There No Cure for Tinnitus? Front Neurosci. 2019;13. doi: 10.3389/fnins.2019.00802. [DOI] [PMC free article] [PubMed] [Google Scholar]
- 8.Goldberg RL, Piccirillo ML, Nicklaus J, Skillington A, Lenze E, Rodebaugh TL, Kallogjeri D, Piccirillo JF. Evaluation of Ecological Momentary Assessment for Tinnitus Severity. JAMA Otolaryngol Neck Surg. 2017;143(7):700–706. doi: 10.1001/jamaoto.2017.0020. [DOI] [PMC free article] [PubMed] [Google Scholar]
- 9.Probst T, Pryss RC, Langguth B, Rauschecker JP, Schobel J, Reichert M, Spiliopoulou M, Schlee W, Zimmermann J. Does Tinnitus Depend on Time-of-Day? An Ecological Momentary Assessment Study with the “TrackYourTinnitus” Application. Front Aging Neurosci. 2017;9. doi: 10.3389/fnagi.2017.00253. [DOI] [PMC free article] [PubMed] [Google Scholar]
- 10.Yang YS, Ryu GW, Choi M. Methodological Strategies for Ecological Momentary Assessment to Evaluate Mood and Stress in Adult Patients Using Mobile Phones: Systematic Review. JMIR MHealth UHealth. 2019;7(4):e11215. doi: 10.2196/11215. [DOI] [PMC free article] [PubMed] [Google Scholar]
- 11.Low DM, Bentley KH, Ghosh SS Automated Assessment of Psychiatric Disorders Using Speech: A Systematic Review. OSF Prepr. August 2019. [DOI] [PMC free article] [PubMed] [Google Scholar]
- 12.Whitton JP, Hancock KE, Shannon JM, Polley DB. Validation of a Self-Administered Audiometry Application: An Equivalence Study. The Laryngoscope. 2016;126(10):2382–2388. doi: 10.1002/lary.25988. [DOI] [PubMed] [Google Scholar]
- 13.Hébert S, Fournier P, Noreña A. The Auditory Sensitivity is Increased in Tinnitus Ears. J Neurosci. 2013;33(6):2356–2364. doi: 10.1523/JNEUROSCI.3461-12.2013. [DOI] [PMC free article] [PubMed] [Google Scholar]
- 14.Sanchez TG, Moraes F, Casseb J, Cota J, Freire K, Roberts LE. Tinnitus is associated with reduced sound level tolerance in adolescents with normal audiograms and otoacoustic emissions. Sci Rep. 2016;6:27109. doi: 10.1038/srep27109. [DOI] [PMC free article] [PubMed] [Google Scholar]
- 15.Meikle MB, Stewart BJ, Griest SE, Martin WH, Henry JA, Abrams HB, McArdle R, Newman CW, Sandridge SA. Assessment of tinnitus: measurement of treatment outcomes. In: Langguth B, Hajak G, Kleinjung T, Cacace A, Møller AR, eds. Progress in Brain Research. Vol 166. Tinnitus: Pathophysiology and Treatment. Elsevier; 2007:511–521. doi: 10.1016/S0079-6123(07)66049-X. [DOI] [PubMed] [Google Scholar]
- 16.Meikle MB, Stewart BJ, Griest SE, Henry JA. Tinnitus Outcomes Assessment. Trends Amplif. 2008;12(3):223–235. doi: 10.1177/1084713808319943. [DOI] [PMC free article] [PubMed] [Google Scholar]
- 17.Wilson Peter H, Henry Jane, Bowen Maitland, Haralambous George. Tinnitus Reaction Questionnaire. J Speech Lang Hear Res. 1991;34(1):197–201. doi: 10.1044/jshr.3401.197. [DOI] [PubMed] [Google Scholar]
- 18.Wallhäusser-Franke E, Brade J, Balkenhol T, D’Amelio R, Seegmüller A, Delb W. Tinnitus: Distinguishing between Subjectively Perceived Loudness and Tinnitus-Related Distress. PLOS ONE. 2012;7(4):e34583. doi: 10.1371/journal.pone.0034583. [DOI] [PMC free article] [PubMed] [Google Scholar]
- 19.Vernon JA, Meikle MB. Tinnitus: clinical measurement. Otolaryngol Clin North Am. 2003;36(2):293–305, vi. [DOI] [PubMed] [Google Scholar]
- 20.Pryss R, Reichert M, Langguth B, Schlee W. Mobile Crowd Sensing Services for Tinnitus Assessment, Therapy, and Research. In: 2015 IEEE International Conference on Mobile Services.; 2015:352–359. doi: 10.1109/MobServ.2015.55. [DOI] [Google Scholar]
- 21.Pryss R, Probst T, Schlee W, Schobel J, Langguth B, Neff P, Spiliopoulou M, Reichert M. Prospective crowdsensing versus retrospective ratings of tinnitus variability and tinnitus–stress associations based on the TrackYourTinnitus mobile platform. Int J Data Sci Anal. March 2018. doi: 10.1007/s41060-018-0111-4. [DOI] [Google Scholar]


