Abstract
Pleural photodynamic therapy (PDT) is performed intraoperatively for the treatment of microscopic disease in patients with malignant pleural mesothelioma. Accurate delivery of light dose is critical to PDT efficiency. As a standard of care, light fluence is delivered to the prescribed fluence using eight isotropic detectors in pre-determined discrete locations inside the pleural cavity that is filled with a dilute Intralipid solution. An optical infrared (IR) navigation system was used to monitor reflective passive markers on a modified and improved treatment delivery wand to track the position of the light source within the treatment cavity during light delivery. This information was used to calculate the light dose, incorporating a constant scattered light dose and using a dual correction method. Calculation methods were extensively compared for eight detector locations and seven patient case studies. The light fluence uniformity was also quantified by representing the unraveled three-dimensional geometry on a two-dimensional plane. Calculated light fluence at the end of treatment delivery was compared to measured values from isotropic detectors. Using a constant scattered dose for all detector locations along with a dual correction method, the difference between calculated and measured values for each detector was within 15%. Primary light dose alone does not fully account for the light delivered inside the cavity. This is useful in determining the light dose delivered to areas of the pleural cavity between detector locations, and can serve to improve treatment delivery with implementation in real-time in the surgical setting. We concluded that the standard deviation of light fluence uniformity for this method of pleural PDT is 10%.
Keywords: photodynamic therapy, mesothelioma, optical tracking
1. Introduction
Cancers of the pleura including malignant pleural mesothelioma (MPM), non-small cell lung cancer, and early small cell lung cancer, are aggressive diseases that are historically difficult to treat and offer a prognosis of 6–15 months (Hahn et al 2001, Simone and Cengel 2014). The difficulty in treating MPM comes from the ability to eradicate all microscopic disease from the pleural cavity, as MPM is often a widespread local disease (Friedberg and Cengel 2010). While there is no standard treatment for pleural cancers, treatment begins with a surgical resection of the macroscopic cancerous tissue (Pass et al 1990, Friedberg and Cengel 2010). As a part of a multimodal approach, photodynamic therapy (PDT) has been applied intraoperatively to target remaining microscopic disease. For PDT, the patient receives a photosensitizer drug prior to surgery, which is then activated with laser light of a specific wavelength. Activation of the photosensitizer causes creation of cytotoxic oxygen species, such as singlet oxygen, which then triggers various cell killing mechanisms (Dougherty et al 1998, Allison and Moghissi 2013, Kessel and Oleinick 2018).
PDT involves delivery of visible light rather than ionizing radiation and can be well localized. For these reasons, PDT has shown to have fewer long-term side effects compared to conventional radiation or chemotherapy (Triesscheijn et al 2006). As a standard, light fluence is monitored in the pleural cavity using eight discrete isotropic detectors placed in pre-determined locations throughout the cavity. The locations were determined to be representative of the entire pleural cavity with a focus on areas closer to other healthy organs (e.g. heart, diaphragm). An infrared camera-based optical tracking system was utilized during intraoperative PDT to calculate the uniformity of light delivery in the entire cavity to provide information regarding locations outside of the detector positions.
In this study, the light calculation and uniformity was investigated for a set of patients that received pleural PDT. Light calculation methods were improved and evaluated for a set of patients treated between 2015 and 2017. Use of the optical infrared navigation system to monitor light fluence delivery is useful in providing information regarding the light dose delivered to the areas between the isotropic detectors and can reduce the risk of hot or cold spots over the pleural surface. This study aims to provide a method to evaluate the total light dose delivered to areas with limited measured light dose information.
2. Methods
2.1. Pleural PDT
Patients with malignant pleural mesothelioma were enrolled in a clinical trial (ClinicalTrials.gov Identifier: NCT02153229) to undergo surgical resection along with interoperative PDT at the Hospital of the University of Pennsylvania. A more detailed description of the PDT technique and treatment protocol can be found elsewhere (Friedberg et al 2012, Zhu et al 2015b). Patients received the photosensitizer Photofrin at 2 mg kg−1 body weight 24 h prior to surgery. The shorter uptake time of 24 h was used compared to the drug indicated 40–50 h based on a phase I pleural PDT clinical trial for mesothelioma (Pass et al 1994). 630 nm wavelength laser light was delivered by a diode laser system (Modulight, Tampere, Finland). PDT was delivered to a prescribed 60 J cm−2, which was measured by eight isotropic detectors (Medlight SA, Ecublens, Switzerland) sutured in pre-determined locations within the pleural cavity: apex, posterior chest wall (PCW), anterior chest wall (ACW), posterior sulcus (PS), anterior sulcus (AS), posterior mediastinum (PM), pericardium (Peri), diaphragm (Diaph). The current standard of treatment involves treatment to the prescribed light dose at each of the isotropic detectors. Light is delivered to the pleural cavity via a bare fiber connected to the laser source. This bare fiber is enclosed in a modified endotracheal tube with a balloon applicator tip (figure 1). The tube, balloon, and the pleural cavity are filled with dilute Intralipid to facilitate scattering of the light.
Figure 1.
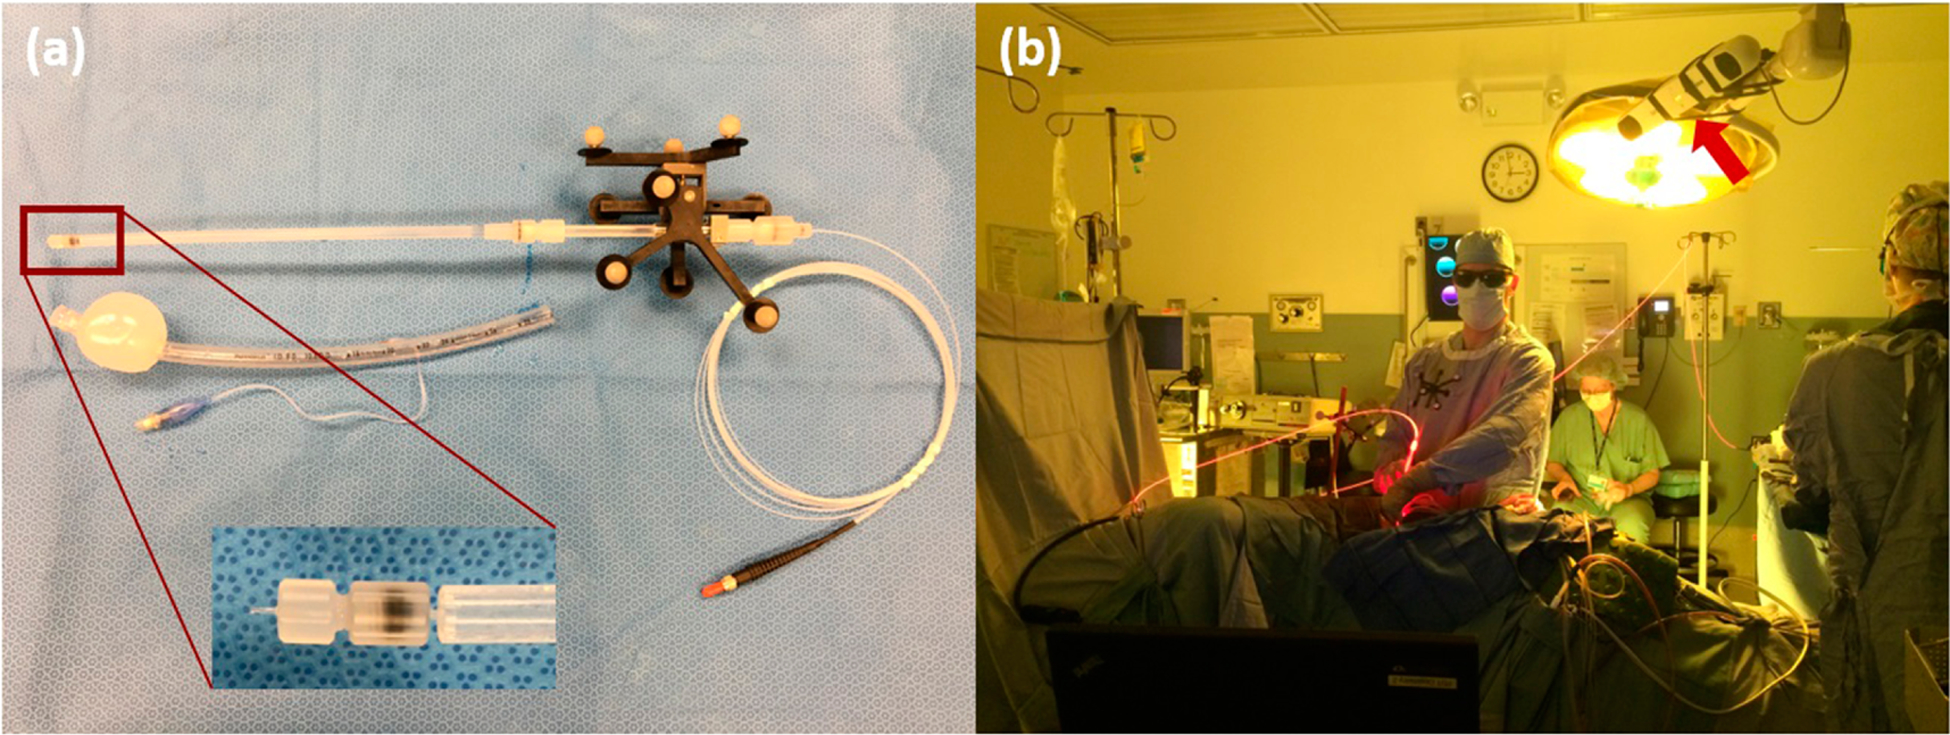
(a) Modified treatment delivery wand. Magnification shows the tip of the treatment wand, which is the tip of the bare fiber used to deliver laser light. The wand is characterized with the IR camera so that the passive markers (9) are tracking the tip of the light source, eliminating the need for a separate calibration calculation to determine the light source position. The wand with the bare fiber and the reflective markers are placed inside the ET tube with balloon applicator that is filled with Intralipid. The fiber tip will be located in the center of the balloon. (b) Image of the IR camera in use during pleural PDT. The camera is positioned above the patient body.
2.2. Optical infrared (IR) navigation system
A commercial IR navigation system (Polaris, NDI, Waterloo, Canada) was used for tracking the light delivery during pleural PDT (Zhu et al 2012, 2015a, 2015b, 2017). The camera consists of a pair of cameras that measure the light reflection from a modulated laser source (with a wavelength of 850 nm). The stereo-cameras typically track 4 passive reflective markers with known geometry in real-time at a rate of 20–60 Hz). The reflective markers track the position of a point at the end of a rigid wand. The position of the point is given by the 3D Cartesian coordinates (x, y, and z) and the orientation (Q0, Q1, Q2, Q3). With the IR navigation system, position of the light source being used to deliver laser light inside the pleural cavity is continuously tracked, and raw position data is used to determine the cavity contour. The accuracy of the system is ~0.5 mm in 3D, and the maximum detection volume for the extended system ~205 × 186 × 147 cm3, which is optimal for use during treatment of the pleural cavity for the patient population studied. The IR camera is positioned above the patient from the ceiling prior to treatment.
2.3. Modified treatment delivery wand
During pleural PDT, light is delivered through a bare fiber connected to the laser source that is enclosed in a modified endotracheal (ET) tube (figure 1). Previous versions of the treatment light delivery system included a rigid metal rod that clipped onto the ET tube (Zhu et al 2012, 2015a, 2015b, 2017, 2019). The passive reflective markers were calibrated with the IR camera so that the position information obtained by the camera was that of the tip of the metal rod. There would be a shift between the location that the camera tracks and the location of the fiber tip inside the balloon. The shift would have to be determined and applied throughout the set of data obtained. The updated treatment delivery wand was created so that the passive reflective spheres would track the location of the fiber tip directly and the rigid metal rod is not present, making the wand easier to maneuver in tighter cavities. Prior to sterilization, the wand was assembled and characterized with the IR camera so that the markers tracked the position of the fiber tip. The consistency of this process was evaluated by determining the shift between the calibrated point to the fiber point after treatment and is summarized in table 1.
Table 1.
Light source point shift from calibration point.
| Case No. | Shift x (mm) | Shift y (mm) | Shift z (mm) | Average |
|---|---|---|---|---|
| 008 | 0.88 ± 0.72 | 0.98 ± 0.12 | −0.52 ± 0.42 | 0.6 ± 0.8 |
| 012 | 1.27 ± 0.11 | −0.17 ± 0.04 | −0.46 ± 0.26 | 0.2 ± 0.9 |
| 014 | 0.70 ± 0.42 | 0.80 ± 0.78 | −0.62 ± 0.45 | 0.3 ± 0.8 |
| 016 | −0.28 ± 0.13 | −0.92 ± 0.19 | −0.53 ± 0.35 | −0.6 ± 0.3 |
| 017 | 1.20 ± 0.43 | 0.51 ± 0.24 | −0.75 ± 0.23 | 0.3 ± 1.0 |
| 018 | 1.64 ± 0.17 | 0.46 ± 0.27 | −0.48 ± 0.35 | 0.5 ± 1.1 |
| 020 | −0.68 ± 0.19 | 0.44 ± 0.20 | −0.89 ± 0.24 | −0.4 ± 0.7 |
| Average | 0.7 ± 0.9 | 0.3 ± 0.7 | −0.6 ± 0.2 |
For record tracking, the patients have been presented with their clinical trial case number.
2.4. Pleural cavity geometry reconstruction
The pleural geometry was determined using position data obtained inside the pleural cavity. A more detailed description of the algorithm to reconstruct the cavity contour can be found elsewhere (Zhu et al 2015b). Briefly, the Cartesian coordinates of the contour were converted to spherical coordinates. For each defined grid, the boundary was found by selecting data points from the largest radial distance. These points were interpolated to find surface information. At the time of surgery, a ‘standard coordinate’ was determined by recording a position with a wand parallel to the patient and the reflective sphere end of the wand towards the head of the patient. The obtained pleural cavity contour was oriented to have the apex location at the top aligned with the z-axis. Figure 2 shows the geometry reconstructed from treatment data with the locations of the eight isotropic detectors. Using the ‘standard coordinate,’ all treated geometries can be oriented the same way for intercomparison.
Figure 2.
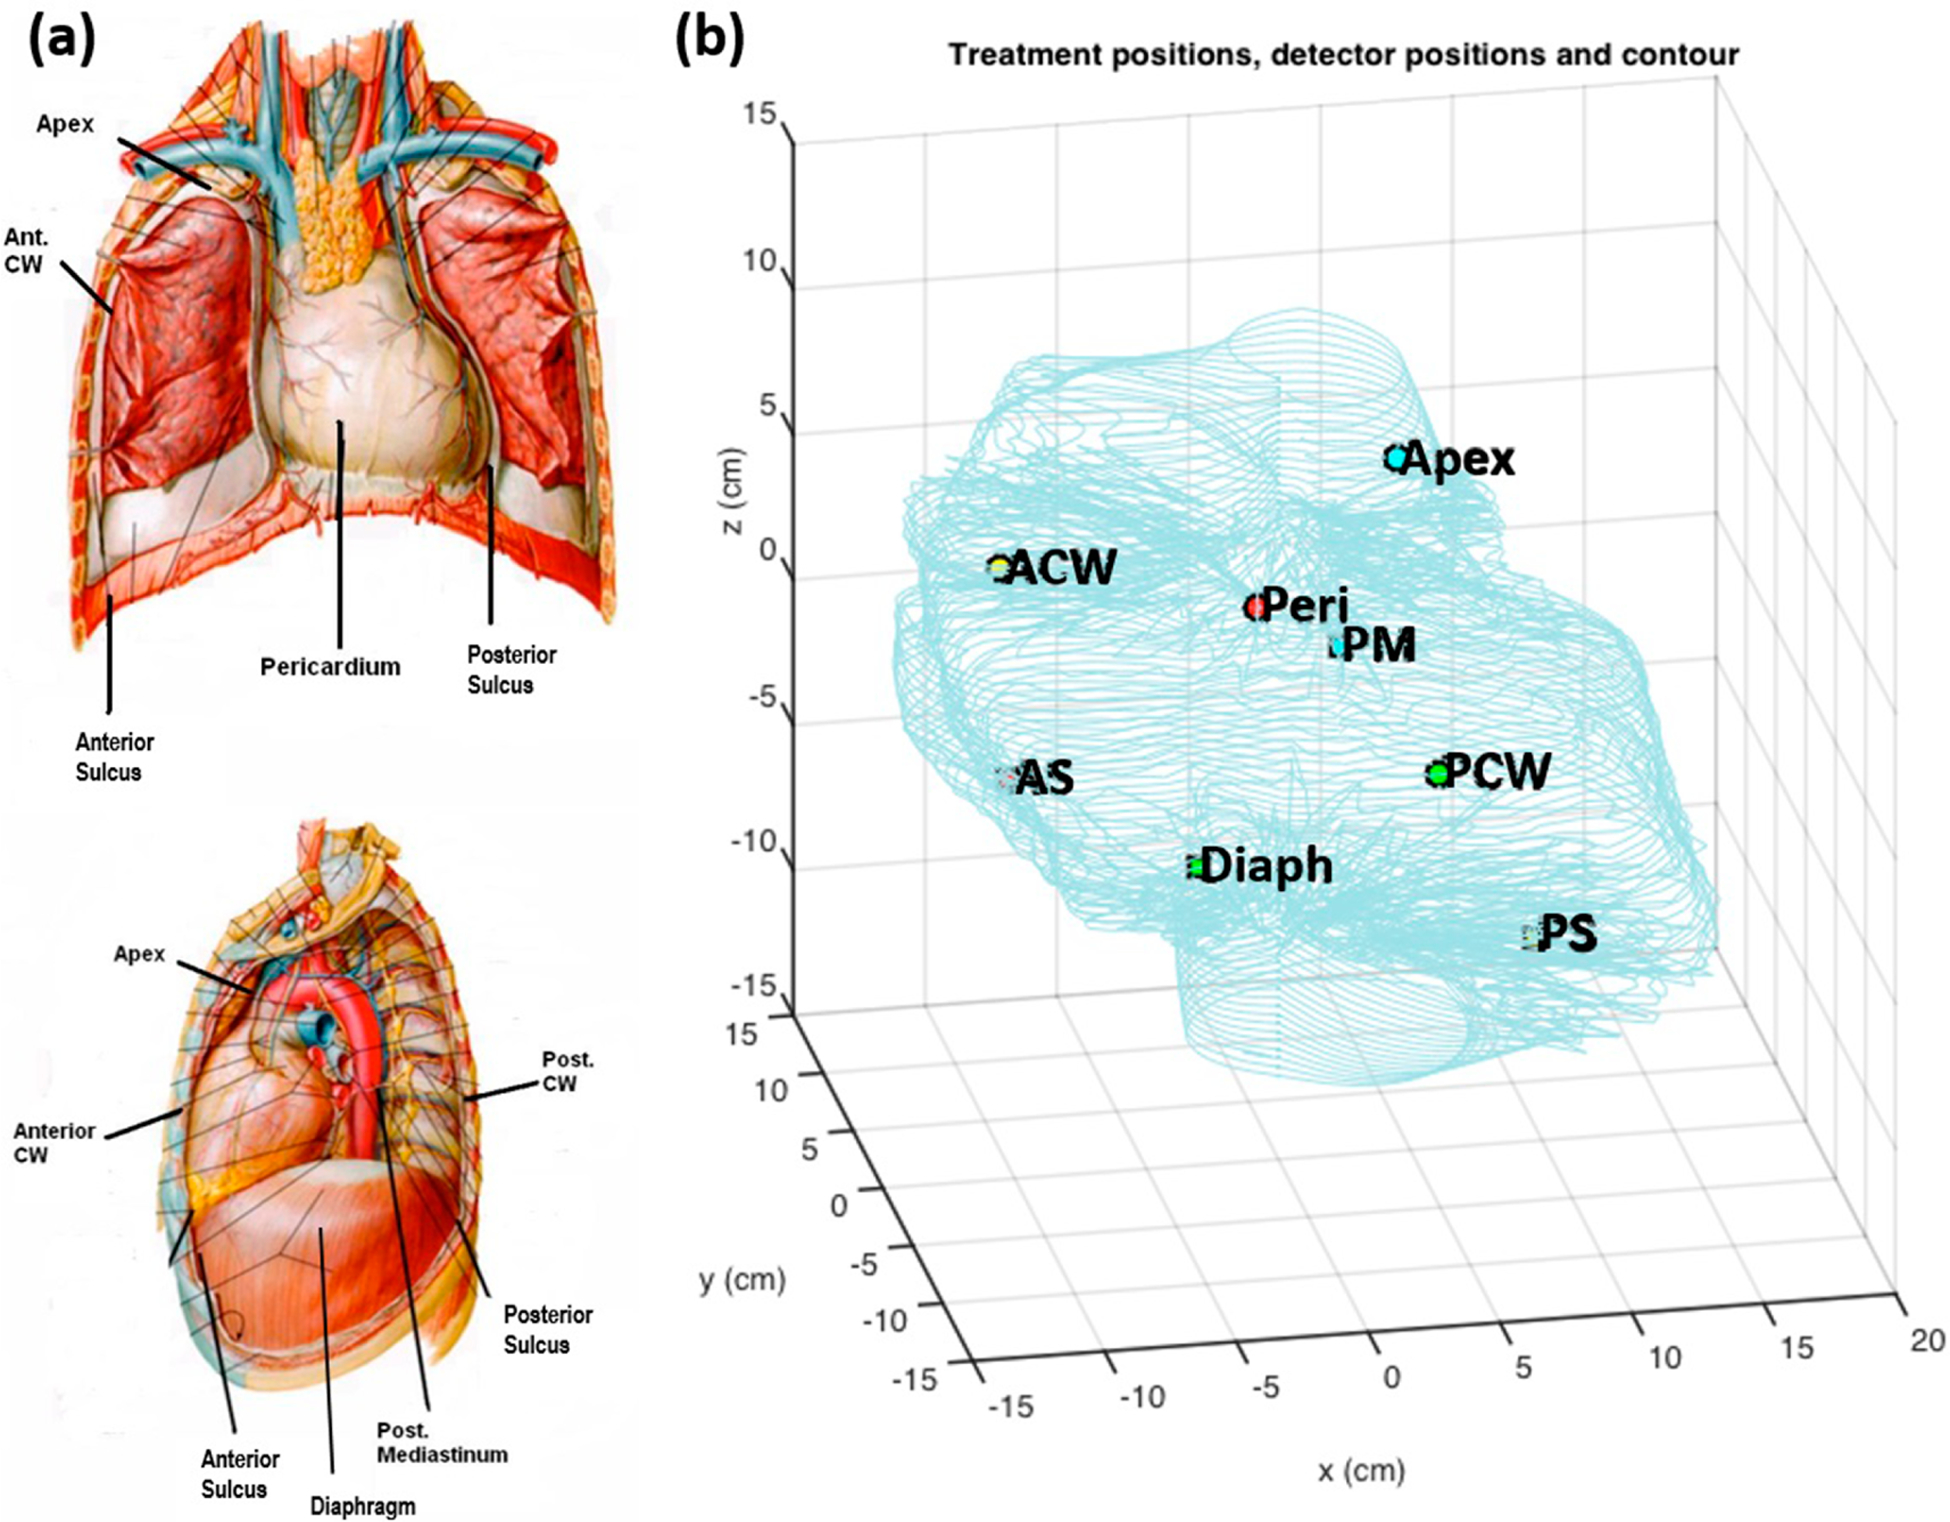
(a) Schematic of detector locations (8) used for each pleural PDT patient. (b) Detector positions inside a patient cavity contour determined from collected light source position data.
2.5. Light fluence calculations
Using the position data obtained throughout the treatment using the optical IR navigation tracking system, the position of the light source is known as well as the surface of the pleural cavity geometry that is being treated. The light dose to each point on the cavity is a sum of the primary (direct) component and the scattered component of the light (Zhu et al 2015b). The primary component of the light fluence rate (ϕprimary) can be calculated by
| (1) |
where S is the source power and r is the distance from the point light source to the point of interest on the pleural cavity surface. In this study, to improve agreement between the measured light dose from the isotropic detectors and the calculated values, a constant scattered light contribution was considered in the calculation. During treatment, the pleural cavity is filled with a dilute solution of Intralipid (0.1% lipid content) to facilitate scattering. To account for the general scattering in the pleural cavity, the light fluence rate (ϕscatter) can be calculated by
| (2) |
where b (mW cm−2) is the constant scatter component that is added for every calculation point. Total light fluence is calculated as the time integral of the light fluence rate (ϕ), which is a function of r and time, t. The agreement between measured and calculated light fluence, a dual correction method was applied to the light fluence rate. Details of this dual correction is described in detail elsewhere (Zhu et al 2015b). The method involves a time-dependent multiplication correction factor (CF(t)) that is applied to the entire calculated light fluence rate. With the addition of the scattered light dose, the light fluence rate can be calculated by
| (3) |
The value of CF is determined by matching the measured and calculated light fluence for one of the eight detectors that has the largest sum fluence at a given time. This value is then applied to the entire 2D volume.
For an integrating-sphere-like cavity such as the pleural cavity, the scattered light fluence rate inside the sphere can be calculated according to (Dimofte et al 2009)
| (4) |
where As is the surface area of the cavity, and Rd is the diffuse reflectance of the scattering wall surface. This is assuming that the area is a sphere and the infinite number of reflections is uniform.
From analytical formulas developed by Ong and Zhu (2016), the expression of Rd for a water-tissue interface can be determined by
| (5) |
This formula was used to calculate Rd in table 4.
Table 4.
Summary of pleural cavity surface area, volume, diffuse reflectance (Rd), and scattering component (b) for each case study. Optical properties were measured at selected detector sites and Rd was calculated using either equation (4) or equation (5) from (Ong and Zhu 2016).
| Case no. | Area (cm2) | Volume (cm3) | b (mW cm−2) | S (mW) | Rd/(1-Rd), equation (4) | Rd/(1-Rd), equation (5) |
|---|---|---|---|---|---|---|
| 008 | 1520 | 7010 | 7.0 | 5200 | 0.512 | 0.447–0.744 |
| 012 | 886 | 2742 | 7.5 | 5040 | 0.330 | 0.423–0.769 |
| 014 | 1710 | 8192 | 7.5 | 5200 | 0.617 | 0.503–0.769 |
| 016 | 1158 | 6095 | 7.5 | 5200 | 0.418 | 0.522–0.764 |
| 017 | 1447 | 7618 | 6.5 | 5200 | 0.452 | 0.529–0.743 |
| 018 | 1766 | 8103 | 7.5 | 5512 | 0.601 | 0.353–0.782 |
| 020 | 1262 | 6308 | 7.0 | 5200 | 0.424 | 0.443–0.626 |
| Average | 1400 ± 300 | 6600 ± 1900 | 7.2 ± 0.4 | 5200 ± 100 | 0.48 ± 0.10 |
2.6. Extrapolation of detector locations
For each pleural PDT treatment, the physician must provide the location of the eight isotropic detectors that are sutured into the pleural cavity by pointing a separate calibrated wand tip to each detector and recording the position coordinates. While this is an accurate method of determining the detector locations instantly in the clinical setting, sometimes it is not possible to obtain them due to time constraints in the operating room or missed field of view from the camera to the wand. In some scenarios, the detector locations were given, but the coordinate system for the treatment data was changed due to removal or blockage of the global reference to the patient bed. A post-processing procedure was developed and applied to extrapolate the locations of the detectors to compare with the measured detector positions. With the development of this method, the data acquisition process in the operating room can be streamlined.
During the course of treatment, it is rare for the treatment light to illuminate multiple detectors simultaneously since the cavity is fairly large (with average volumes of ~6.5 l). For each of the measured cumulative fluence data for each detector, time points where there are ‘features’ were determined. These are described as areas where the treatment wand is close to a detector and is illuminating that area specifically. Those regions are characterized by their rapid increase in cumulative fluence (indicated in red) or high fluence rates and are illustrated for patient case 020 at the apex detector in figure 3. Since the pleural surface is not divided into eight equal area sectors with one detector for each sector, the time spent illuminating a detector may be greater than 1/8.
Figure 3.
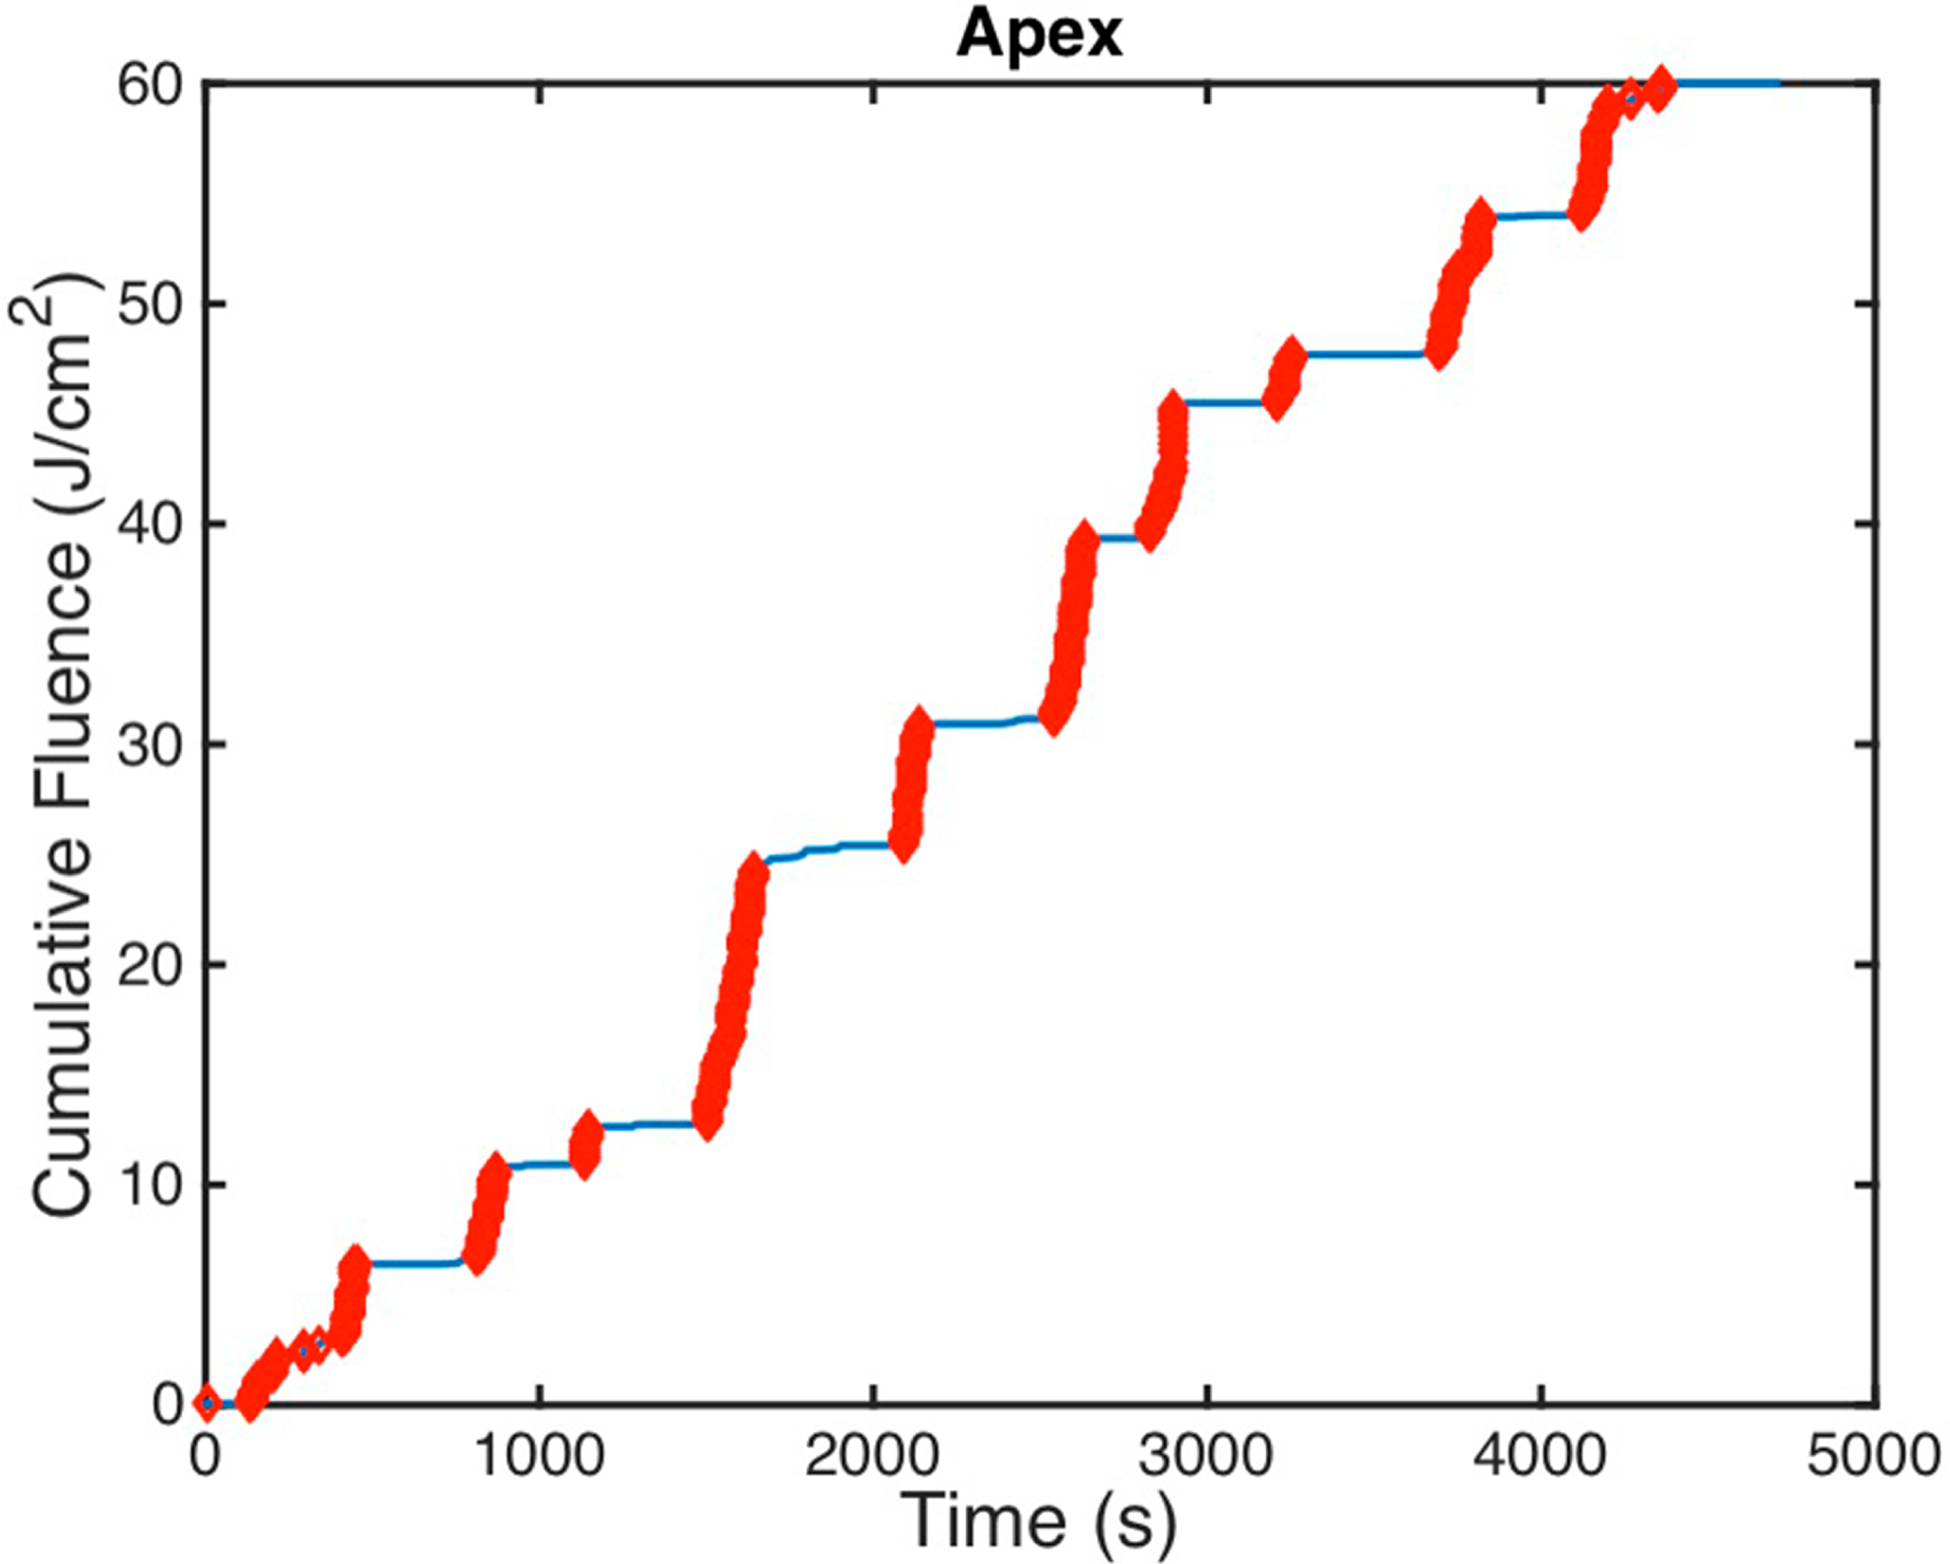
Measured cumulative fluence is shown for patient case 020 at the paex detector with regions highlighted in thick red that display ‘features.’ These features were used to determine the time stamps that are indicative of the treatment wand location being near that particular detector.
Using the features for each detector, the times at which the treatment wand was near the detector were found. Times when the treatment light was illuminating the detector were times that show increases in fluence. The locations of the treatment wand for those times were plotted, and the center of mass was used as the extrapolated detector location. These are shown as an ‘x’ symbol next to the measured detector locations in solid circles in figure 4. A summary of the shifts between extrapolated and measured detector locations for each patient case is in table 2. For case number 016, there is no reported shift between the extrapolated detector location and the measured detector location because there is no data for the measured detector location. In the operating room, if it is proving to be difficult to locate a detector using the IR navigation system, it is possible that the physician will skip that step to minimize the patient’s time on the operating table. However, using these methods, it is possible to extrapolate that location of the detector and calculate the fluence to be compared to the detector-measured fluence.
Figure 4.
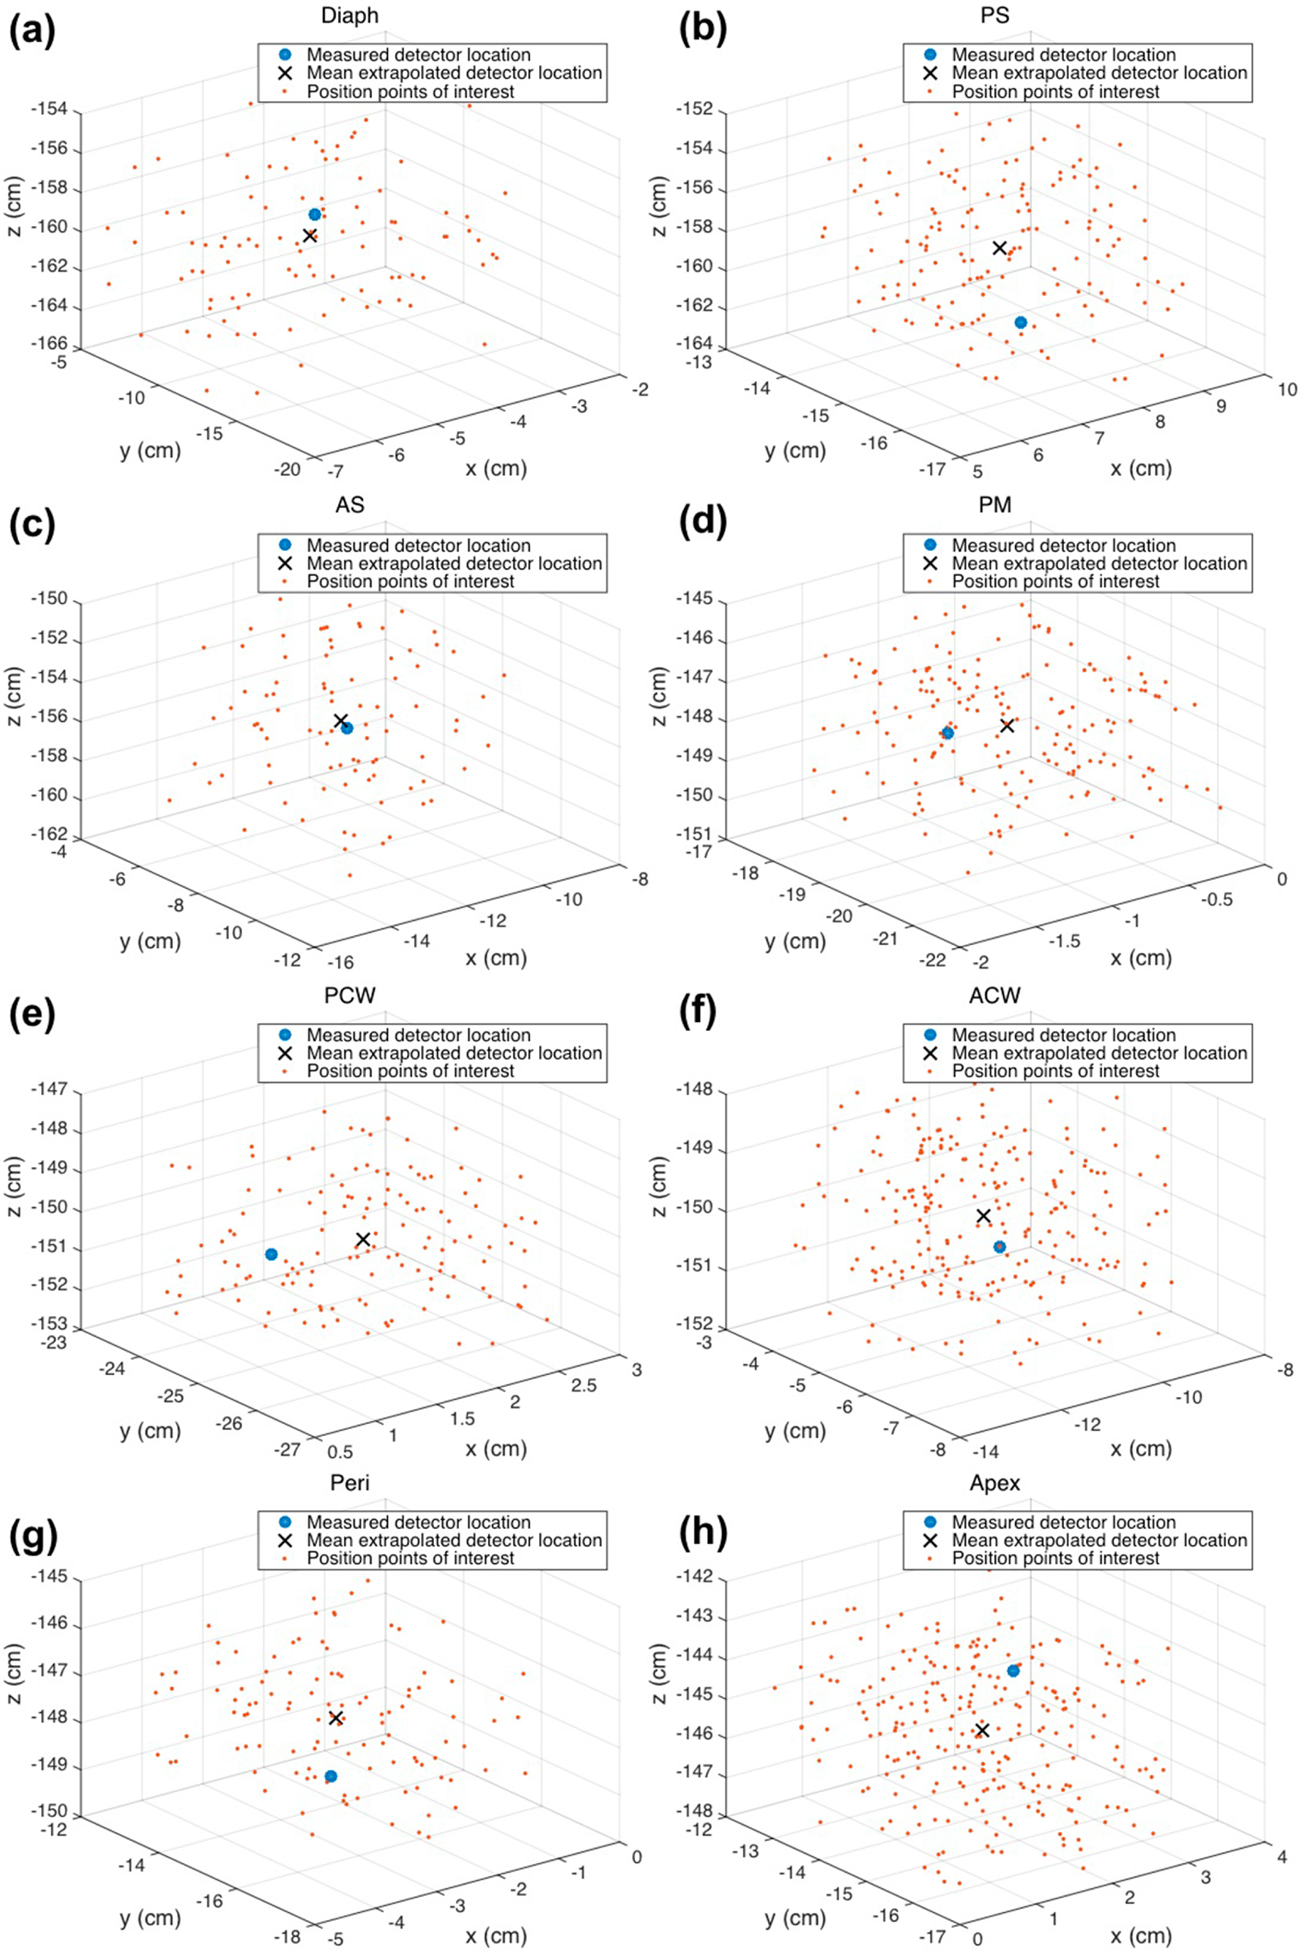
Treatment wand locations for times when the detectors were being illuminated are plotted in 3D for each detector for patient case 020. The center of mass was used as the extrapolated detector location, shown as an ‘x,’ and the measured detector location is shown as a solid circle.
Table 2.
Shifts between measured and extrapolated detector locations summarized in each cardinal direction (Δx, Δy, and Δz) and total distance (d) for (a) each patient and (b) averaged across all patient cases for each site. Shifts are described in units of cm.
| (a) | ||||
|---|---|---|---|---|
| Detector | Δx (cm) | Δy (cm) | Δz (cm) | d (cm) |
| Case 008 | ||||
| Diaph | −1.28 | 2.83 | −1.87 | 3.63 |
| PS | 0.77 | 1.12 | 2.18 | 2.57 |
| AS | 1.28 | 1.03 | −1.47 | 2.21 |
| PM | 1.53 | −0.29 | −0.83 | 1.76 |
| PCW | 1.07 | 1.29 | −1.51 | 2.25 |
| ACW | −1.86 | 1.77 | 1.11 | 2.80 |
| Peri | −1.12 | −0.87 | 1.28 | 1.91 |
| Apex | 1.06 | 0.46 | 2.12 | 2.41 |
| Average | 0.2 ± 1.4 | 0.9 ± 1.2 | 0.1 ± 1.7 | 2.4 ± 0.6 |
| Case 012 | ||||
| Diaph | −2.87 | 2.20 | −2.77 | 4.56 |
| PS | −0.91 | 1.98 | −2.11 | 3.03 |
| AS | 2.10 | 1.90 | −3.19 | 4.26 |
| PM | 0.92 | 1.12 | −1.84 | 2.34 |
| PCW | 1.98 | 2.09 | −1.40 | 3.20 |
| ACW | 2.17 | −1.93 | −0.98 | 3.07 |
| Peri | −2.86 | −2.47 | 2.18 | 4.36 |
| Apex | 0.97 | 0.06 | 3.69 | 3.82 |
| Average | 0.2 ± 2.1 | 0.6 ± 1.9 | −0.8 ± 2.4 | 3.6 ± 0.8 |
| Case 014 | ||||
| Diaph | 1.97 | −1.28 | −4.62 | 5.18 |
| PS | 1.54 | 2.11 | −3.19 | 4.12 |
| AS | 1.77 | 1.65 | 3.21 | 4.02 |
| PM | 1.10 | 0.99 | 1.28 | 1.95 |
| PCW | − 1.07 | 2.89 | −2.32 | 3.86 |
| ACW | − 0.98 | −0.67 | −1.97 | 2.30 |
| Peri | − 2.50 | −2.01 | −1.69 | 3.62 |
| Apex | − 1.11 | −1.48 | 3.88 | 4.30 |
| Average | 0.1 ± 1.7 | 0.3 ± 1.9 | −0.7 ± 3.1 | 3.7 ± 1.1 |
| Case 016 | ||||
| Diaph | 3.86 | − 1.18 | −4.17 | 5.81 |
| PS | 1.39 | 2.11 | 3.27 | 4.13 |
| AS | 1.86 | 2.11 | −3.19 | 4.26 |
| PM | − 1.58 | 1.09 | −4.10 | 4.53 |
| PCW | − 1.57 | 2.17 | −1.01 | 2.87 |
| ACW | 0.98 | − 0.99 | 3.86 | 4.10 |
| Peri | 0.89 | − 0.90 | −2.79 | 3.06 |
| Apex | 1.39 | − 1.07 | 2.83 | 3.33 |
| Average | 0.9 ± 1.8 | 0.4 ± 1.6 | −0.7 ± 3.5 | 4.0 ± 1.0 |
| Case 017 | ||||
| Diaph | 1.39 | −4.20 | −1.87 | 4.80 |
| PS | 1.29 | 1.40 | −3.20 | 3.72 |
| AS | 1.13 | 1.18 | −1.78 | 2.42 |
| PM | 2.11 | −1.73 | −1.98 | 3.37 |
| PCW | 1.09 | −0.98 | 2.09 | 2.56 |
| ACW | 1.33 | 2.32 | −1.20 | 2.93 |
| Peri | 1.72 | 1.38 | −1.78 | 2.84 |
| Apex | 0.91 | 1.11 | 2.43 | 2.83 |
| Average | 1.4 ± 0.4 | 0.1 ± 2.2 | −0.9 ± 2.0 | 3.2 ± 0.8 |
| Case 018 | ||||
| Diaph | 0.99 | −1.19 | −2.11 | 2.61 |
| PS | 1.19 | −0.92 | −1.30 | 1.98 |
| AS | − 1.11 | 4.18 | −4.76 | 6.43 |
| PM | 0.91 | 1.18 | −1.41 | 2.06 |
| PCW | − 1.88 | 1.30 | −0.92 | 2.46 |
| ACW | 2.76 | − 3.20 | 1.92 | 4.64 |
| Peri | − 2.40 | 1.20 | −1.29 | 2.97 |
| Apex | 1.08 | − 4.53 | 2.42 | 5.24 |
| Average | 0.2 ± 1.8 | 0.2 ± 2.8 | 0.4 ± 2.4 | 3.6 ± 1.7 |
| Case 020 | ||||
| Diaph | 0.01 | −0.27 | −1.17 | 1.20 |
| PS | 0.37 | 0.07 | −2.21 | 2.20 |
| AS | 0.90 | −0.93 | −1.52 | 1.99 |
| PM | 0.01 | 1.28 | −0.92 | 1.57 |
| PCW | −0.32 | 0.90 | −0.74 | 1.20 |
| ACW | 0.05 | −0.28 | −0.43 | 0.52 |
| Peri | −1.02 | −1.50 | −0.29 | 1.84 |
| Apex | 0.09 | −0.52 | 1.75 | 1.82 |
| Average | 0.0 ± 0.6 | −0.2 ± 0.9 | 0.4 ± 1.3 | 1.5 ± 0.6 |
| (b) | ||||
| Diaph | 0.6 ± 2.2 | −0.4 ± 2.4 | −2.7 ± 1.3 | 4.0 ± 1.6 |
| PS | 0.8 ± 0.9 | 1.1 ± 1.2 | −0.9 ± 2.6 | 3.1 ± 0.9 |
| AS | 1.1 ± 1.1 | 1.6 ± 1.5 | −1.8 ± 2.5 | 3.7 ± 1.6 |
| PM | 0.7 ± 1.2 | 0.5 ± 1.1 | −1.4 ± 1.6 | 2.5 ± 1.1 |
| PCW | −0.1 ± 1.5 | 1.4 ± 1.2 | −0.8 ± 1.4 | 2.6 ± 0.8 |
| ACW | 0.6 ± 1.7 | −0.4 ± 2.0 | 0.3 ± 2.1 | 2.9 ± 1.3 |
| Peri | −1.0 ± 1.8 | −0.7 ± 1.5 | −0.6 ± 1.8 | 2.9 ± 0.9 |
| Apex | 0.5 ± 0.9 | −0.8 ± 2.0 | 2.7 ± 0.9 | 3.4 ± 1.3 |
3. Results and discussion
The position of the light source being used to deliver light during pleural PDT was tracked throughout the treatment and used to acquire the pleural cavity geometry and calculate the light fluence distribution (see figure 5). Calculation methods were improved from using just the primary (direct) light component to adding a constant scattered light component (see figure 6). The calculation method was further improved by implementing a time-dependent dual correction factor (CF) (see figure 7). Evaluation of the light fluence calculation was done by comparing the calculated light fluence at the locations of the eight isotropic detectors with the measured light dose.
Figure 5.
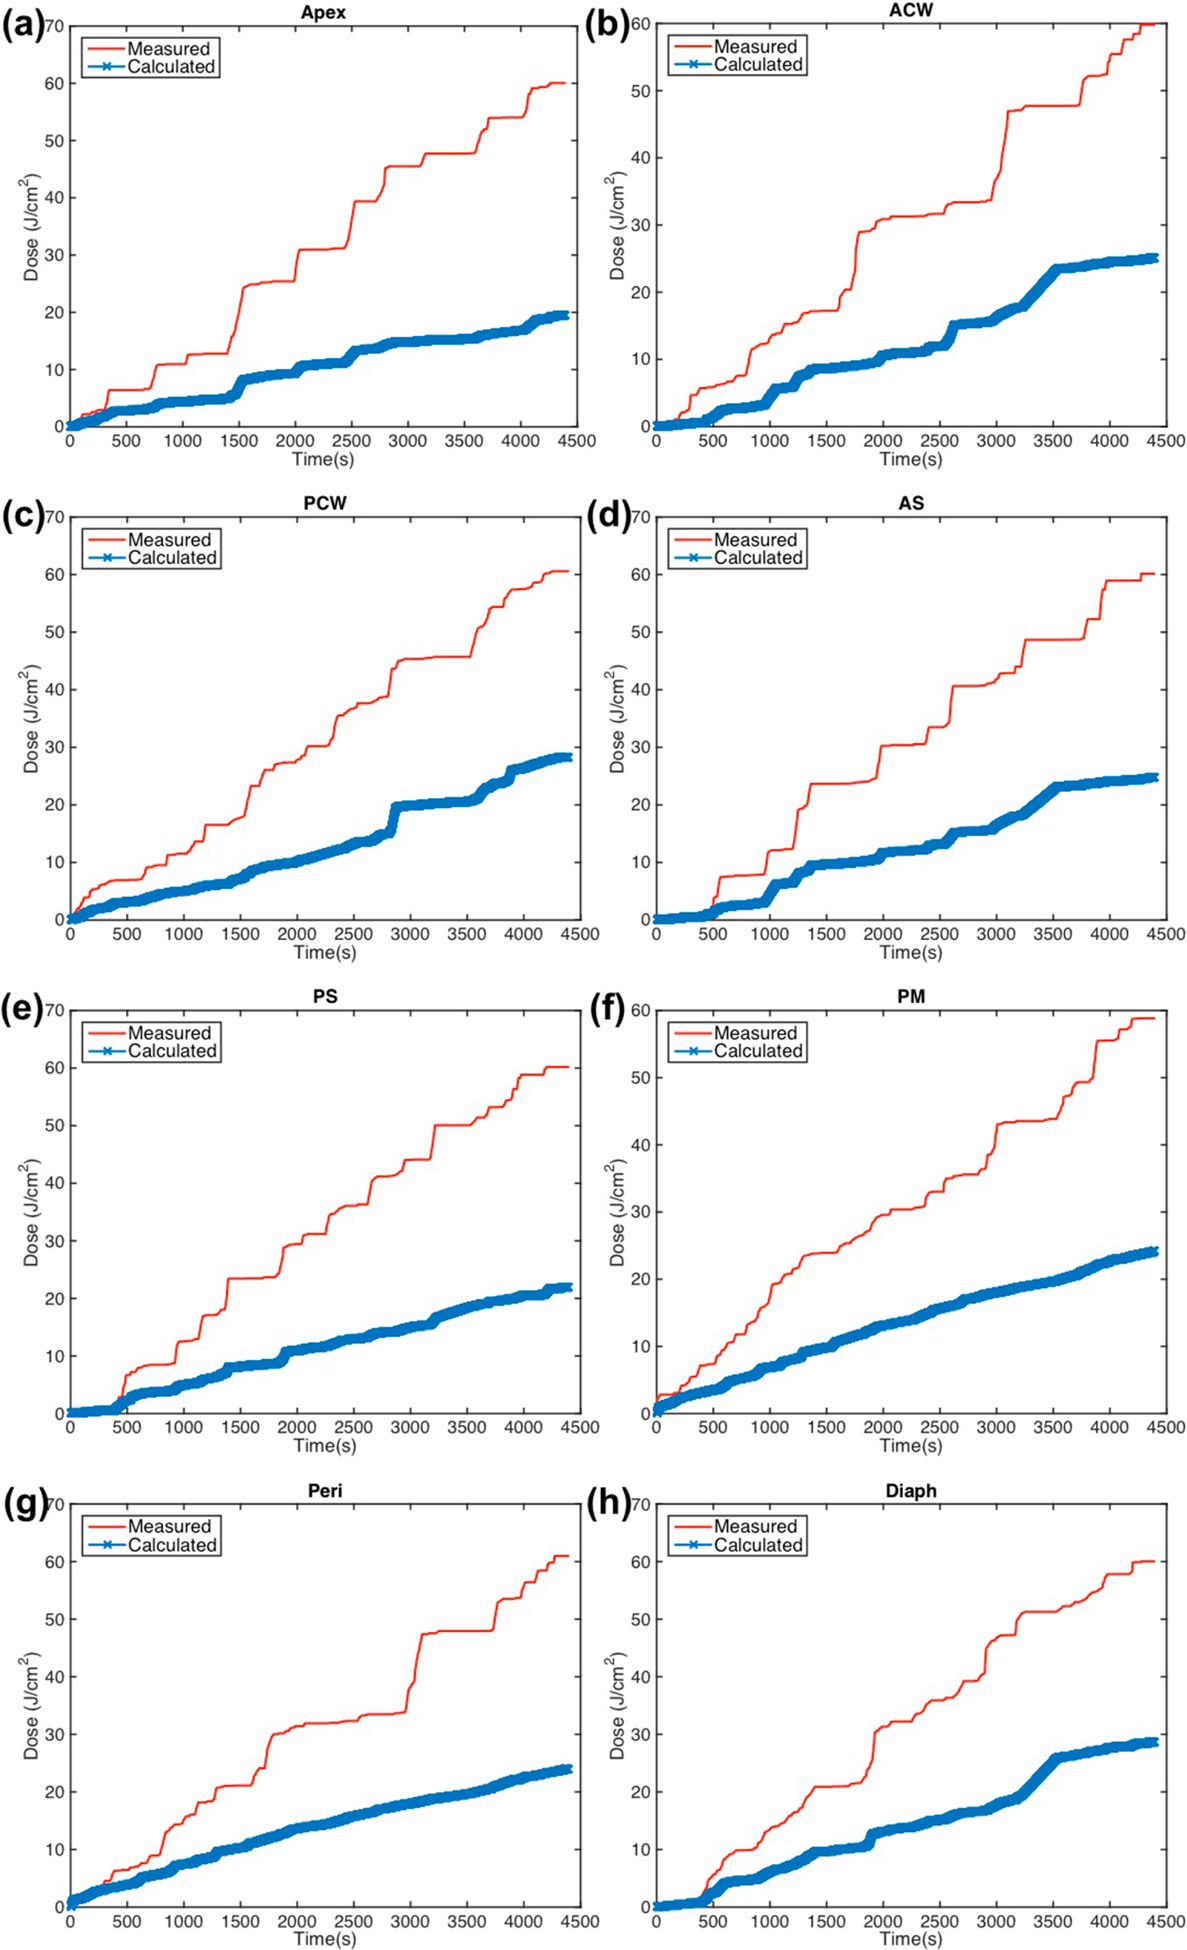
Measured (red solid line) light fluence data over the course of treatment along with calculated (blue ‘x’) light fluence using the primary component (equation (1)) plotted for eight detector locations: (a) apex (b) anterior chest wall (c) posterior chest wall (d) anterior sulcus (e) posterior sulcus (f) posterior mediastinum (g) pericardium (h) diaphragm.
Figure 6.
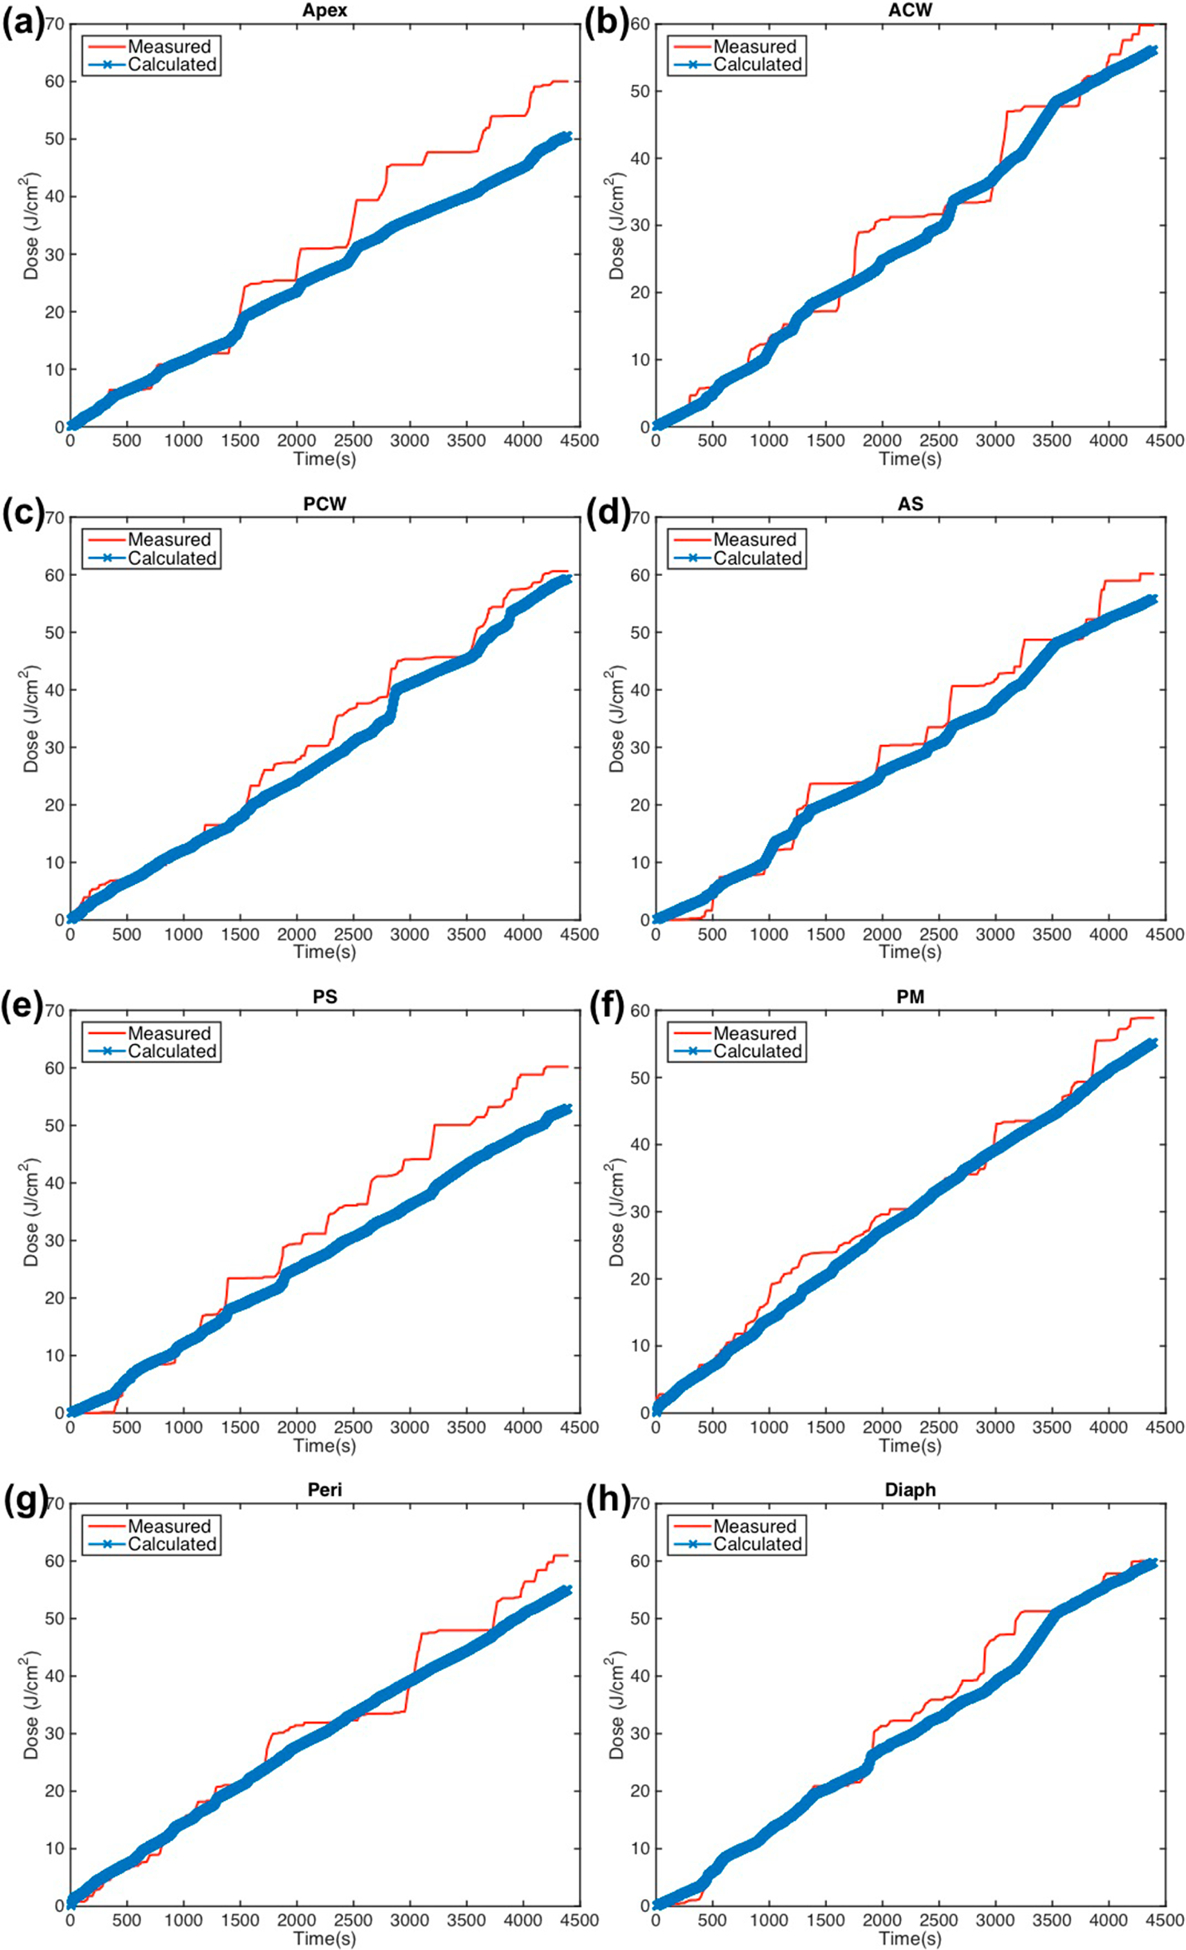
Measured (red solid line) light fluence data over the course of treatment along with calculated (blue ‘x’) light fluence using the primary component with fixed scattered light (equation (2)) plotted for eight detector locations: (a) apex (b) anterior chest wall (c) posterior chest wall (d) anterior sulcus (e) posterior sulcus (f) posterior mediastinum (g) pericardium (h) diaphragm.
Figure 7.
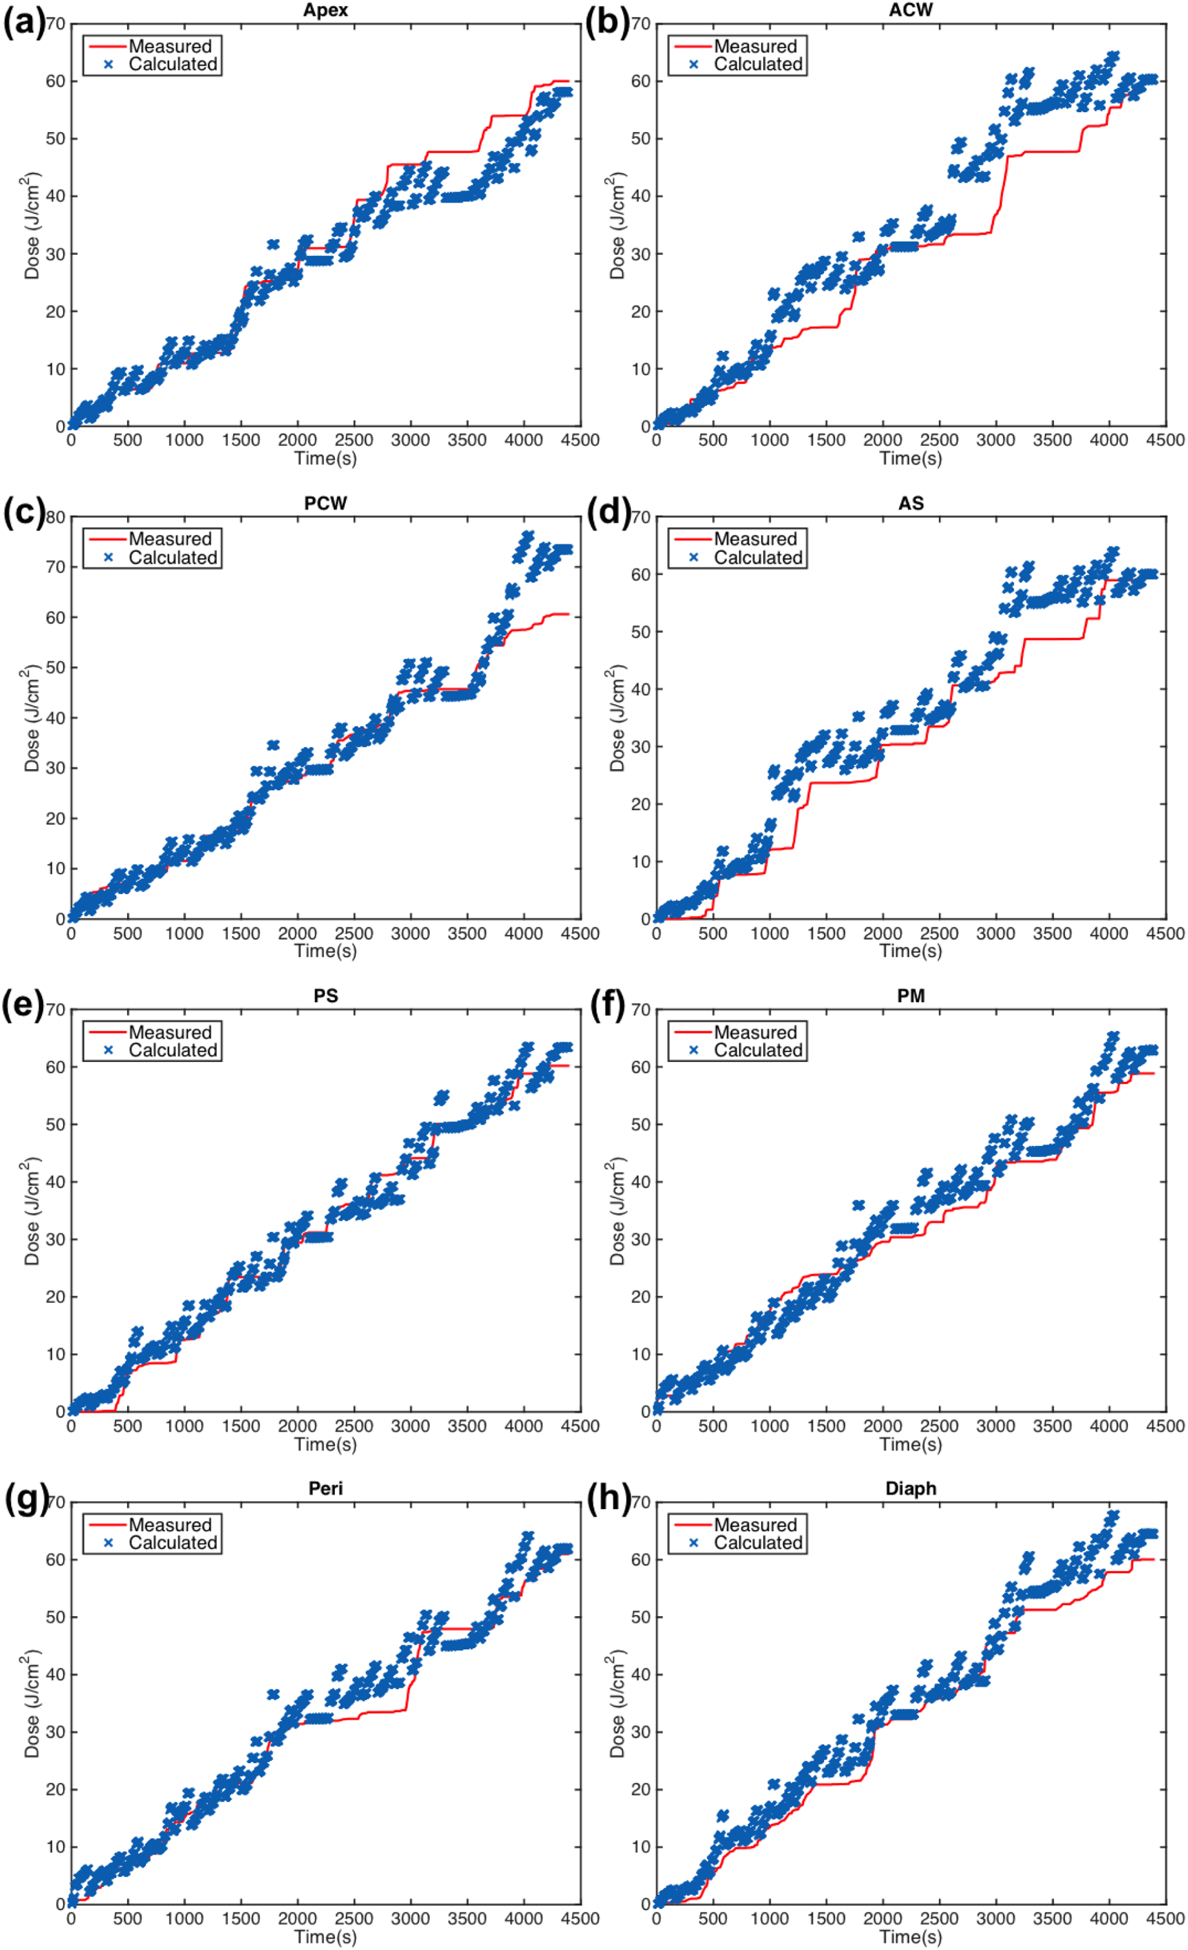
Measured (red solid line) light fluence data over the course of treatment along with calculated (blue ‘x’) light fluence using the primary component with fixed scattered light and the dual correction method (equation (3)) plotted for eight detector locations: (a) apex (b) anterior chest wall (c) posterior chest wall (d) anterior sulcus (e) posterior sulcus (f) posterior mediastinum (g) pericardium (h) diaphragm.
Using the information from the treatment data and the measured fluence data at each isotropic detector, the detector locations were extrapolated and compared to the measured ones from the operating room. For patient case 020, the detector locations were able to be determined to an accuracy of better than 2 cm, however, this is not always possible for each case. Depending on the geometry of the pleural cavity of the patient and the location of the infrared camera on the day of surgery, some of the detectors may be illuminated and measuring light fluence while the IR system is unable to obtain treatment wand location information. For those cases, the position data of the wand cannot be used to determine the sutured detector location. The accuracy of this method can be greatly increased with more efficient data collection of the treatment wand location. Larger discrepancies between measured and extrapolated detector locations indicate insufficient data to accurately extrapolate the detector location to be used to compare the measured and calculated light fluence data. Comparison of the light fluence data at these eight locations serve as an indicator of the accuracy of the calculated 2D light distribution.
For earlier cases (case numbers 012–017), the data obtained from extrapolated isotropic detector locations is not as accurate as those of later cases (case numbers 018–020). Camera placement is critical prior to surgery and a well-placed camera will be able to collect more treatment light position information during treatment. This process was improved over time with experience and knowledge about patient placement.
Shifts in x, y, and z directions for each extrapolated detector location compared to the measured detector location were averaged across the patient cases studied and summarized in table 3. The shift in the extrapolated detector locations for the diaphragm and apex positions show a systematic shift with standard deviations that are smaller. These average shifts were applied to the extrapolated positions and light fluence was calculated and compared. The extrapolated position for the diaphragm detector was shifted in the z direction by −2.79 cm, and the extrapolated position for the apex detector was shifted in the z direction by 2.83 cm. With these new extrapolated positions, the calculated fluence at the end of treatment better matched the measured fluence. With the adjusted extrapolated diaphragm and apex detector locations, both calculation methods have improved agreement with measured fluence. Using the primary and scattered components of light, the fluence agrees to within 15% for both diaphragm and apex detectors. The addition of the dual correction factor improves the agreement to within 13%. For cases where there is no measured detector location, this method of extrapolating the detector location from the treatment data can be used.
Table 3.
Percent error from measured light dose at the end of treatment with calculated light fluence using the (a) primary component (equation (1)), only the (b) primary component with CF, the (c) primary and scattering component (equation (2)), and the (d) primary and scattering component with CF (equation (3)) The values in the parenthesis are the values for the detector position extrapolated from the method described in section 2.6 since the actual detector positions were not available.
| (a) Primary component only | |||||||||
|---|---|---|---|---|---|---|---|---|---|
| Case no. | Diaph | PS | AS | PM | PCW | ACW | Peri | Apex | Avg. |
| 008 | (40.7%) | (41.7%) | (35.1%) | (36.4%) | (29.6%) | (59.8%) | (56.2%) | (32.2%) | 42% ± 11% |
| 012 | 39.8% | 56.4% | 57.2% | 58.5% | 51.0% | 56.6% | 29.2% | 45.8% | 49% ± 10% |
| 014 | 52.9% | 46.9% | 63.9% | 42.4% | 46.5% | 67.6% | 51.8% | 50.0% | 53% ± 9% |
| 016 | 50.0% | 47.4% | 52.4% | 58.3% | 41.2% | 56.5% | (47.1%) | (60.9%) | 52% ± 7% |
| 017 | 39.4% | 49.3% | 63.4% | 44.5% | 28.2% | 39.6% | 29.2% | 45.7% | 42% ± 11% |
| 018 | 43.2% | 52.8% | 62.1% | 52.1% | 45.4% | 63.0% | 58.9% | 61.4% | 55% ± 8% |
| 020 | 52.2% | 63.6% | 58.7% | 59.0% | 53.2% | 58.0% | 60.6% | 67.5% | 59% ± 5% |
| Avg. | 46% ± 6% | 51% ± 7% | 56% ± 10% | 50% ± 9% | 42% ± 10% | 57% ± 9% | 48% ± 13% | 52% ± 12% | |
| (b) Primary and scattering component | |||||||||
| Case no. | Diaph | PS | AS | PM | PCW | ACW | Peri | Apex | Avg. |
| 008 | (10.6%) | (6.4%) | (7.6%) | (5.1%) | (10.4%) | (9.3%) | (6.1%) | (12.9%) | 9% ± 3% |
| 012 | 13.8% | 7.4% | 10.1% | 10.2% | 5.4% | 8.3% | 15.8% | 1.3% | 9% ± 5% |
| 014 | 1.0% | 6.3% | 3.0% | 3.7% | 9.0% | 3.2% | 1.2% | 15.1% | 5% ± 5% |
| 016 | 2.5% | 1.7% | 5.9% | 4.2% | 15.4% | 13.9% | (14.6%) | (9.4%) | 9% ± 6% |
| 017 | 12.9% | 8.7% | 6.7% | 14.9% | 6.6% | 14.7% | 13.7% | 13.1% | 11% ± 4% |
| 018 | 13.6% | 5.7% | 9.0% | 4.2% | 9.2% | 9.4% | 6.5% | 8.9% | 8% ± 3% |
| 020 | 3.1% | 8.3% | 3.5% | 2.5% | 1.6% | 2.4% | 6.1% | 13.1% | 5% ± 4% |
| Avg. | 8% ± 6% | 6% ± 2% | 7% ± 3% | 6% ± 5% | 8% ± 4% | 9% ± 5% | 9% ± 6% | 11% ± 5% | |
| (c) Primary component with dual correction (CF) | |||||||||
| Case no. | Diaph | PS | AS | PM | PCW | ACW | Peri | Apex | Avg. |
| 008 | (20.4%) | (10.4%) | (14.0%) | (12.1%) | (14.8%) | (13.9%) | (14.1%) | (8.1%) | 14% ± 4% |
| 012 | 20.5% | 21.6% | 10.1% | 26.3% | 16.7% | 13.3% | 0.8% | 1.3% | 14% ± 9% |
| 014 | 1.0% | 6.3% | 35.0% | 3.7% | 9.0% | 32.1% | 1.2% | 15.1% | 13% ± 14% |
| 016 | 2.5% | 18.1% | 22.5% | 4.2% | 15.4% | 19.3% | (7.9%) | (10.7%) | 13% ± 7% |
| 017 | 15.2% | 8.3% | 23.5% | 17.6% | 6.6% | 13.5% | 19.7% | 15.0% | 15% ± 6% |
| 018 | 13.6% | 3.8% | 9.0% | 18.6% | 7.2% | 18.6% | 5.6% | 0.4% | 10% ± 7% |
| 020 | 24.3% | 8.9% | 6.4% | 24.3% | 47.1% | 6.9% | 17.3% | 4.4% | 18% ± 14% |
| Avg. | 14% ± 9% | 11% ± 6% | 17% ± 10% | 15% ± 9% | 17% ± 14% | 17% ± 8% | 10% ± 8% | 8% ± 6% | |
| (d) Primary and scattering component with dual correction (CF) | |||||||||
| Case no. | Diaph | PS | AS | PM | PCW | ACW | Peri | Apex | Avg. |
| 008 | (6.6%) | (2.1%) | (2.2%) | (4.5%) | (8.6%) | (6.9%) | (5.4%) | (9.9%) | 6% ± 3% |
| 012 | 8.6% | 1.2% | 4.3% | 5.4% | 5.1% | 5.4% | 10.2% | 2.9% | 5% ± 3% |
| 014 | 4.5% | 9.0% | 7.5% | 7.9% | 3.5% | 4.3% | 5.5% | 9.0% | 6% ± 2% |
| 016 | 1.9% | 2.8% | 5.3% | 3.1% | 9.8% | 8.2% | 6.8% | 9.7% | 6% ± 3% |
| 017 | 8.9% | 3.8% | 1.7% | 8.3% | 4.3% | 11.2% | 9.8% | 3.5% | 7% ± 4% |
| 018 | 4.0% | 2.3% | 8.1% | 0.8% | 3.4% | 7.1% | 11.2% | 6.6% | 5% ± 3% |
| 020 | 6.2% | 4.7% | 1.0% | 6.4% | 12.4% | 2.3% | 1.6% | 0.4% | 5% ± 4% |
| Avg. | 6% ± 3% | 4% ± 3% | 4% ± 3% | 5% ± 3% | 7% ± 4% | 7% ± 3% | 7% ± 3% | 6% ± 4% | |
The improved light delivery wand was evaluated for consistency before and after treatment. Characterization of the wand tip location is done prior to sterilization. The design of the wand involves assembly of the reflective spheres immediately before treatment. To ensure that the optical IR tracking system is tracking the fiber tip after assembly, the shift between the calibrated point and the light source fiber tip point was determined after treatment. The results are summarized in table 1. The maximum shift was 1.64 ± 0.17 mm, which is less than the 2 mm measurement uncertainty from pivoting procedure to characterize the wand tip location relative to the reflective markers. This confirms that the modified treatment delivery wand is an improvement from having to determine and apply a 3 mm shift from the laser source position to the tracking device point position. This eliminates a potential uncertainty from implementation in the clinical setting, where the shift may not be able to be determined at every case.
Using only the primary light component, the calculated light dose is consistently lower than the measured dose for all eight detector locations, as seen in figure 3. For the case shown in figure 3 (case 020), the maximum percent error from the measured light dose at the end of treatment using equation (1) at each detector location is 67.5% at the Apex location. For six patient case studies, the average deviation for all detectors was 50.4% ± 12.6%. From the data, it is clear that ϕprimary is not fully accounting for the light dose that is delivered. The percent error from measurements using ϕprimary is summarized for each detector location and each patient case in table 3(a). The mean values for each detector across all patient cases as well as the mean values for each patient case across all detectors are shown with their standard deviations.
Agreement between the calculated light fluence and measured values are further improved with the addition of a constant scattered light dose. Figure 4 shows the data for case 020 with calculations using equation (2). It is seen that for all of the detectors, a constant value for b (in this case, b = 7.2 mW cm−2) improved the percent deviation. The maximum deviation for case 020 was seen at the Apex location at 13.1%. The average deviation for all detectors and case studies is 7.9% ± 2.2%, and the data is summarized in table 3(b).
With the use of the dual correction factor to the calculation with ϕprimary, the agreement is improved slightly compared to using ϕprimary without the dual correction factor, and is summarized in table 3(c). For case 020, the maximum deviation is 47.1% from the PCS detector location. The average deviation for all detectors and case studies for this calculation method is 13.7% ± 2.3%. While this method of calculation improves the agreement, the resulting errors between isotropic detector measurement and calculations are still large.
Implementation of the dual correction method to the calculation with both primary and scattered light components improved the agreement between measured and calculated final light dose the most. The maximum percent error for case 020 was reduced to 12.4% at the PCW location. The average across all detectors and patient cases was 5.6% ± 0.7%. The deviations are summarized in table 3(d). We found that the overall agreement of light fluence for all detectors at the end of PDT treatment between calculation and the measurement is significantly better for the current Photofrin-mediated clinical trial than a HPPH-mediated clinical trial (Zhu et al 2019). This is probably because of the improved source positioning (see figure 1(a)) used in the current Photofrin-mediated clinical trial.
Values of the scattered component used for the calculation of ϕ for each case along with the surface areas and volumes of the treated pleural cavity obtained with them optical IR navigation system are summarized in table 4. The surface areas range from 886 cm2 to 1766 cm2, and the volumes range from 2742 cm3 to 8192 cm3. These ranges for surface area and volume are similar to those reported for pleural cavity in prior studies (Penjweini et al 2017, Zhu et al 2019). The scatter component, b, does not have large variation (7.2 ± 0.4 mW cm−2), indicating that a constant average scattered component can be used in calculating scattered fluence in pleural PDT. This conclusion is somewhat different from our earlier studies for HPPH-mediated PDT (Zhu et al 2019) where a larger variation of b was found (6.5 ± 1.5 mW cm−2) for a larger patient population.
Values of Rd/(1−Rd) were calculated for all six cases using equation (4) and equation (5) and are summarized in table 4. In general, the values of Rd/(1−Rd) calculated using equation (4), which reflected the mean effect of light scattering throughout the entire pleural cavity, fall within the range of those calculated using the tissue optical properties (equation (5)). The variation of Rd/(1−Rd) values per patient using equation (5) is caused by the variation of tissue optical properties within the patient measured at the eight detector locations. Case No. 012, 016, and 017 have variations in equation (5) calculated Rd/(1−Rd) where the measured optical properties resulted in a range that does not include the equation (4) calculated value. This could be due to larger variation in measured optical properties compared to true optical properties. The optical properties were measured using a contact probe on the surface of the pleural cavity (Ong and Zhu 2016) and may be contaminated with higher concentrations of blood or Intralipid from one section of the pleural cavity to another.
For most cases, larger deviations were seen in the diaphragm, posterior/anterior sulcus, or the apex locations detectors. This may be improved with greater data acquisition at those locations. Due to the cavity geometry and the IR camera location, certain extreme angles or far locations from the center may have less efficient data collection rates. Furthermore, any blockage of the optical path from the reflective spheres to the IR camera will result in loss of position data, which will affect the calculations as well.
The uniformity of the treatment delivery was evaluated for all patients (see figure 9). The 3D pleural cavity geometry was unwrapped along the x- and y-axes so that the apex detector location was located at the top of the 2D representation (figure 8). Figure 8 shows the fluence distribution at the end of treatment for case 020 along with labeled detector locations. The profile of light dose along the z-axis for each horizontal angle is plotted in figures 9 (a)–(f) for all patients. The mean is shown as a black solid line, the standard deviation is indicated by the grey shaded area, and the dashed line represents the prescribed light dose of 60 J cm−2. Uniformity is quantified and summarized in table 5. This calculation excluded the region best guessed to be the surgical opening, as delineated by two vertical dotted black lines in the plots of figures 9. Most of the cavity, excluding the extremities, reached the prescribed dose. Large peaks are seen for certain horizontal angles. This is due to the surgical opening and position data that is obtained for movement in and out of the surgical cavity. The uniformity excluding the surgical opening is quantified as standard deviation from the mean in table 5 for each case. The standard deviation was calculated as the standard deviation of the mean profile (black line) from the prescribed light dose (horizontal dashed line, 60 J cm−2). The variation of standard deviation is the standard deviation of the grey region. Across all patients, the uniformity was on average 10% with a variation of the standard deviation 18%. This result (10%) is substantially better than what was achieved (18%) (Zhu et al 2019) using a navigation system in a HPPH-mediated PDT clinical trial and is probably caused by an improvement in laser source positioning determination in the current clinical trial.
Figure 9.
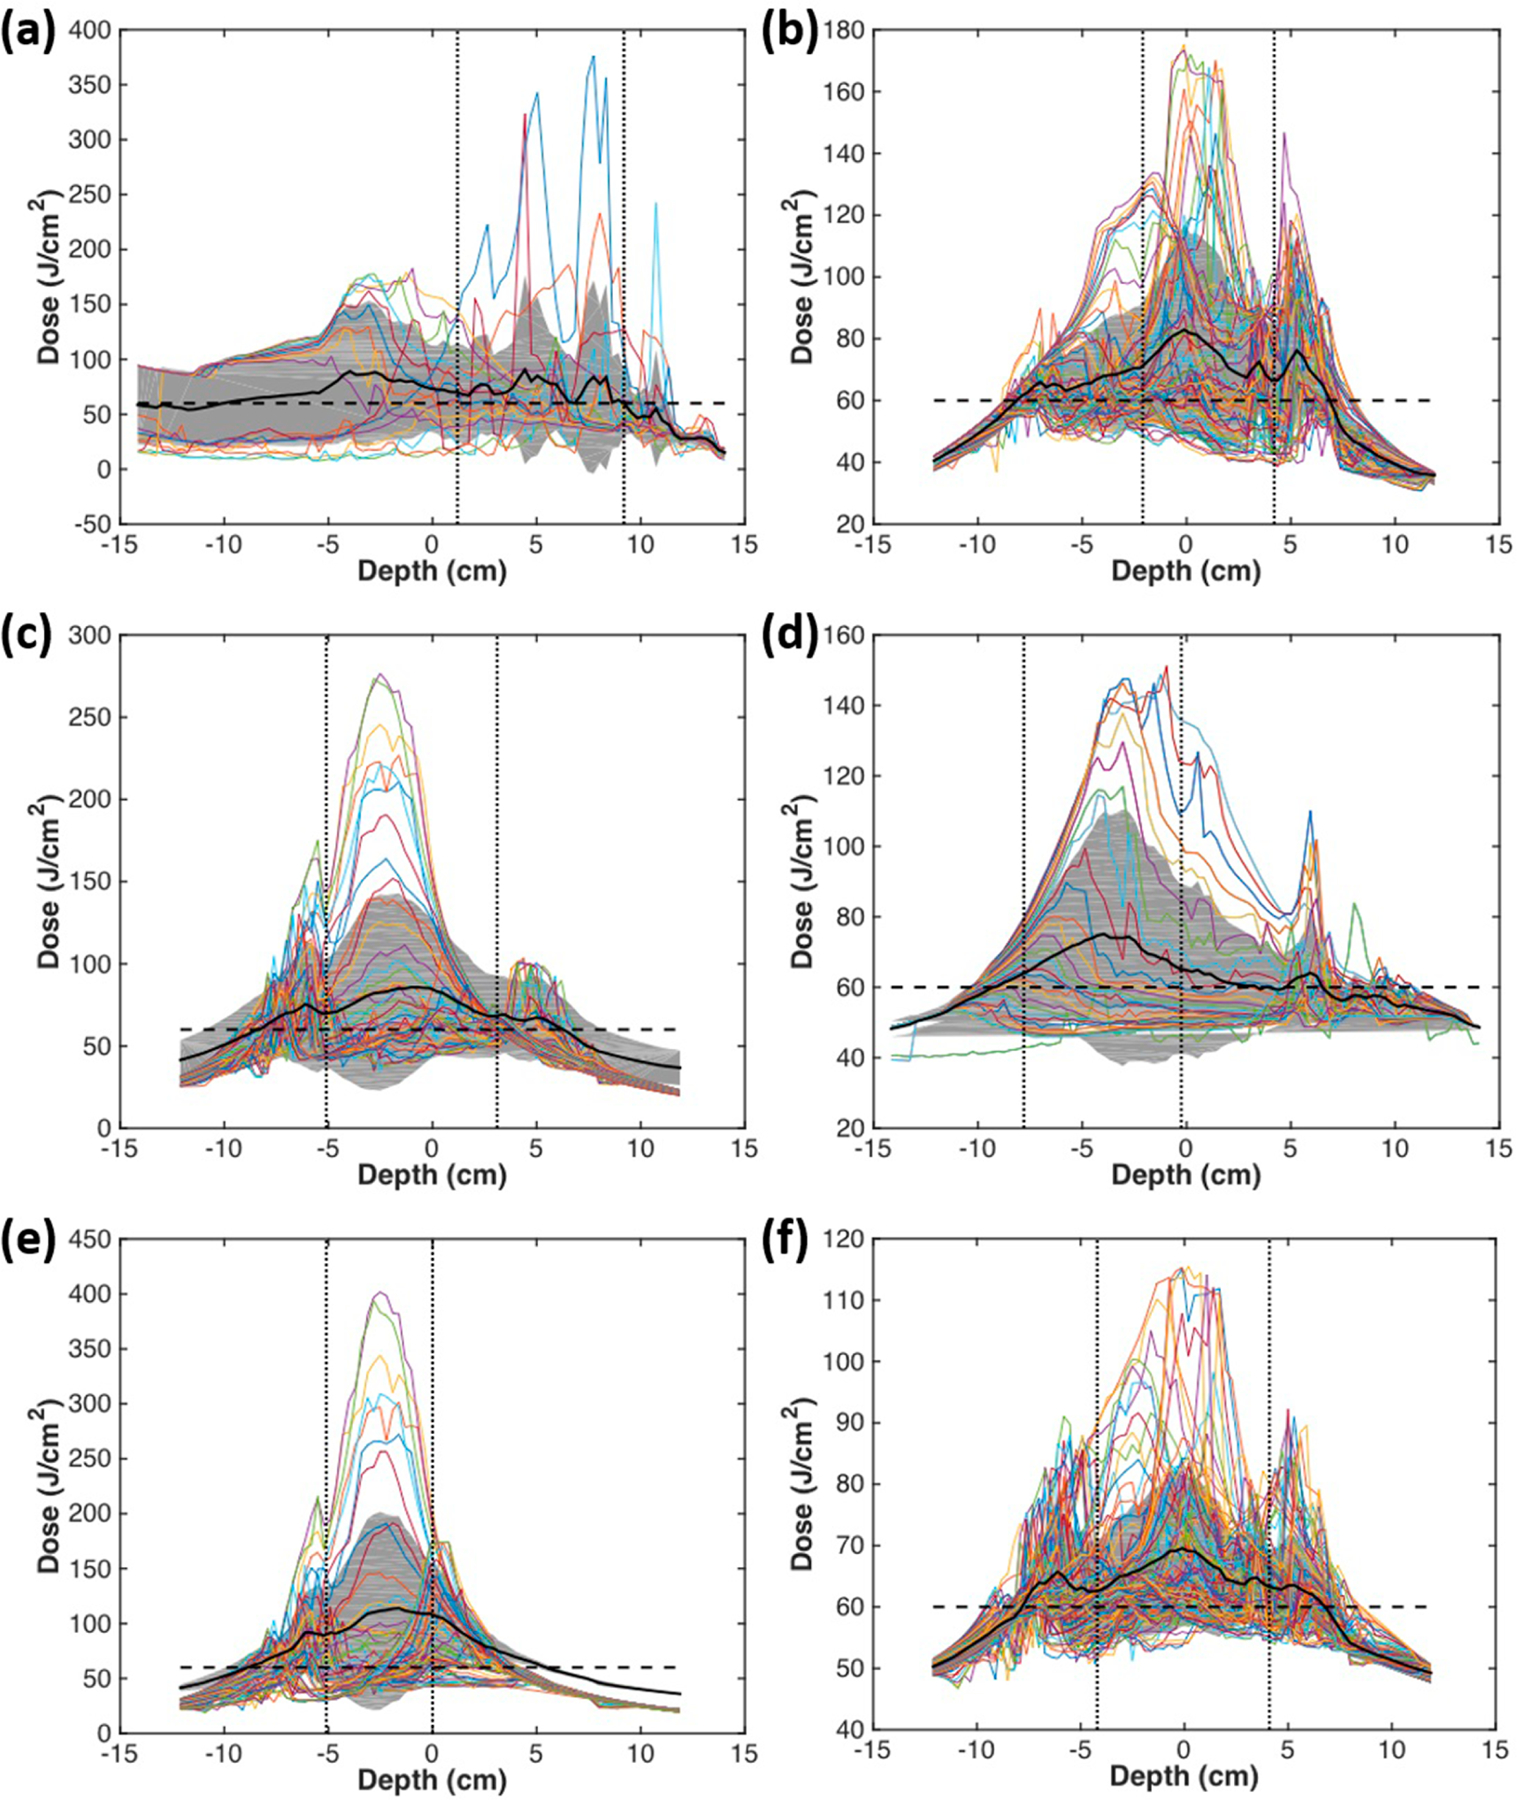
Fluence distribution along the z-axis (depth) for each angular location. The mean is shown in a solid black line, and the grey area indicates the standard deviation. The horizontal dashed line indicates the prescription light dose of 60 J cm−2. Uniformity is calculated as percent variation and summarized for each patient in table 5, excluding the region corresponding to the surgical opening, outlined by the vertical dotted lines. (a)–(f) indicate cases numbers 012, 014, 016, 017, 018, 020, respectively.
Figure 8.
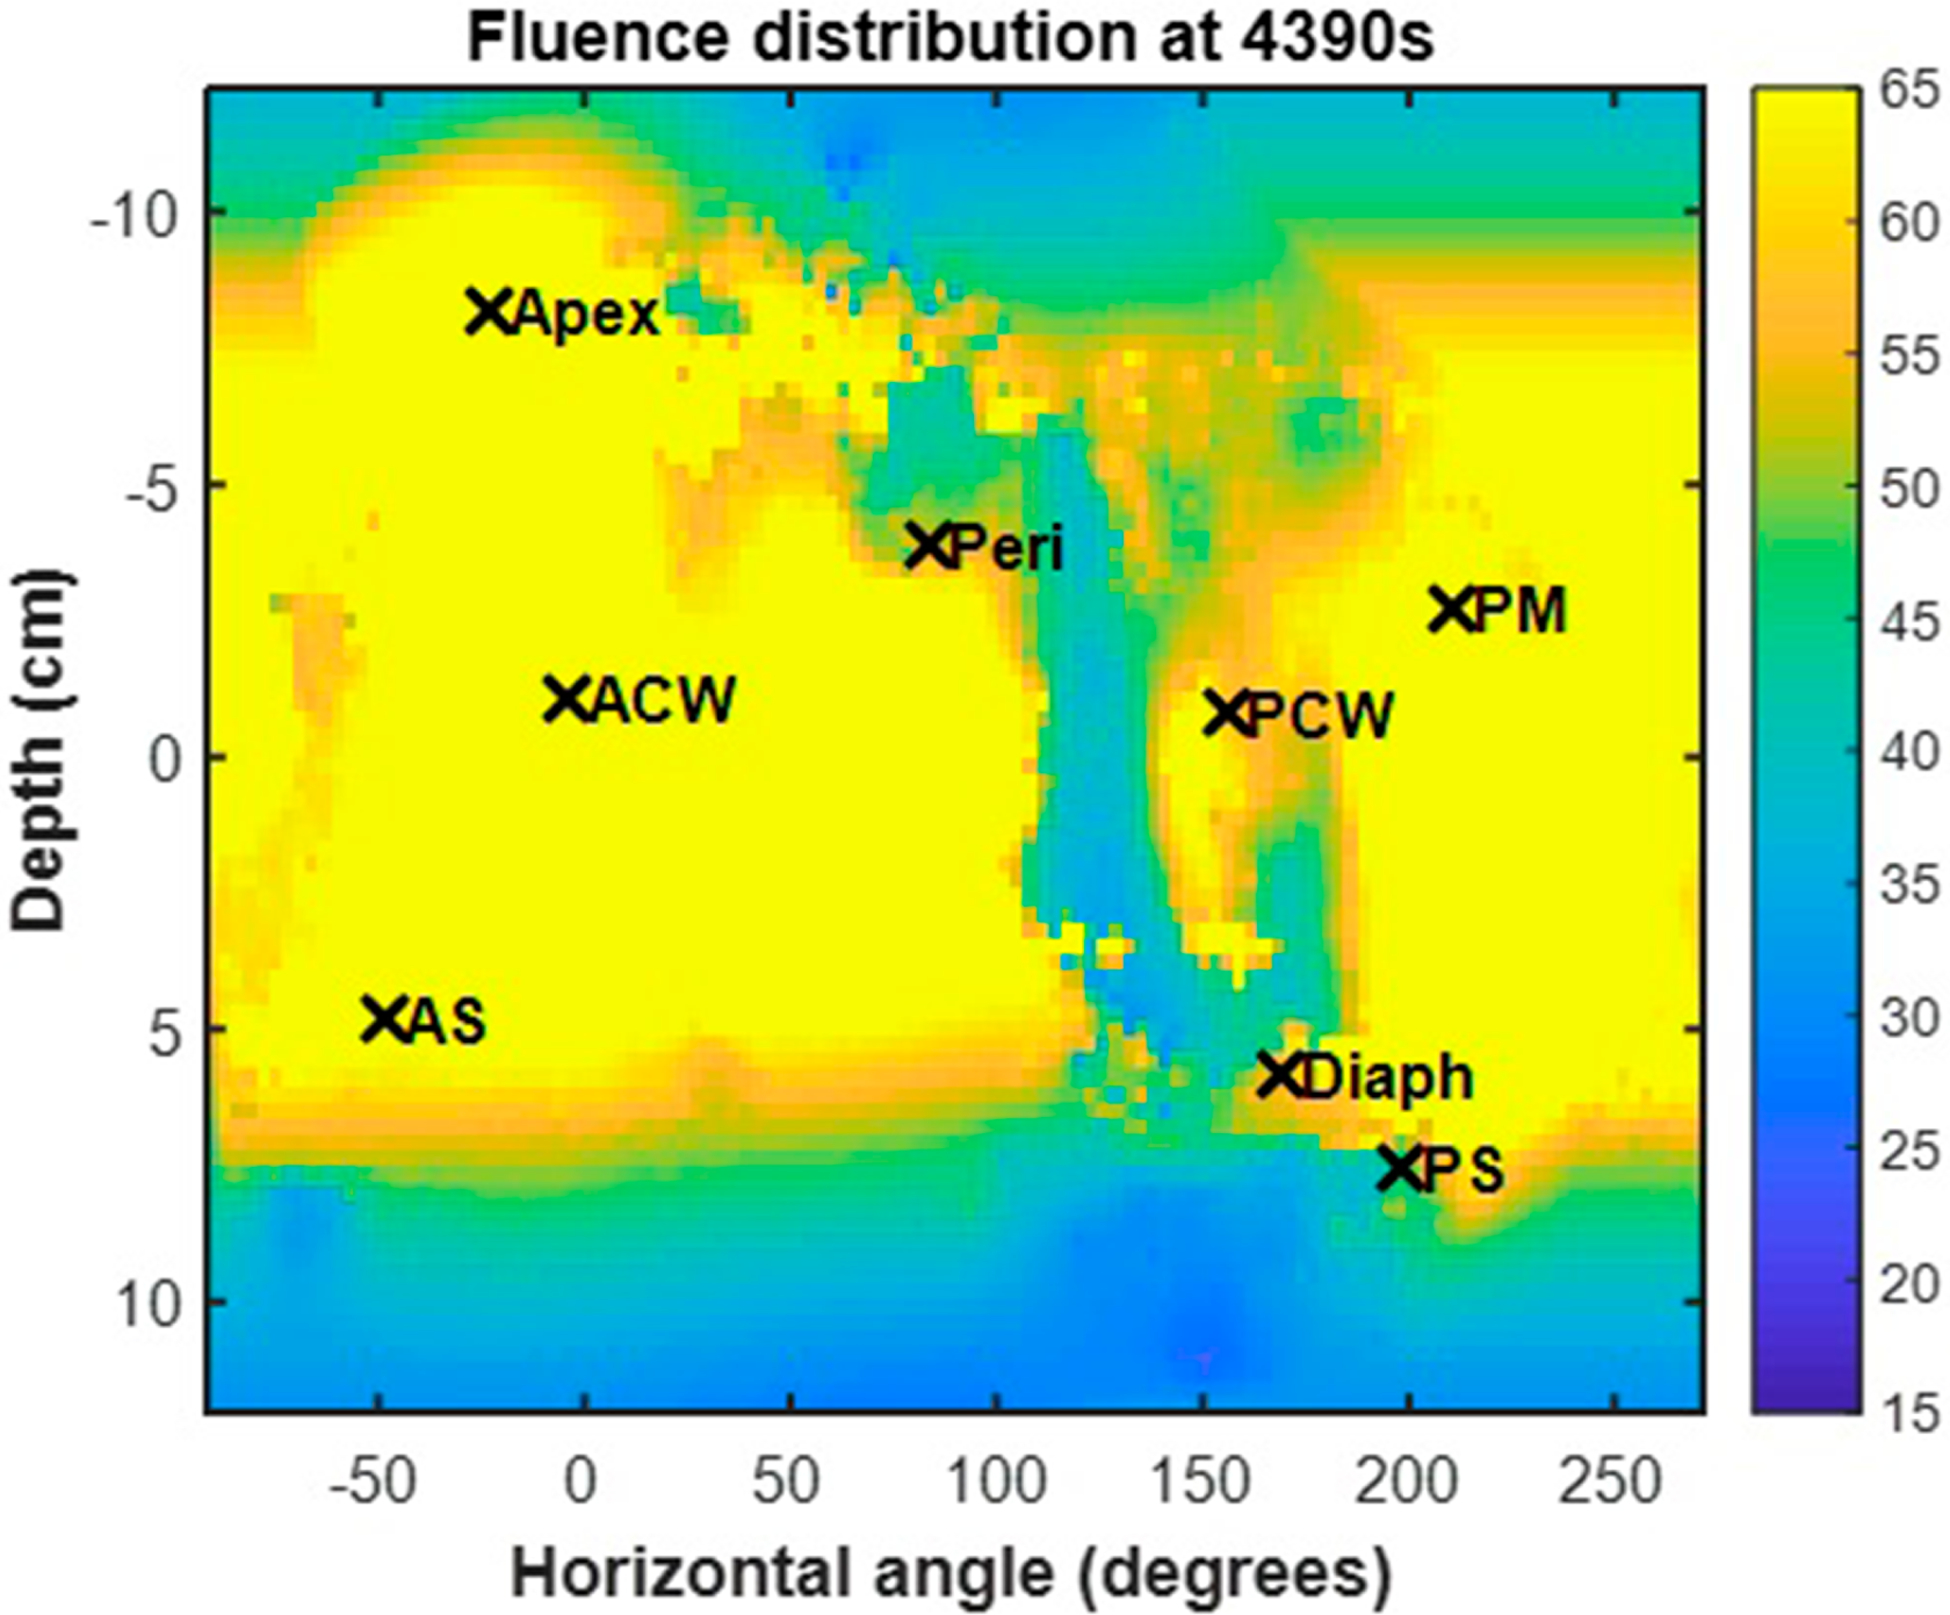
Fluence distribution map for a representative patient (Case No. 020). The 3D geometry is unwrapped and displayed on a 2D surface plot with the locations of the isotropic detector locations indicated by ‘x’ symbols.
Table 5.
Summary of uniformity across all horizontal angles for profiles in figure 6.
| Case no. | Standard deviation (% difference) | Variation of std. deviation (% difference) |
|---|---|---|
| 008 | 10.6 | 19.7 |
| 012 | 3.6 | 10.5 |
| 014 | 6.3 | 9.7 |
| 016 | 14.3 | 29.1 |
| 017 | 9.2 | 20.6 |
| 018 | 13.5 | 22.9 |
| 020 | 9.8 | 13.3 |
| Average | 10% ± 4% | 18% ± 7% |
4. Conclusion
As a standard of care for pleural PDT at the University of Pennsylvania, the light dose is monitored using eight isotropic detectors at pre-determined discrete locations. This method does not account for light dose delivered at locations between the detectors and can result in ‘hot spots’ of light dose when treatment is delivered to the detectors, rather than the entire cavity and ‘cold spots’ between detector locations. An optical IR navigation system to monitor the light source position during the treatment, which is improved in this study by eliminating uncertainties in source positioning, can provide 2D distribution of light fluence rate on the entire pleural surface (the treatment target area). This method is most accurate with a good tracking system that is obtaining treatment position location at all times throughout the light delivery to avoid calculating cold spots of dose on the pleural surface. Light dose calculated with both the primary and scattered components agrees to within 15% of the measured values for each detector for seven patient cases. The uniformity of the treatment delivered is also quantified. Using this technology and calculation method, uniform light dose delivery can be aided visually with the fluence distribution map to avoid under-treatment of areas between isotropic detectors.
Acknowledgments
The authors would like to thank everyone involved in the PDT team at the University of Pennsylvania, including Charles B. Simone, Carmen Rodriguez, Rozhin Penjweini, Arjun G. Yodh, Arash Darafsheh, Theresa M. Busch, Jess Appleton, Sally McNulty, Joann Miller, and Min Yuan for their contributions to the pleural PDT procedure. This work is supported by NIH Grant Nos. R01 CA154562 and P01 CA87971. The authors have confirmed that any identifiable participants in this study have given their consent for publication.
Footnotes
Ethical statement
All investigations involving humans are conducted in accordance with the principles embodied in the Declaration of Helsinki and in accordance with local statutory requirements.
References
- Allison RR and Moghissi K 2013. Photodynamic therapy (PDT): PDT mechanisms Clin. Endosc 46 24–29 [DOI] [PMC free article] [PubMed] [Google Scholar]
- Dimofte A, Zhu TC, Finlay JC, Cullighan M, Edmonds CE, Friedberg JS, Cengel KA and Hahn SM 2009. In-vivo light dosimetry for pleural PDT Proc. SPIE 7164 71640A. [DOI] [PMC free article] [PubMed] [Google Scholar]
- Dougherty TJ, Gomer CJ, Henderson BW, Jori G, Kessel D, Korbelik M, Moan J and Peng Q 1998. Photodynamic therapy J. Natl. Cancer Inst 90 889–905 [DOI] [PMC free article] [PubMed] [Google Scholar]
- Friedberg JS and Cengel KA 2010. Pleural malignancies Semin. Radiat. Oncol 20 208–14 [DOI] [PubMed] [Google Scholar]
- Friedberg JS, Culligan MJ, Mick R, Stevenson J, Hahn SM, Sterman D, Punekar S, Glatstein E and Cengel K 2012. Radical pleurectomy and intraoperative photodynamic therapy for malignant pleural mesothelioma Ann. Thoracic Surg 93 1658–67 [DOI] [PMC free article] [PubMed] [Google Scholar]
- Hahn SM, Smith RP and Friedberg JS 2001. Photodynamic therapy for mesothelioma Curr. Treat. Options Oncol 2 375–83 [DOI] [PubMed] [Google Scholar]
- Kessel D and Oleinick N 2018. Cell death pathways associated with photodynamic therapy: an update Photochem. Photobiol 94 213–18 [DOI] [PubMed] [Google Scholar]
- Ong YH and Zhu TC 2016. An analytic function for predicting light fluence rate of circular fields on a semi-infinite turbid medium Opt. Express 24 26261–81 [DOI] [PMC free article] [PubMed] [Google Scholar]
- Pass HI et al. 1994. Intrapleural photodynamic therapy: results of a phase i trial Ann. Surg. Oncol 1 28–37 [DOI] [PubMed] [Google Scholar]
- Pass HI, Tochner Z, DeLaney T, Smith P, Friauf W, Glatstein E and Travis W 1990. Intraoperative photodynamic therapy for malignant mesothelioma Ann. Thoracic Surg 50 687–8 [DOI] [PubMed] [Google Scholar]
- Penjweini R, Kim MM and Zhu TC 2017. Three-dimensional finite-element based deformable image registration for evaluation of pleural cavity irradiation during photodynamic therapy Med. Phys 44 3767–75 [DOI] [PMC free article] [PubMed] [Google Scholar]
- Simone CB 2nd and Cengel KA 2014. Photodynamic therapy for lung cancer and malignant pleural mesothelioma Semin. Oncol. 41 820–30 [DOI] [PMC free article] [PubMed] [Google Scholar]
- Triesscheijn M, Baas P, Schellens JHM and Stewart FA 2006. Photodynamic therapy in oncology Oncologist 11 1034–44 [DOI] [PubMed] [Google Scholar]
- Zhu TC, Kim MM, Jacques SL, Penjweini R, Dimofte A, Finlay JC, Simone CB 2nd, Cengel KA and Friedberg JS 2015a. Real-time treatment light dose guidance of pleural PDT: an update Proc. SPIE 9308 930809. [DOI] [PMC free article] [PubMed] [Google Scholar]
- Zhu TC, Kim MM, Ong YH, Penjweini R, Dimofte A, Finlay JC, Rodriguez C and Cengel KA 2017. A summary of light dose distribution using and IR navigation system for photofrin-mediated pleural PDT Proc. SPIE 10047 1004709-1-7 [DOI] [PMC free article] [PubMed] [Google Scholar]
- Zhu TC, Liang X, Kim MM, Finlay JC, Dimofte A, Rodriguez C, Simone CB 2nd, Friedberg JS and Cengel KA 2015b. An IR navigation system for pleural PDT Front. Phys 3 1–12 [DOI] [PMC free article] [PubMed] [Google Scholar]
- Zhu TC, Liang X, Sandell J, Finlay JC, Dimofte A, Rodriguez C, Cengel v A, Friedberg JS, Hahn SM and Glatstein E 2012. A real-time treatment guidance system for pleural PDT Proc. SPIE 8210 82199A. [DOI] [PMC free article] [PubMed] [Google Scholar]
- Zhu TC et al. 2020. Evaluation of light fluence distribution using an IR navigation system for HPPH-mediated pleural photodynamic therapy (pPDT) Photochem. Photobiol 96 310–9 [DOI] [PMC free article] [PubMed] [Google Scholar]


