

Abstract
Our proof-of-concept study develops a suspect screening workflow to identify and prioritize potentially ubiquitous chemical exposures in matched maternal/cord blood samples, a critical period of development for future health risks. We applied liquid chromatography–quadrupole time-of-flight tandem mass spectrometry (LC-QTOF/MS) to perform suspect screening for ~3,500 industrial chemicals on pilot data from 30 paired maternal and cord serum samples (n=60). We matched 662 suspects in positive ionization mode and 788 in negative ionization mode (557 unique formulas overall), and selected 208 of these for fragmentation analysis based on detection frequency, correlation in feature intensity between maternal and cord samples, and peak area differences by demographic characteristics. We tentatively identified 73 suspects through fragmentation spectra matching and confirmed 17 chemical features (15 unique compounds) using reference standards. We tentatively identified 55 compounds not previously reported in the literature, the majority which have limited to no information about their sources or uses. Examples include (i) 1-(1-Acetyl-2,2,6,6-tetramethylpiperidin-4-yl)-3-dodecylpyrrolidine-2,5-dione (known high production volume chemical) (ii) methyl perfluoroundecanoate and 2-perfluorooctyl ethanoic acid (two PFAS compounds); and (iii) Sumilizer GA 80 (plasticizer). Thus, our workflow demonstrates an approach to evaluating the chemical exposome to identify and prioritize chemical exposures during a critical period of development.
Keywords: Suspect screening, exposome, high-throughput, maternal blood, cord blood, pregnancy, biomonitoring
INTRODUCTION
Prenatal exposure to environmental chemicals can lead to myriad health consequences throughout the life course.1–4 Prior research using National Health and Nutrition Examination Survey (NHANES) data found that pregnant women in the U.S. are exposed to multiple different chemicals.5,6 Most of these chemicals can cross the placenta into the fetal environment,7,8 with sometimes higher exposure to the fetus compared to maternal blood measurements, such as mercury and polychlorinated biphenyls.4 In a study of 65 pregnant women in San Francisco, we detected a median of ~25 chemicals in maternal serum (out of 59 compounds tested), of which ~80% were also detected in matched umbilical cord serum samples, with some compounds having higher concentrations than maternal levels. 9 Existing biomonitoring research mainly relies on targeted analytical methods that cover only a few hundred chemicals.6 This is likely a small fraction of all the potential chemicals that humans are exposed to, as ~8,000 chemicals are manufactured or imported in large volume (> 25,000 lbs/year) in the U.S.,10 and chemical production totals at least 9.5 trillion pounds,10,11 let alone the approximately 40,000 chemicals currently in commerce in the U.S.12 A recent study reviewed over 700 chemicals from multiple chemical classes that have a high likelihood of exposure among mothers and children, have a potentially toxic structural moiety, but are not currently measured via biomonitoring or health effects in National Institutes of Health (NIH)’s Environmental influences on Child Health Outcomes (ECHO) initiative or NHANES.13 The authors recommended 155 chemicals of high priority for future biomonitoring, suggesting an unmet need for characterizing exposures to these “known unknown” chemicals.
Recent advancements in high-resolution mass spectrometry (HRMS) paired with novel computational and statistical approaches provide an opportunity for large-scale screening of chemicals from biological and environmental samples.14–17 By leveraging the non-targeted chemical feature acquisition, suspect screening can efficiently identify chemicals of interest using HRMS and software-matching algorithms that map these features against user-defined chemical databases or existing chemical inventories.18 This technology has gained increasing popularity in recent years as a new tool for environmental monitoring19–22, metabolite discovery23,24 and biomonitoring of industrial chemicals25,26 to better characterize the chemisome27 — the industrial chemical components of the human exposome.28
While there are numerous publications on HRMS in environmental monitoring and metabolite discovery, the application of this technique to biomonitoring of industrial chemicals remains limited. In a previous study, we leveraged this technology to identify novel chemicals never measured before in the blood of pregnant women, 26 and found that they are exposed to more chemicals than previously documented. As the first proof-of-concept study in applying suspect screening to detect chemicals in pregnant women’s serum, we limited our search to a subset of environmental chemicals called environmental organic acids (EOAs) —compounds with at least one ionizable proton, by using the negative ionization mode to optimize their detection.26
This paper builds upon our previous work26 to demonstrate the application of a suspect screening method for characterizing exposure to a broader array of industrial chemicals in matched maternal and cord serum samples, a critical developmental period of health risk. We have developed and tested an analytical approach that uses HRMS to screen for multiple chemicals and a workflow to prioritize and identify ubiquitous endogenous chemicals that are differentially enriched in maternal/cord samples and/or across various demographic groups. Applying our approach to data from 30 paired maternal and cord serum samples (N=60 total samples), we expand work in the field of suspect screening and non-targeted analysis of human blood samples in four ways: 1) using a chemical database of approximately 3,500 high-production volume chemicals as well as chemicals of emerging concern including an expanded list of short-chain per- and polyfluoroalkyl substances;29 2) using both positive and negative ionization modes to facilitate detection of more chemical features; 3) evaluating cord serum matched to maternal serum allowing evaluation of differential enrichment of chemicals between the two; and 4) confirming chemical structures via matching of experimental MS/MS spectra against MS/MS spectra from existing reference libraries and analytical standards. Furthermore, to the best of our knowledge, this is the first study to characterize the chemical exposome to industrial chemicals in matched maternal and cord blood sample pairs using a suspect screening or a non-targeted analysis approach.
MATERIALS AND METHODS
Study Population and Sample Collection
The study population is part of the Chemicals in Our Bodies 2 Study (CiOB2), which consists of women seeking prenatal and delivery care at the Zuckerberg San Francisco General Hospital and UCSF Mission Bay Medical Center.26 From April 2, 2014, we enrolled women from an economically and ethnically diverse population (47% Latina, 37% non-Hispanic Whites, and 17% non-Hispanic Asians, Pacific Islanders, African Americans) who were English or Spanish-speaking, aged 18 through 40 years old, and had singleton pregnancies between 13 to 27 weeks gestation (2nd trimester) at the time of recruitment. Paired maternal and cord blood samples were collected at delivery for chemical analysis from participants who agreed to have their samples banked and included in supplemental studies. Maternal blood was collected during labor and delivery and umbilical cord blood after delivery and prior to umbilical cord clamping whenever possible. Blood was collected in BD Vacutainer® Plus Serum Tubes and stored at −80°C until analysis. We collected demographic information via interviewer-administered questionnaire and obtained information from maternal and infant medical with permission from participants. In this proof of concept study, we analyzed paired maternal-cord serum samples from 30 women. CiOB2 study protocols were approved by the Institutional Review Boards of the University of California, San Francisco (13-12160).
Chemical Analysis: Suspect Screening
Chemical Suspect Database
For our maternal/cord paired serum suspect screening study, we developed a ~3,500 chemical suspect database that combined data from an in-house Environmental Organic Acid (EOA) database we used in our earlier study26 with additional high-production chemicals in the U.S. as described below (Fig. S1).
1. In-house industrial chemical database
Our in-house chemical database (Fig. S1) consists of 714 chemical entries, including 369 chemicals from our previous published Environmental Organic Acid (EOA) database,26 207 less-studied per and polyfluoroalkyl substances (PFAS), 44 flame retardants (FR) including organophosphate flame retardants (OPFR), 30 quaternary ammonium compounds (QACs), and 64 other industrial chemicals widely used in everyday life (e.g., plasticizers and over-the-counter medications).
2. High-production chemicals obtained from EPA’s Chemical Data Reporting 2016
We obtained a list of 8,707 high-production (average national production volume over 25,000 lbs) chemicals from the USEPA Chemical Data Reporting (CDR) 2016 database.12 We queried their CASRN against the USEPA CompTox Chemicals Dashboard30 and kept 4,963 chemicals that had molecular formulas. There were 3,744 chemicals that were excluded because of unsuccessful matching of CASRN (n=1,370) and no matched molecular formula (potential mixtures, n=2,374). We further restricted the Chemical Data Reporting list to include chemicals with formulas that were also included in the USEPA suspect screening DSSTox desalted formula list to remove entries that were not LC amenable (e.g., metals). There were 3,380 Chemical Data Reporting chemicals remaining that corresponded to 2,421 unique chemical formulas.
The final suspect database included 2,421 unique chemical formulas and 3,535 chemical entries after merging the in-house EOA database and Chemical Data Reporting lists and removing duplicated entries, chemicals with fewer than 100 units in mass or without formulas (e.g., chemical mixtures), and chemicals that are only gas-chromatography amenable. Gas-chromatography amenability was determined by examining the polarity of the chemicals. If a chemical did not have any polar groups, such as ROH or ROR, it was removed because it would not likely ionize in electrospray ionization. Structure information (SMILES and InChI keys) were obtained from PubChem search. This database was imported into the Agilent Mass Hunter Personal Compound Database and Library software (PCDL) for downstream suspect screening analysis. The suspect feature matching was done at the formula level, by matching an observed MS1 spectrum to theoretical spectra for MS-Ready formulas in PCDL. It is important to note that PCDL does not have retention times or reference MS1 or MS2 spectra.
LC-QTOF/MS Analysis
After compiling the final chemical suspect database, we performed HPLC/HRMS analysis using Agilent 1290 UPLC interfaced with Agilent 6550 QTOF/MS with electrospray ionization (ESI) in positive and negative mode (Agilent Technologies, Santa Clara, CA), data processing, data analysis, and compound confirmation with detailed steps listed below (Fig. 1).
Figure 1.
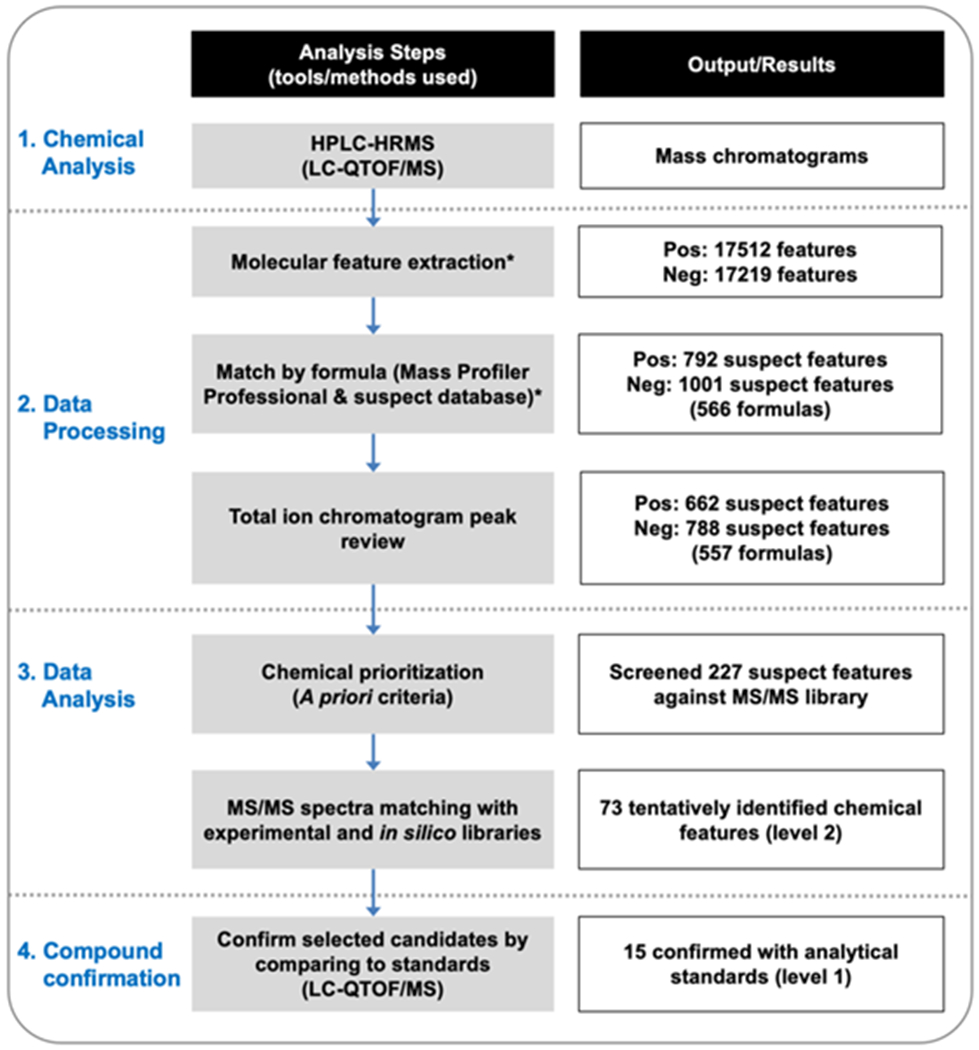
Suspect screen analysis workflow. *For detailed steps regarding feature extraction and formula matching, please refer to supplementary file (Fig. S2 and S3). The annotation levels refer to the annotation scheme proposed by Schymanski et al.31 for communicating confidence.
1. Chemical analysis
Serum samples (250 µL) were extracted by protein precipitation with methanol. 10 µL of the serum extracts were then injected into the UPLC-QTOF/MS system. Both negative and positive ionization mode were studied. Agilent Eclipse Plus C18 (2.1×100mm, 1.8 µm) column was used. Gradient A was made as 5 mM Ammonium Acetate in water (0.1% methanol). Gradient B was made as 5 mM Ammonium Acetate in methanol with 10% water. The gradient flow was set as 0.3 mL/min. The total ion chromatography (TIC) scan mass range was 100-1000 m/z. Quality control samples including blanks (LCMS grade water: Water, Burdick & Jackson™ for LC-MS, for HPLC, Burdick & Jackson™, LC365-1; serum blank) and in-house laboratory control samples (matrix spike or LCS) were also analyzed together within one batch. Two technical replicates were analyzed for each sample.32,33 The instrumental parameters are presented in the Supplementary Spreadsheet.
2. Quality assurance/Quality control
QA/QC samples were used to monitor the general performance of the injections, including retention time shifts, mass accuracy and peak intensity decay. Perfluoro-n-[1,2-13C2] octanoic acid (M2PFOA) was used as internal standard in negative ionization mode; triphenyl phosphate D15 and DL-cotinine (methyl D3) was used in the positive ionization mode. Blank samples were used to correct artificial features that might be introduced during sample preparation by removing features for which, abundances were no more than two times higher in the blanks compared to the samples. The blanks were made using ultraclean water (LCMS grade water: Water, Burdick & Jackson™ for HPLC, LC365-1) and the QCs were made using commercially available human AB serum (Corning™ Human AB Serum, 35060CI). QC serum is prepared using human AB serum spiked with 7 PFAS compounds and 6 OPFR compounds (Tables S2 and S3) (final concentration = 10 ng/ml in QC serum). The blank samples and the QC samples were treated the same way as the maternal and cord serum samples (Fig. S2) following all the steps of the sample treatment and analysis.
For each batch, 10 pairs of maternal and cord matched serum samples, together with 2 water blanks, 2 blank serum samples and 2 QC serum samples were extracted together and injected together in one batch. The samples were randomized, but each maternal and cord pair were run in the same batch to minimize any batch effect between maternal and cord samples since we are interested in differences in peak areas between maternal and cord samples. Every sample was injected twice (instrumental replicate) to account for variability in peak areas originating from the instrument.
3. LC-QTOF/MS data processing
The obtained raw data files were processed following an optimized workflow described in detail elsewhere.32,33 The workflow includes molecular feature extraction (MFE) to extract compound features across the batch data files and feature alignment using Agilent Masshunter Profinder software (version B.10.0) to align all features (identify and combine the same features by comparing their retention times and spectra) in each batch. For feature alignment across batches and formula matching we used Mass Profile Professional software (MPP version 12.06.01). The steps regarding feature extraction and formula matching is sketched in Figure S3. Each batch was composed of 10 pairs (N=20 total) plus QC and blank samples for a total of 3 batches. After feature alignment, we kept only feature peaks with intensities at least two times higher than those in the water blank samples.
The chromatogram peak area, as integrated by the Agilent MassHunter Profinder software, is used a surrogate for chemical concentration allowing for comparisons of same chemical across samples and batches. This approach can only be used when studying the same chemical across samples and not when comparing two different chemicals due to potentially important differences in ionization efficiency. We used R (version 3.5.1) and Python (version 3.9.2) for our data processing and data analysis. The processing and analytical steps were: 1) combining features obtained from all three batches, 2) averaging the peak area of the two technical replicates, 3) imputing values below the limit of detection, 4) performing batch correction, and 5) performing downstream analysis using batch-corrected peak areas.
Imputation of values below the limit of detection was conducted using a computational approach which assigned missing values based on the distribution of the datapoints. The measured abundances were log transformed and for each chemical across samples we calculated the median, the minimum and the standard deviation of the distribution. After fitting a normal distribution to the datapoints, the algorithm then generated random values between the measured minimum abundance (~5,000) and the theoretical minimum (0) following the shape of the distribution. The algorithm is available on Github (https://github.com/dimitriabrahamsson/wangetal_maternal_cord.git).
Batch correction was conducted using a software package called ComBat34, which is commonly used in batch effect corrections in bioinformatics. One advantage of the ComBat package is that it can be used to correct for batch effect while preserving other differences across samples and that way avoiding overcorrection.
In addition to MassHunter Profinder, we expanded our MS/MS searching by employing MS-Dial35, which is an open source software package for analyzing non-targeted analysis data and has been developed by researchers at University of California, Davis and the RIKEN Center for Sustainable Resource Science (Japan).35 Using the same parameters as for MassHunter (Supplementary Spreadsheet), we searched the “All public MS/MS” databases for positive MS/MS (13,303 unique compounds) and for negative MS/MS (12,879 unique compounds).
Descriptive and Statistical Analysis
We developed a workflow which uses descriptive and statistical analysis methods to prioritize chemical suspects in the large universe of chemical features that are detected with HRMS for further analysis. For our prioritization, chemicals of interest were those with: 1) a high detection frequency (suggesting ubiquitous exposure); 2) disproportionate distribution of peak area (relative concentrations) in fetal versus maternal serum (suggesting potentially different exposure concentration); 3) high correlation in peak area between fetal and maternal serum (suggesting that maternal concentration could be a proxy for fetal exposure); and/or 4) disproportionate distribution of peak area relative concentrations across maternal race/ethnicity or socioeconomic status (suggesting higher exposure to different demographic groups). Accordingly, we derived different measures to evaluate these criteria of interest as described below.
First, we obtained the detection frequencies for the paired maternal and cord samples (DFpaired) as an indicator of how widespread chemical features may be among pregnant women and their newborns, ranging from zero to thirty. DFpaired of one means that the feature was detected in both the maternal and cord samples obtained from the same participant. We also ranked the features according to their median peak area across both maternal and cord samples from largest to smallest peak area (RankPA, smaller ranks corresponds to larger peak areas) as a proxy to identify features that may be of higher abundance.20
Second, we conducted two assessments of the relationship between maternal and cord peak areas: 1) the ratios of cord vs. maternal peak areas (PARC vs. M), and 2) the Spearman correlation between cord and maternal peak areas (CorrC-M). A PARC vs. M greater than 1 indicated that the peak area of this feature was higher in cord serum than in maternal serum, while a value less than 1 means the peak area was higher in maternal than in cord serum. Features with an absolute CorrC-M value of at least 0.5 and a p-value of less than 0.05 were considered to have a statistically significant correlation between cord and maternal peak area.
Third, among those chemical features with detection frequencies of at least 80% in maternal or cord serum samples, we assessed separately whether the peak areas in cord or maternal serum samples differed by race/ethnicity, education, household income, and nativity (U.S.-born status). Linear regression with batch adjustment was used if the log-transformed peak area passed the Shapiro normality test (p-value being at least 0.05). Otherwise, logistic regression of the highest tertile of the peak area was used, adjusting for batch. When there is zero cell for the tabulation of peak area (highest tertile vs. other) and the demographic variable, non-parametric Kruskal-Wallis test was used. A p-value less than 0.05 was considered statistically significant. The statistical analyses on the relationship between chemical features and demographic variables were not adjusted for multiple comparisons, as the main goal was to inform the prioritization of potential suspect chemicals.
Chemical Prioritization Criteria and Steps
Based on the criteria of interest and their corresponding measures, we used an iterative four-step approach to prioritize and select chemicals for confirmation using reference standards (Fig. 2). We assigned confidence levels to features based on the scale developed by Schymanski et al.31 All features extracted by MassHunter Profinder and/or with MS-Dial were at first considered level-5 annotations. The features that were assigned chemical formulas based on accurate mass, isotope patterns and abundance were assigned level-4 identification confidence. The ESI adducts that were used for matching formulas were: H+, Na+ and NH4+ in positive mode and CH3COO-in negative mode.
Figure 2.
Steps for prioritizing chemicals of interest based on: 1) a high detection frequency (suggesting ubiquitous exposure); 2) disproportionate distribution of peak area (relative concentrations) in fetal versus maternal serum (suggesting potentially different exposure concentration); 3) high correlation in peak area between fetal and maternal serum (suggesting that maternal concentration could be a proxy for fetal exposure); and/or 4) disproportionate distribution of peak area relative concentrations across maternal race/ethnicity or socioeconomic status (suggesting higher exposure to different demographic groups). The prioritized chemical features are then used to match against MS/MS spectral libraries and for confirmation with analytic standards. Abbreviations: DF: detection frequency; C&M: cord and maternal; PA: peak area; CvsM: cord compared to maternal peak area; C-M: cord-maternal; PAR: peak area ratio; Corr: correlation; DEMO: demographic differences; NHANES: National Health and Nutrition Examination Survey.
The chemical candidates matched to suspect features by formula, and could be annotated with a tentative structure, were considered level-3 identification confidence. Due to the large variability and uncertainty in the level-3 annotations, we developed and applied a scoring algorithm for distinguishing between likely accurate and likely inaccurate level 3 annotations. As a first step, we collected all isomers for a given formula that could be found in EPA’s CompTox Chemicals Dashboard30. We then calculated the probability of blindly picking the right isomer (called “blind probability”) by dividing 1 by the number of available isomers. For example, if a formula had only 1 available isomer the probability of blindly picking the right isomer is 1, whereas if a formula had 100 available isomers the probability is 1/100 = 0.01. We then collected the number of Dashboard data sources, PubChem data sources, PubMed publications and CPDAT count for each isomer and normalized the data in each column (i.e., Dashboard data sources, PubChem data sources etc) from 0 to 1 for every group of isomers that corresponded to one formula. We then calculated the average source score (called “source score”) for every isomer by taking the average of Dashboard, PubChem, PubMed and CPDAT scores. Finally, we calculated the overall score by taking the average of the blind probability and the source score. We decided to calculate the final score this way instead of taking the average of all numbers in order to give more weight to blind probability instead of the source score. The algorithm is available on Github (https://github.com/dimitriabrahamsson/wangetal_maternal_cord.git).
The features, for which there was some evidence to propose an exact structure based on experimental MS/MS spectra, or in silico MS/MS spectra, were considered level-2 annotations. Otherwise, they remained as level-3 or level-4 annotations. For a select number of prioritized features, we collected targeted MS/MS fragmentation spectra in both positive and negative electrospray ionization modes with collision energies of 10 eV, 20 eV and 40 eV with a scan rate of 4 spectra/s and a retention time window of ±1 min. The spectra for all three collision energies were collected simultaneously. The spectra were collected following data dependent acquisition (DDA) and a targeted MS/MS method for the prioritized chemical features.
The acquired spectra were then used to search for potential matches (at least one fragment peak with mass error < 10 ppm) in available experimental MS/MS spectral libraries (MS-Dial databases35, MassBank of Europe and North America36, HMDB37 and mzCloud38), and in in silico spectral computational tools (CFM-ID39 and MetFrag40). For both the experimental databases and the in silico tools, we searched compounds for which we could observe a chromatographic peak for the molecular ion and for peaks which the isotopic pattern had a score of 70 out of 100 or higher. We then annotated the observed features with the top candidate ion suggested by the software’s algorithm.
Suspect features that were confirmed using a reference standard with MS, MS/MS and retention time matching were assigned level-1 confidence in identification.
Step 1: Based on results from descriptive and statistical analysis, we selected chemical features that meet the following criteria (Fig. 2):
DFpaired = 100%
RankPA among the top 50th percentile
Having maternal and cord peak area relationship of interest: median PARC vs. M ≥ 2 or median PARC vs. M ≤ 0.5; absolute CorrC-M ≥ 0.5 (p-value < 0.05). Median PARC vs. M ≥ 2 means that half of the cord samples had peak areas at least two times the median peak area among maternal samples, while median PARC vs. M ≤ 0.5 means that half of the maternal samples had peak area of at least two times of the median peak area among cord samples.
The peak area of cord or maternal samples were different across at least one demographic variable (race/ethnicity, education, household income, or nativity).
Step 2: For chemical features meeting the criteria in step 1, we merged back the candidate chemical names from our suspect chemical database based on formula, and then queried the US EPA’s CompTox Chemicals Dashboard30 by CASRN to obtain additional information on the candidate chemicals, including whether they: are biomonitored by NHANES, are present in various drug lists (e.g., the DrugBank database from the University of Alberta), have associated ToxCast assay information, and are on the high production volume list or the chemical and products database. For the purposes of this paper, which focuses on exogenous chemicals, we further prioritized chemicals that were not biomonitored by NHANES, not pharmaceutical drugs, and not likely to be endogenous fatty acids (based on chemical structure). However, there are certain endogenous compounds, such as cortisol and bile acids, that have shown some associations with preterm birth in previous studies and might be of interest for future investigation. For that reason, we included four endogenous compounds in the prioritized list for MS/MS spectra matching: cortisol, progesterone, deoxycholic acid and chenodeoxycholic acid (3 unique formulas; deoxycholic acid and chenodeoxycholic acid share the same formula).
Step 3: To increase the likelihood of confirmation with reference standards given the limited volume of serum samples, we performed fragmentation analysis by checking the fragmentation peaks against various sources, including online experimental databases, such as the MS-Dial databases35, MassBank36 and mzCloud,38 and spectral data generated by the online in silico fragmentation tools such as CFM-ID.39 Chemical features with at least one matched fragment peak were assigned a level-2 confidence in identification as probable structures. All the remaining features were assigned a level-4 confidence in identification.31
Step 4: We further conducted confirmation analysis for chemicals with reference standards that were commercially available.
Chemical Confirmation using reference standards
Among the level-2 identified chemical features with available reference standards, we confirmed the presence of chemical features by re-running the LC-QTOF/MS analysis with their corresponding reference standard. A suspect feature was considered confirmed (present in maternal or cord serum) with level-1 confidence in annotation31 if it had the same retention time (RT), accurate mass, and MS/MS spectral pattern as the LC-QTOF/MS results for the reference standard.
Database searching for previously reported structures and chemical uses
After collecting all the structural information on the detected features, we searched several databases to collect information on a chemical compound’s reported chemical use and its presence in previous exposure studies. For this search we used all the chemicals in the top 3 levels of annotation (1-3) as proposed by Schymanski et al.31 As a first step, we searched the Human Metabolome Database37 to find which compounds were known endogenous compounds. We then searched EPA’s CompTox Chemicals Dashboard30 to find which chemicals have known uses as pharmaceuticals, pesticides, flame retardants, poly/perfluorinated alkyl substances (PFAS), plasticizers, cosmetics, consumer products, and which chemicals are registered as high production volume chemicals. Finally, we searched the Blood Exposome database41,42 to find which chemicals had been previously reported in human blood samples in previous studies.
RESULTS
Participant Characteristics
The mean age of participants was 32 years (SD: 4.7, Table 1). Nearly half of the participants were Latinas, 37% were Non-Hispanic whites, and 17% were Non-Hispanic other race. Around one third of the pregnant women were of higher socioeconomic status, with 40% having some postgraduate education and 30% having an annual household income ≥ $125,000. Half of the study participants were born outside of the U.S., and, on average, had lived in the U.S. for 22 years.
Table 1.
Demographics of the current analytical sample (N=30 matched maternal/cord samples)
| Characteristics | Mean (SD) | N (%) |
|---|---|---|
| Age | 32.4 (4.7) | |
| Race/Ethnicity | ||
| Latinas | 14 (47) | |
| Non-Hispanic whites | 11 (37) | |
| Non-Hispanic Asians/Pacific Islanders/African Americans | 5 (17) | |
| Educational attainment | ||
| High school/GED or less | 11 (37) | |
| Some college/AA/College completed | 7 (23) | |
| Master’s or doctoral degree | 12 (40) | |
| Household income | ||
| < $40,000 | 12 (40) | |
| $40,000 – $124,999 | 9 (30) | |
| ≥ $125,000 | 9 (30) | |
| Nativity (Born in the U.S.) | ||
| Yes | 14 (47) | |
| No | 15 (50) | |
| DK/NA | 1 (3) | |
| Years lived in the U.S. | 22.0 (12.3) | |
| Infant sex | ||
| Male | 15 (50) | |
| Female | 15 (50) | |
Abbreviations: SD: standard deviation; GED: General Education Diploma; AA: Associate in Arts; DK: do not know; NA: not available
Suspects by ionization modes and across maternal vs. cord samples
After data processing, we detected in total 1,450 suspect features (herein referred to as “suspects”) that were matched to 557 unique chemical formulas. Of the 1,450 suspect features, we detected 662 suspects in the positive ion mode and 788 suspects in the negative ion mode, with 282 detected in both ion modes. We observed some limited batch effect related to how the samples were analyzed in the instrument (Fig. S5). Correcting for that effect with ComBat resulted in small changes in the abundances of the samples (Fig. S5). We also observed statistically significant differences in the abundance of some of the tracers across different batches (Fig. S6 and S7). Even though these differences are relatively small and only 3 tracers showed significant differences (Fig. S6 and S7), we chose to proceed with batch correction to remove any effect related to instrumental variability. This is particularly important for our statistical analyses since we use instrument abundances instead of concentrations, which would control for that effect. Median RT of all detected suspects was 8.9 minutes (range: 0.9–17.0) and the majority of suspects detected were compounds with mass values of 500 or less (98%).
When looking at the mass accuracy and retention time consistency across batches, the mass errors for the tracer compounds used in positive mode were all below 6 ppm and in negative mode below 5 ppm. The retention times for the tracer compounds in both modes showed only minor shifts approximating 0.2 mins in positive mode and 0.3 mins in negative mode in the worst cases (Table S2 and S3).
When looking at the differences between maternal and cord samples, 1225 suspects (85%) were detected in at least 1 paired maternal-cord sample whereas 225 features (15%) were detected in either maternal or cord samples, but not in both pairs. (Fig. 3). Three hundred and twenty-eight suspects (23%) were detected in all paired maternal-cord samples. Around half of the suspects (51%) had detection frequencies of 14 or greater among maternal-cord pairs. More suspects with a higher DF in cord relative to maternal samples were found in the negative mode and slightly more suspects with a higher DF in maternal relative to cord samples were found in the positive mode (Table S1 and Fig. S4 in supporting information for an overview of the suspects detected in the positive and the negative modes). It is important to note that Figure 3 shows only the features that were present in the suspect list. When looking at all the detected features regardless of their presence in the suspect list, there are approximately 1.5 times more positive ionization features than negative ionization features.
Figure 3.
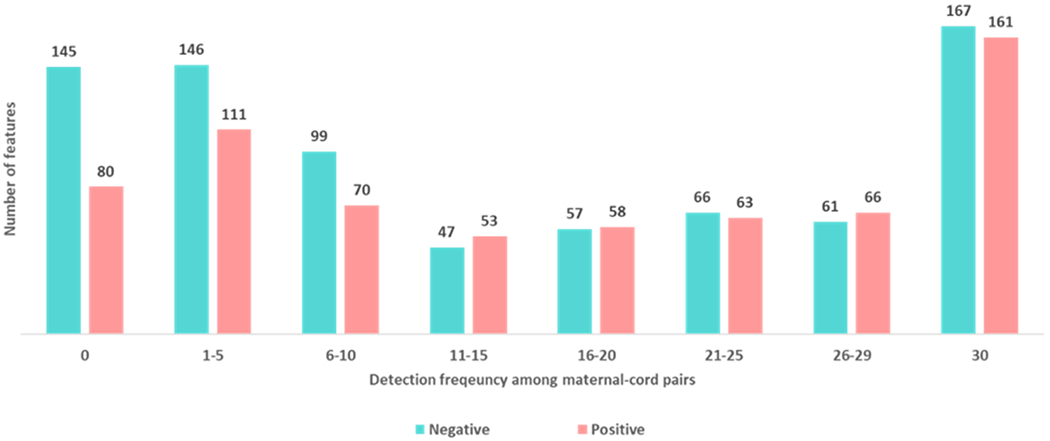
Number of suspects by detection frequency among the maternal-cord serum pairs (n=30).
Among these 1,225 suspects, the median PARC vs. M (across all samples for a specific feature) for the 643 suspects detected in the negative mode was 1.1 (IQR: 0.7–1.7) and the median PARC vs. M among 582 suspects detected in the positive mode was 0.9 (IQR: 0.5–1.5) (Fig. 4A). Peak areas in maternal samples were numerically higher relative to the peak areas in cord samples among suspects detected in the positive mode but were numerically lower relative to the peak area in cord samples among suspects detected in the negative mode (Fig. 4B). More suspects detected in the negative mode, compared to those in the positive mode, had a median cord peak area at least twice that of the median maternal peak area (median PARC vs. M ≥ 2: 15% vs. 10%). On the contrary, more suspects detected in the positive mode, compared to those in the negative mode, had a median maternal peak area that was at least twice that of the median cord peak area (median PARC vs. M ≤ 0.5: 21% vs. 10%).
Figure 4.
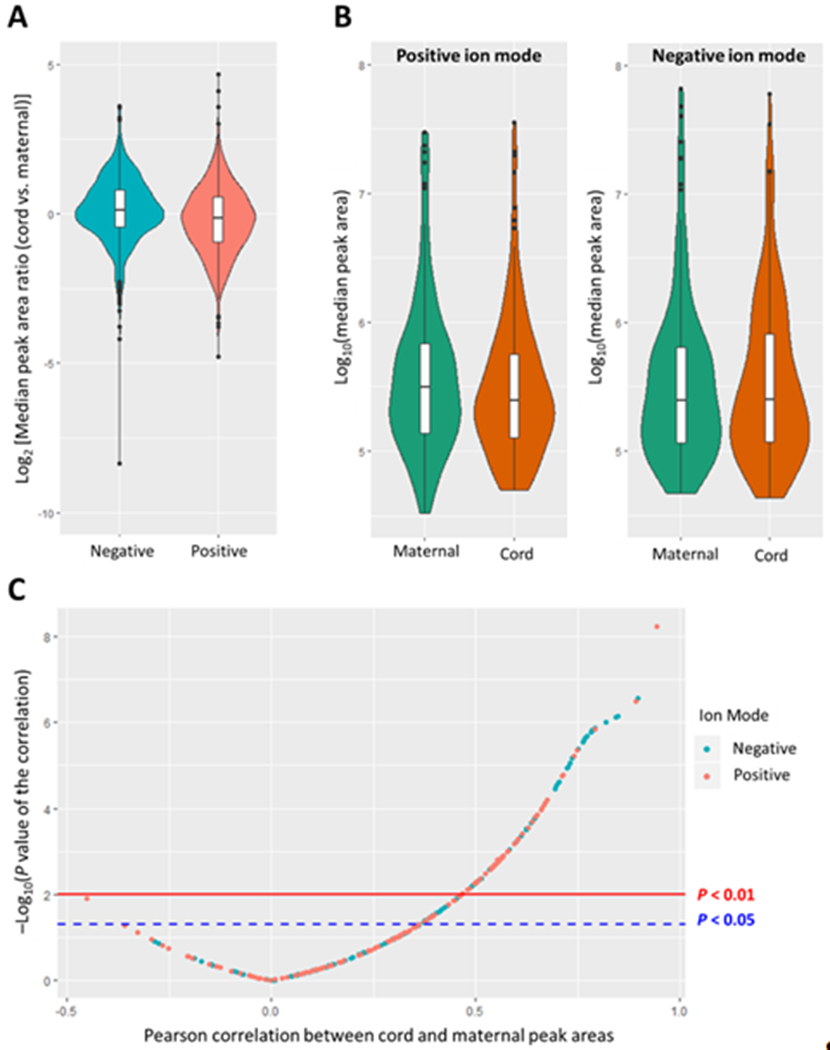
Relationship between cord and maternal peak area. A. Distribution of median peak area ratio (cord vs. maternal) among 1225 suspects detected in at least 1 paired maternal-cord sample; B. Distribution of median peak area by sample type and ion modes; C. Correlation between cord and maternal peak area among 328 features detected in all maternal-cord pairs.
For the 328 suspects detected in all paired samples, we further explored the correlation between cord and maternal peak area (Fig. 4C). There were 104 features with a Spearman correlation of at least 0.5 and a p-value<0.05. Despite that the majority of suspects were detected in at least one maternal and one cord sample, 133 suspects (9.2%) were detected exclusively in maternal or cord serum samples. There were 666 suspects in maternal samples and 648 suspects in cord samples with detection frequencies of over 80% (n=24). Among these, the peak areas of 114 and 102 suspects in maternal and cord samples, respectively differed across at least one of four demographic variables. There were 99 suspects that were detected in all 30 paired samples with peak areas in cord or maternal samples that differed across at least one demographic variables. Most of the suspects differed by a specific demographic variable either when examining maternal peak area or cord peak area but not both (Fig. 5), suggesting that demographic differences in peak area of suspects may vary by sample type (maternal versus cord). Among features that significantly differed by each corresponding demographic variable, more features had a higher median peak area in maternal samples among women who were Non-Latinas (relative to Latinas), had some college education or above (relative to those with a high school education or less), had a household income of $40,000 or more (relative to those with a household income of less than $40,000), and were born in the U.S. (relative to those who were not). Features’ median peak area in cord samples showed a similar pattern except that more features had a higher median peak area among women who were not born in the U.S. (Supplementary Spreadsheet S2).
Figure 5.
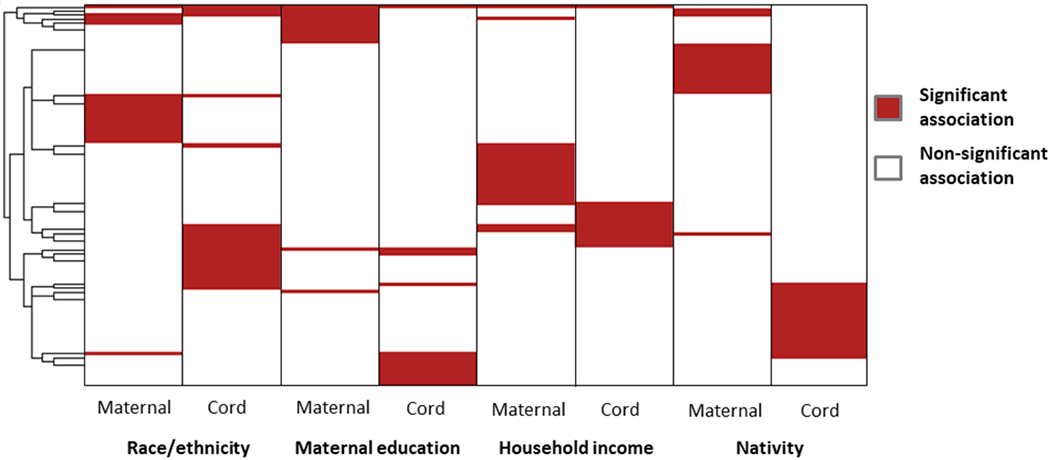
Clustering of suspects (row) in cord and maternal serum whose peak area significantly differed by at least one demographic variable (column).
Features selected for fragmentation analysis
Based on the chemical prioritization criteria and steps described above in the materials and methods section (Fig. 2), we selected 106 suspects detected in positive mode and 102 suspects (total n=208) detected in negative mode for fragmentation analysis (Fig. 2). After inspecting the MS/MS matches to the MS/MS libraries, we tentatively identified 73 chemical features (level 2 confidence) (Supplementary Spreadsheet: “Level 1-2 annotations”).
Confirmed features
After purchasing analytical standards and comparing the mass spectrum of the detected features and that of the corresponding standards, we confirmed the presence of 17 chemical features (Supplementary Spreadsheet: “Level 1-2 annotations”), which came down to 15 unique chemical compounds after removing duplicates between positive and negative ionization mode (cortisone) and after removing stereoisomers (chenodeoxycholic acid) (Supplementary Spreadsheet: “Level 1-2 annotations” and “Annotations summary”).
Database Search
When looking at the top scored annotations 1, 2 and 3 (score ≥ 0.5), the largest group, with 42 annotated compounds, were chemical compounds for which there was limited to no available information on their chemical uses, their presence in consumer products and whether they were high production volume chemicals (Fig.6 and Supplementary Spreadsheet: “Annotations summary”). The majority of these chemicals (33/42) were annotated with MS/MS spectral libraries (level 2 annotations). The second largest group was plasticizers with 29 compounds. After removing the compounds that had been previously reported in human exposure studies, we found 55 chemical compounds that had not been previously reported. Also, in this case, the largest group consisted of chemicals with limited to no information (Unknowns; n=37) and the second largest group consisted of plasticizers (n=10). We also found 4 PFAS that, according to our method, appeared to not have been previously reported in human blood/serum: 4m perfluorooctanesulfonic acid, 6:2 fluorotelomer phosphate monoester, methyl perfluoroundecanoate, and 2-perfluorooctyl ethanoic acid. However, upon closer examination with literature review, we found that only methyl perfluoroundecanoate, and 2-perfluorooctyl ethanoic acid had not been previously reported, while 4m perfluorooctanesulfonic acid, 6:2 fluorotelomer phosphate monoester showed to have been reported in a very limited number of studies.
Figure 6.
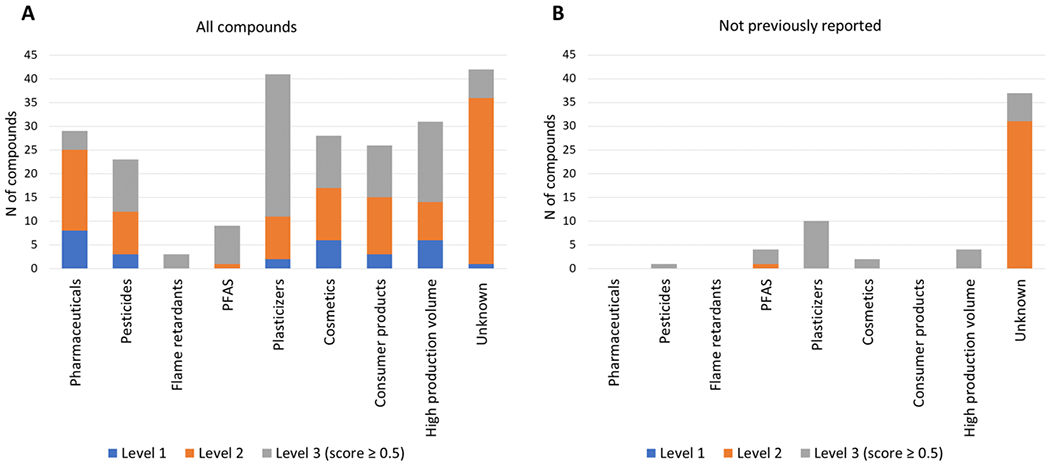
Chemical uses information for (A) all annotated compounds and (B) for compounds that were found to not have been previously reported in human exposure studies involving human blood or serum samples. The annotations are shown by confidence level as proposed by Schymanski et al.31 The chemical use information was collected from databases on EPA’s CompTox Chemicals Dashboard.30 The Human Metabolome Database37 was used to remove chemical features with endogenous sources. The Blood Exposome database41,42 was used to determine if a compound had been previously reported in human exposure studies.
DISCUSSION
Suspect screening and non-targeted analysis approaches have been increasingly used for both environmental monitoring19–21,43–45 and studying human exposure to known and unknown chemicals25,26,46. However, most studies evaluating human samples have focused on endogenous compounds and our study is the first – to our knowledge – that screens for a comprehensive database of industrial chemicals. Further, we have additionally expanded analytic capacity through MS/MS fragmentation analysis in both maternal and cord serum samples to assist in the identification of chemicals. With our study of focused screening of matched maternal and cord serum samples for high production volume industrial chemicals, our study provides valuable insights on fetal exposure to previously unreported chemicals.
While our study could be described as both “suspect screening” and “non-targeted analysis”, we chose the terminology “suspect screening” because if fits better our focused search of industrial chemicals that are “suspected” to be present in human blood. In addition, while non-targeted analysis or untargeted metabolomics studies prioritize features for MS/MS fragmentation based on detection frequency and abundance,22,47,48 we chose to prioritize features that showed some significance in terms of partitioning between maternal and cord blood and in terms of demographic variables, shifting our focus from the most abundant features to exogenous chemical features that are “suspected” to have some biological and/or demographic significance. This workflow can be used for methods prioritizing chemicals for further evaluation and adds to other approaches for prioritizing the chemical space for targeted biomonitoring.13
Following our suspect screening workflow, we found 42 chemical compounds that had limited to no information on their sources and use and could not be grouped under the categories of endogenous, pharmaceuticals, pesticides, flame retardants, PFAS, plasticizers, ingredients in cosmetics and consumer products or high production volume chemicals, as classified in EPA’s Chemicals Dashboard30. After removing the chemical compounds that had been previously reported in human exposure studies, we found 37 chemical compounds that had limited to no information and could not be grouped in any of our categories (Fig.6 and Supplementary Spreadsheet: “Annotations summary” and “Not previously reported”). Some examples of these chemicals are pyrenophorol, thermopsine and thymol-beta-D-glucoside. The identification of chemicals with unknown sources and uses is likely reflective of gaps in requirements for disclosing use of chemicals in consumer and industrial products.49 Previous work on suspect screening of chemicals in consumer products has shown that only 30.5% of the chemicals used in consumer products are reported in chemical lists with known chemicals used in these applications.49
We tentatively identified a number of chemicals that had not been previously reported in other biomonitoring studies. Some examples of chemicals with known sources and uses but that had not been previously reported were (i) 1-(1-Acetyl-2,2,6,6-tetramethylpiperidin-4-yl)-3-dodecylpyrrolidine-2,5-dione, which is a known high production volume chemical used in consumer products, such as fragrances; (ii) methyl perfluoroundecanoate, and 2-perfluorooctyl ethanoic acid, which are two PFAS; and (iii) Sumilizer GA 80, which is a plasticizer (Supplementary Spreadsheet: “Not previously reported”). It is important to note that although our database search for finding not previously reported chemicals is extensive, it may in some limited cases produce false positives. As illustrated by two PFAS (4m perfluorooctanesulfonic acid, 6:2 fluorotelomer phosphate monoester), there may be cases where less well-studied chemicals may appear as not-previously reported but they may be reported in human blood/serum by a very limited number of studies. Nevertheless, these chemicals require further investigation due to their very limited information in the literature.
The large presence of poorly characterized chemicals in maternal and cord blood samples warrants further investigation to understand where these chemicals might be coming from and how they may affect human health. We found that, in general, the levels of detected features were similar between cord and maternal samples (Figs. 4A and 4B), indicating that the majority of the chemicals observed do not show differential partitioning between maternal and cord blood and that they can cross the placenta without being inhibited by filtering processes. It is important to acknowledge, however, that this finding could be an artifact of the analytical instrumentation (LC-QTOF/MS) used in this study, which is primarily focused on polar and involatile chemicals. Polar chemicals are generally hydrophilic and dissolve well in blood making it easy for them to cross the placenta as part of the blood flow from the mother to the fetus. An additional analysis of the samples with instruments that focus on non-polar and volatile/semi-volatile chemicals, such as Gas Chromatography (GC) – QTOF/MS, might present a different picture. Non-polar chemicals may bind to lipids in the placenta which may slow down their transfer to the fetus. This is a hypothesis that could be explored further in future studies.
While the majority of chemicals that were detected in maternal samples were also detected in cord samples, 133 suspects (9.2%) were detected exclusively in maternal or cord serum samples. This finding indicates that there may be certain suspects that appear exclusively on the maternal or on the fetal side. However, it is important to note that the detection frequency is calculated based on the number of chemicals that were able to pass the detection threshold of the current method and that a “non-detect” does not necessarily mean “non-present.” Thus, a more likely scenario is that these 133 features were present, but at low amounts that could not be detected with the current analytical method.
For several suspect features, we observed significant differences across socioeconomic and racial/ethnic groups indicating differential exposures to certain chemical compounds. We observed, for example, that among features that significantly differed by each corresponding demographic variable, more features had a higher median peak area in maternal samples among women with a household income of $40,000 or more. This finding could indicate important socioeconomic differences in the purchase and use of consumer products. This observation aligns with Montazeri et al.,50 in their systematic review of multiple biomonitoring studies, in which they observed that environmental exposures are not exclusively associated with lower socioeconomic status, and that for many environmental contaminants, higher levels can occur in groups with higher socioeconomic status.
We found 23% of the detected features were matched with a chemical formula from our database (Fig 1). Given that we focused on high volume chemicals, we anticipated that we might find more matches. However, many suspects may be of relatively low concentration in the samples, as are most industrial chemicals, and in many cases, they may be below the detection limit of the analytical method. Targeted analysis with analytical methods of lower mass resolution but higher sensitivity, such as LC-Triple Quadrupole MS (LC-TQ/MS), could reveal the presence of additional compounds. This observation indicates that non-targeted analysis techniques could benefit from broad screening semi-targeted methods, where hundreds or thousands of analytical standards are used to screen for specific chemical compounds. Also, there may be by-products of metabolism that are generated through the activation, detoxification and elimination of exogenous synthetic chemical compounds. These industrial chemical metabolites can make up a large portion of the human chemisome of which more than 95% remain unknown or largely uncharacterized51–53 and thus are not included in the current suspect database. Finally, some exposures may not be present due to biotransformation and metabolism inside human body. Future studies can consider including predicted metabolites from environmental chemicals of interest that are generated by recently developed computational tools such as the BioTransformer51 in order to capture exposure to all possible forms of these chemicals.
Our study adds important information to a very scarce body of literature on suspect screening and non-targeted analysis of industrial chemical exposures in maternal and fetal pairs. Our results show that there are potential new chemical exposures that have not been adequately characterized and have not been previously of concern for environmental health scientists and regulators. Our study is an important methodological approach for future studies that will aim at characterizing the presence and toxicity of newly detected chemical compounds in the human body and assess the fate of these compounds in various human tissues, particularly between the mother and the fetus. Understanding these exposures and how they may contribute to adverse health outcomes is crucial in characterizing the human exposome and eventually preventing the development of disease.
Supplementary Material
SYNOPSIS.
Our study underlines the importance of high-throughput screening approaches, such as suspect screening, in characterizing the human exposome and prioritizing environmental chemicals for future biomonitoring studies.
ACKNOWLEDGEMENTS
This study was funded by NIH/NIEHS grant numbers P30-ES030284, UG3OD023272, UH3OD023272, P01ES022841, R01ES027051 and by the US EPA grant number RD83543301. We would like to thank Courtney Cooper for assistance with the manuscript preparation, language editing and proof reading.
Footnotes
SUPPORTING INFORMATION
Supporting Information: Figures S1–S7 and Tables S1–S3
Supporting Information Spreadsheet: Contains tables, spreadsheets and raw data referenced throughout the manuscript.
DATA AVAILABILITY
All raw data and spectra will be submitted to the Metabolomics Workbench upon acceptance (https://www.metabolomicsworkbench.org/)
CONFLICT OF INTEREST DISCLOSURE
The authors declare no competing financial interests.
REFERENCES
- (1).Diamanti-Kandarakis E; Bourguignon J-P; Giudice LC; Hauser R; Prins GS; Soto AM; Zoeller RT; Gore AC Endocrine-Disrupting Chemicals: An Endocrine Society Scientific Statement. Endocrine Reviews 2009, 30 (4), 293–342. 10.1210/er.2009-0002. [DOI] [PMC free article] [PubMed] [Google Scholar]
- (2).National Cancer Institute. Reducing Environmental Cancer Risk: What We Can Do Now. President’s Cancer Panel 2008-2009 Annual Report; Bethesda (MD), 2010. [Google Scholar]
- (3).The American College of Obstetricians and Gynecologists. Exposure to Toxic Environmental Agents. Committee Opinion No. 575. Obstetrics and gynecology 2013, 122 (4), 931–935. 10.1097/01.AOG.0000435416.21944.54. [DOI] [PubMed] [Google Scholar]
- (4).Wang A; Padula A; Sirota M; Woodruff TJ Environmental Influences on Reproductive Health: The Importance of Chemical Exposures. Fertility and sterility 2016, 106 (4), 905–929. 10.1016/j.fertnstert.2016.07.1076. [DOI] [PMC free article] [PubMed] [Google Scholar]
- (5).Woodruff TJ; Zota AR; Schwartz JM Environmental Chemicals in Pregnant Women in the United States: NHANES 2003-2004. Environmental health perspectives 2011, 119 (6), 878–885. 10.1289/ehp.1002727. [DOI] [PMC free article] [PubMed] [Google Scholar]
- (6).U.S. Centers for Disease Control and Prevention. The Fourth National Report on Human Exposure to Environmental Chemicals (Updated Tables, January 2017).; 2017. [Google Scholar]
- (7).Needham LL; Grandjean P; Heinzow B; Jørgensen PJ; Nielsen F; Patterson DG; Sjödin A; Turner WE; Weihe P Partition of Environmental Chemicals between Maternal and Fetal Blood and Tissues. Environmental science & technology 2011, 45 (3), 1121–1126. 10.1021/es1019614. [DOI] [PMC free article] [PubMed] [Google Scholar]
- (8).Aylward LL; Hays SM; Kirman CR; Marchitti SA; Kenneke JF; English C; Mattison DR; Becker RA Relationships of Chemical Concentrations in Maternal and Cord Blood: A Review of Available Data. Journal of toxicology and environmental health. Part B, Critical reviews 2014, 17 (3), 175–203. 10.1080/10937404.2014.884956. [DOI] [PubMed] [Google Scholar]
- (9).Morello-Frosch R; Cushing LJ; Jesdale BM; Schwartz JM; Guo W; Guo T; Wang M; Harwani S; Petropoulou S-SE; Duong W; Park JJ; Petreas MX; Gajek R; Alvaran J; She J; Dobraca D; Das R; Woodruff TJ Environmental Chemicals in an Urban Population of Pregnant Women and Their Newborns from San Francisco. Environmental Science & Technology 2016, 50 (22), 12464–12472. 10.1021/acs.est.6b03492. [DOI] [PMC free article] [PubMed] [Google Scholar]
- (10).U.S. Environmental Protection Agency. Chemical Data Reporting Fact Sheet: Basic Information https://www.epa.gov/chemical-data-reporting/chemical-data-reporting-fact-sheet-basic-information (accessed Jun 19, 2017).
- (11).Di Renzo GC; Conry JA; Blake J; DeFrancesco MS; DeNicola N; Martin JN; McCue KA; Richmond D; Shah A; Sutton P; Woodruff TJ; van der Poel SZ; Giudice LC International Federation of Gynecology and Obstetrics Opinion on Reproductive Health Impacts of Exposure to Toxic Environmental Chemicals. International Journal of Gynaecology and Obstetrics 2015, 131 (3), 219–225. 10.1016/j.ijgo.2015.09.002. [DOI] [PMC free article] [PubMed] [Google Scholar]
- (12).U.S. Environmental Protection Agency. 2016 Chemical Data Reporting Results https://www.epa.gov/chemical-data-reporting/2016-chemical-data-reporting-results (accessed Jul 22, 2017).
- (13).Pellizzari ED; Woodruff TJ; Boyles RR; Kannan K; Beamer PI; Buckley JP; Wang A; Zhu Y; Bennett DH; (Environmental influences on Child Health Outcomes). Identifying and Prioritizing Chemicals with Uncertain Burden of Exposure: Opportunities for Biomonitoring and Health-Related Research. Environmental health perspectives 2019, 127 (12), 126001. 10.1289/EHP5133. [DOI] [PMC free article] [PubMed] [Google Scholar]
- (14).Andra SS; Austin C; Patel D; Dolios G; Awawda M; Arora M Trends in the Application of High-Resolution Mass Spectrometry for Human Biomonitoring: An Analytical Primer to Studying the Environmental Chemical Space of the Human Exposome. Environment International 2017, 100, 32–61. 10.1016/j.envint.2016.11.026. [DOI] [PMC free article] [PubMed] [Google Scholar]
- (15).Dennis KK; Marder E; Balshaw DM; Cui Y; Lynes MA; Patti GJ; Rappaport SM; Shaughnessy DT; Vrijheid M; Barr DB Biomonitoring in the Era of the Exposome. Environmental Health Perspectives 2017, 125 (4). 10.1289/EHP474. [DOI] [PMC free article] [PubMed] [Google Scholar]
- (16).Wambaugh JF; Bare JC; Carignan CC; Dionisio KL; Dodson RE; Jolliet O; Liu X; Meyer DE; Newton SR; Phillips KA; Price PS; Ring CL; Shin H-M; Sobus JR; Tal T; Ulrich EM; Vallero DA; Wetmore BA; Isaacs KK New Approach Methodologies for Exposure Science. Current Opinion in Toxicology 2019, 15, 76–92. 10.1016/j.cotox.2019.07.001. [DOI] [Google Scholar]
- (17).Walker DI; Valvi D; Rothman N; Lan Q; Miller GW; Jones DP The Metabolome: A Key Measure for Exposome Research in Epidemiology. Current Epidemiology Reports 2019, 6 (2), 93–103. 10.1007/s40471-019-00187-4. [DOI] [PMC free article] [PubMed] [Google Scholar]
- (18).Gerona RR; Schwartz JM; Pan J; Friesen MM; Lin T; Woodruff TJ Suspect Screening of Maternal Serum to Identify New Environmental Chemical Biomonitoring Targets Using Liquid Chromatography–Quadrupole Time-of-Flight Mass Spectrometry. Journal Of Exposure Science And Environmental Epidemiology 2017, 28 (2), 101–108. 10.1038/jes.2017.28. [DOI] [PMC free article] [PubMed] [Google Scholar]
- (19).Newton SR; McMahen RL; Sobus JR; Mansouri K; Williams AJ; McEachran AD; Strynar MJ Suspect Screening and Non-Targeted Analysis of Drinking Water Using Point-of-Use Filters. Environmental Pollution 2018, 234, 297–306. 10.1016/j.envpol.2017.11.033. [DOI] [PMC free article] [PubMed] [Google Scholar]
- (20).Rager JE; Strynar MJ; Liang S; McMahen RL; Richard AM; Grulke CM; Wambaugh JF; Isaacs KK; Judson R; Williams AJ; Sobus JR Linking High Resolution Mass Spectrometry Data with Exposure and Toxicity Forecasts to Advance High-Throughput Environmental Monitoring. Environment International 2016, 88, 269–280. 10.1016/j.envint.2015.12.008. [DOI] [PubMed] [Google Scholar]
- (21).Wang Y; Yu N; Zhu X; Guo H; Jiang J; Wang X; Shi W; Wu J; Yu H; Wei S Suspect and Nontarget Screening of Per- and Polyfluoroalkyl Substances in Wastewater from a Fluorochemical Manufacturing Park. Environmental Science and Technology 2018, 52 (19), 11007–11016. 10.1021/acs.est.8b03030. [DOI] [PubMed] [Google Scholar]
- (22).Moschet C; Anumol T; Lew BM; Bennett DH; Young TM Household Dust as a Repository of Chemical Accumulation: New Insights from a Comprehensive High-Resolution Mass Spectrometric Study. Environmental Science & Technology 2018, 52 (5), 2878–2887. 10.1021/acs.est.7b05767. [DOI] [PMC free article] [PubMed] [Google Scholar]
- (23).Tautenhahn R; Cho K; Uritboonthai W; Zhu Z; Patti GJ; Siuzdak G An Accelerated Workflow for Untargeted Metabolomics Using the METLIN Database. Nature Biotechnology 2012, 30 (9), 826–828. 10.1038/nbt.2348. [DOI] [PMC free article] [PubMed] [Google Scholar]
- (24).Petrick LM; Schiffman C; Edmands WMB; Yano Y; Perttula K; Whitehead T; Metayer C; Wheelock CE; Arora M; Grigoryan H; Carlsson H; Dudoit S; Rappaport SM Metabolomics of Neonatal Blood Spots Reveal Distinct Phenotypes of Pediatric Acute Lymphoblastic Leukemia and Potential Effects of Early-Life Nutrition. Cancer Letters 2019, 452, 71–78. 10.1016/j.canlet.2019.03.007. [DOI] [PMC free article] [PubMed] [Google Scholar]
- (25).Grashow R; Bessonneau V; Gerona RR; Wang A; Trowbridge J; Lin T; Buren H; Rudel RA; Morello-Frosch R Integrating Exposure Knowledge and Serum Suspect Screening as a New Approach to Biomonitoring: An Application in Firefighters and Office Workers. Environ Sci Technol 2020, 54 (7), 4344–4355. 10.1021/acs.est.9b04579. [DOI] [PMC free article] [PubMed] [Google Scholar]
- (26).Wang A; Gerona RR; Schwartz JM; Lin T; Sirota M; Morello-Frosch R; Woodruff TJ A Suspect Screening Method for Characterizing Multiple Chemical Exposures among a Demographically Diverse Population of Pregnant Women in San Francisco. Environmental health perspectives 2018, 126 (7), 077009. 10.1289/EHP2920. [DOI] [PMC free article] [PubMed] [Google Scholar]
- (27).Wang A; Schwartz JM; Gerona R; Lin T; Morello-Frosch R; Sirota M; Woodruff T The Pregnancy Chemisome in Relation to Birth Outcomes and Consumer Product Use: Suspect Screening of Industrial Chemicals. ISEE Conference Abstracts 2018, 2018 (1), isesisee.2018.O03.03.11. 10.1289/isesisee.2018.O03.03.11. [DOI] [Google Scholar]
- (28).Wild CP Complementing the Genome with an “Exposome”: The Outstanding Challenge of Environmental Exposure Measurement in Molecular Epidemiology. Cancer epidemiology, biomarkers & prevention : a publication of the American Association for Cancer Research, cosponsored by the American Society of Preventive Oncology 2005, 14 (8), 1847–1850. 10.1158/1055-9965.EPI-05-0456. [DOI] [PubMed] [Google Scholar]
- (29).Wang Z; Dewitt JC; Higgins CP; Cousins IT A Never-Ending Story of Per- and Polyfluoroalkyl Substances (PFASs)? Environ Sci Technol. 2017, 51, 2508–2518. 10.1021/acs.est.6b04806. [DOI] [PubMed] [Google Scholar]
- (30).U.S. Environmental Protection Agency. Chemistry Dashboard https://comptox.epa.gov/dashboard/. [Google Scholar]
- (31).Schymanski EL; Jeon J; Gulde R; Fenner K; Ruff M; Singer HP; Hollender J Identifying Small Molecules via High Resolution Mass Spectrometry: Communicating Confidence. Environ. Sci. Technol. 2014, 48 (4), 2097–2098. 10.1021/es5002105. [DOI] [PubMed] [Google Scholar]
- (32).Houtz E; Wang M; Park J-S Identification and Fate of Aqueous Film Forming Foam Derived Per- and Polyfluoroalkyl Substances in a Wastewater Treatment Plant. Environmental Science & Technology 2018, 52 (22), 13212–13221. 10.1021/acs.est.8b04028. [DOI] [PubMed] [Google Scholar]
- (33).Wang M; Bastiaensen M; Kinyua J; Petreas M; Covaci A; Park J-S Exposure Profile Comparison and Screening of Unknown Contaminants Using LC-QToF: A Cat Hyperthyroidism Study. Dioxin 2019: Kyoto, Japan: 2019. [Google Scholar]
- (34).Leek JT; Johnson WE; Parker HS; Jaffe AE; Storey JD The Sva Package for Removing Batch Effects and Other Unwanted Variation in High-Throughput Experiments. Bioinformatics 2012, 28 (6), 882–883. [DOI] [PMC free article] [PubMed] [Google Scholar]
- (35).CompMS | MS-DIAL http://prime.psc.riken.jp/compms/msdial/main.html#Demonstration (accessed May 19, 2020).
- (36).Horai H; Arita M; Kanaya S; Nihei Y; Ikeda T; Suwa K; Ojima Y; Tanaka K; Tanaka S; Aoshima K; Oda Y; Kakazu Y; Kusano M; Tohge T; Matsuda F; Sawada Y; Hirai MY; Nakanishi H; Ikeda K; Akimoto N; Maoka T; Takahashi H; Ara T; Sakurai N; Suzuki H; Shibata D; Neumann S; Iida T; Tanaka K; Funatsu K; Matsuura F; Soga T; Taguchi R; Saito K; Nishioka T MassBank: A Public Repository for Sharing Mass Spectral Data for Life Sciences. Journal of Mass Spectrometry 2010, 45 (7), 703–714. 10.1002/jms.1777. [DOI] [PubMed] [Google Scholar]
- (37).Wishart DS; Feunang YD; Marcu A; Guo AC; Liang K; Vázquez-Fresno R; Sajed T; Johnson D; Li C; Karu N; Sayeeda Z; Lo E; Assempour N; Berjanskii M; Singhal S; Arndt D; Liang Y; Badran H; Grant J; Serra-Cayuela A; Liu Y; Mandal R; Neveu V; Pon A; Knox C; Wilson M; Manach C; Scalbert A HMDB 4.0: The Human Metabolome Database for 2018. Nucleic acids research 2018, 46 (D1), D608–D617. 10.1093/nar/gkx1089. [DOI] [PMC free article] [PubMed] [Google Scholar]
- (38).mzCloud - Advanced Mass Spectral Database. https://www.mzcloud.org/.
- (39).Allen F; Pon A; Wilson M; Greiner R; Wishart D CFM-ID: A Web Server for Annotation, Spectrum Prediction and Metabolite Identification from Tandem Mass Spectra. Nucleic Acids Research 2014, 42 (W1), W94–W99. 10.1093/nar/gku436. [DOI] [PMC free article] [PubMed] [Google Scholar]
- (40).Ruttkies C; Schymanski EL; Wolf S; Hollender J; Neumann S MetFrag Relaunched: Incorporating Strategies beyond in Silico Fragmentation. J Cheminform 2016, 8, 3. 10.1186/s13321-016-0115-9. [DOI] [PMC free article] [PubMed] [Google Scholar]
- (41).Barupal Dinesh Kumar; Fiehn Oliver. Generating the Blood Exposome Database Using a Comprehensive Text Mining and Database Fusion Approach. Environmental Health Perspectives 127 (9), 097008. 10.1289/EHP4713. [DOI] [PMC free article] [PubMed] [Google Scholar]
- (42).The Blood Exposome Database https://bloodexposome.org/#/dashboard (accessed Nov 17, 2020).
- (43).Ccanccapa-Cartagena A; Pico Y; Ortiz X; Reiner EJ Suspect, Non-Target and Target Screening of Emerging Pollutants Using Data Independent Acquisition: Assessment of a Mediterranean River Basin. Science of the Total Environment 2019, 687, 355–368. 10.1016/j.scitotenv.2019.06.057. [DOI] [PubMed] [Google Scholar]
- (44).Shin H; Moschet C; Young TM; Bennett DH Measured Concentrations of Consumer Product Chemicals in California House Dust: Implications for Sources, Exposure, and Toxicity Potential. Indoor Air 2019, 30 (1), 60–75. 10.1111/ina.12607. [DOI] [PMC free article] [PubMed] [Google Scholar]
- (45).Yu N; Guo H; Yang J; Jin L; Wang X; Shi W; Zhang X; Yu H; Wei S Non-Target and Suspect Screening of Per- and Polyfluoroalkyl Substances in Airborne Particulate Matter in China. Environmental Science and Technology 2018, 52 (15), 8205–8214. 10.1021/acs.est.8b02492. [DOI] [PubMed] [Google Scholar]
- (46).Plassmann MM; Brack W; Krauss M Extending Analysis of Environmental Pollutants in Human Urine towards Screening for Suspected Compounds. Journal of Chromatography A 2015, 1394, 18–25. 10.1016/j.chroma.2015.03.040. [DOI] [PubMed] [Google Scholar]
- (47).Zhou B; Xiao JF; Ressom HW Prioritization of Putative Metabolite Identifications in LC-MS/MS Experiments Using a Computational Pipeline. PROTEOMICS 2013, 13 (2), 248–260. 10.1002/pmic.201200306. [DOI] [PMC free article] [PubMed] [Google Scholar]
- (48).Hohrenk LL; Vosough M; Schmidt TC Implementation of Chemometric Tools To Improve Data Mining and Prioritization in LC-HRMS for Nontarget Screening of Organic Micropollutants in Complex Water Matrixes. Anal. Chem. 2019, 91 (14), 9213–9220. 10.1021/acs.analchem.9b01984. [DOI] [PubMed] [Google Scholar]
- (49).Phillips KA; Yau A; Favela KA; Isaacs KK; McEachran A; Grulke C; Richard AM; Williams AJ; Sobus JR; Thomas RS; Wambaugh JF Suspect Screening Analysis of Chemicals in Consumer Products. Environ. Sci. Technol. 2018, 52 (5), 3125–3135. 10.1021/acs.est.7b04781. [DOI] [PMC free article] [PubMed] [Google Scholar]
- (50).Montazeri P; Thomsen C; Casas M; de Bont J; Haug LS; Maitre L; Papadopoulou E; Sakhi AK; Slama R; Saulnier PJ; Urquiza J; Grazuleviciene R; Andrusaityte S; McEachan R; Wright J; Chatzi L; Basagaña X; Vrijheid M Socioeconomic Position and Exposure to Multiple Environmental Chemical Contaminants in Six European Mother-Child Cohorts. International Journal of Hygiene and Environmental Health 2019, 222 (5), 864–872. 10.1016/j.ijheh.2019.04.002. [DOI] [PMC free article] [PubMed] [Google Scholar]
- (51).Djoumbou-Feunang Y; Fiamoncini J; Gil-de-la-Fuente A; Greiner R; Manach C; Wishart DS BioTransformer: A Comprehensive Computational Tool for Small Molecule Metabolism Prediction and Metabolite Identification. Journal of Cheminformatics 2019, 11 (1), 2. 10.1186/s13321-018-0324-5. [DOI] [PMC free article] [PubMed] [Google Scholar]
- (52).Uppal K; Walker DI; Liu K; Li S; Go Y-M; Jones DP Computational Metabolomics: A Framework for the Million Metabolome. Chemical Research in Toxicology 2016, 19;29 (12), 1956–1975. 10.1021/acs.chemrestox.6b00179. [DOI] [PMC free article] [PubMed] [Google Scholar]
- (53).Wishart DS; Feunang YD; Marcu A; Guo AC; Liang K; Vázquez-Fresno R; Sajed T; Johnson D; Li C; Karu N; Sayeeda Z; Lo E; Assempour N; Berjanskii M; Singhal S; Arndt D; Liang Y; Badran H; Grant J; Serra-Cayuela A; Liu Y; Mandal R; Neveu V; Pon A; Knox C; Wilson M; Manach C; Scalbert A HMDB 4.0: The Human Metabolome Database for 2018. Nucleic acids research 2018, 46 (D1), D608–D617. 10.1093/nar/gkx1089. [DOI] [PMC free article] [PubMed] [Google Scholar]
Associated Data
This section collects any data citations, data availability statements, or supplementary materials included in this article.