Abstract
Complexes of copper and 1,10-phenanthroline have been utilized for organic transformations over the last 50 years. In many cases these systems are impacted by reaction conditions and perform best under an inert atmosphere. Here we explore the role the 1,10-phenanthroline ligand plays on the electronic structure and redox properties of copper coordination complexes, and what benefit related ligands may provide to enhance copper-based coupling reactions. Copper(II) triflate complexes bearing 1,10-phenanthroline (phen), ([Cu(phen)2(OTf)]OTf, 1) and oxidized derivatives of phen including [Cu(edhp)2](OTf)2 (2), [Cu(pdo)2](OTf)2 (3), [Cu(dafo)2](OTf)2 (4) were prepared and characterized. X-ray crystallographic data show these related ligands subtly impacted the coordination geometry of the copper(II) ion. Complexes 1–3 had only incremental changes to the redox properties of the copper ions, complex 4 showed a drastically different redox potential affording a remarkably air stable copper(I) complex. These complexes 1–4 were then used to catalyze the C—N bond forming cross coupling between imidazole and various boronic acid substrates, where the increased stability of the copper(I) species in complex 4 appears to better support these CEL cross couplings.
Graphical Abstract
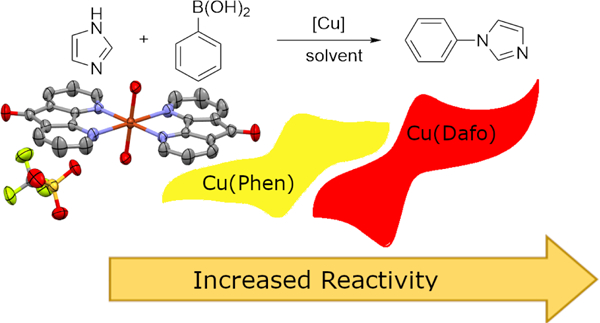
Complexes of copper(II) and 1,10-phenanthroline (and phen derivatives) have been utilized for organic transformations over the last 50 years. Here we explore the role phen and phen-based ligands plays on the electronic structure and redox properties of copper coordination complexes, and what benefits these related ligands may provide to enhance copper-based C—N coupling reactions. X-ray crystallographic data show these related ligands subtly impacted the coordination geometry of the copper(II) ion in these complexes. The diazafluorenone containing complex showed a drastically different redox potential, which affords the potential to stabilize a copper(I) complex. The increased stability of the copper(I) species correlates to higher performing CEL cross couplings reactions.
Introduction
Copper catalyzed coupling reactions have become a valuable synthetic strategy for the construction of C—C or C–heteroatom bonds.1 Several different catalytic systems have been developed based on the Ullman reaction with a common mechanistic feature that all of these systems are thought to proceed via a copper(I)/copper(III) catalytic cycle.2 Stability of the copper(I) complex in solution is often the key aspect for reactivity, yet at the same time these species are highly sensitive to atmospheric oxidation. To circumvent this issue, reductants can be added to the reaction to generate a copper(I) species in situ,3 or new ligands can be designed that stabilize low valent metal ions. One of the most common ligands used to support copper catalyzed transformations is 1,10-phenanthroline (phen) due its ability to generate high stable complexes and its relative cost.4 Several review articles exist focusing on the use of these ligands as catalysts since they have been used to support both copper(I) and copper(II) based catalysis.5,6 Yet copper-phen complexes still suffer from a relatively low redox potential (~200 mV vs NHE), which then requires anaerobic conditions for these catalysts to turnover efficiently. However the distal C=C bond between C5 and C6 in phen can be easily oxidized generating an electron deficient phen derivative.7 From this, several derivatives can be synthesized which include 5,6-epoxyphen (L2), 5,6-phendione (L3) and 4,5-diazafluorenone (L4). These derivatives are redox active and thought of as non-innocent,8 which may contribute to changes in the electronic nature of the metal center and contribute to their reactivity. Each of these have been used as ligands for copper complexes and have been extensively characterized, via crystallography,9 electrochemistry,10 and their DNA binding affinity.11 The catalytic capabilities of these ligands support have only been briefly measured,12 where no attempt to support C—N bond forming reactions have been made, such as the Chan-Evans-Lam (CEL) coupling. Here we attempt to remedy this situation, where we report a series of new copper complexes made from 5,6-epoxyphen, phen-5,6-dione, and 4,5-diazafluorenone with triflate counter-ions, then then demonstrate their value as a class of new ligands for copper complexes to support C—N bond forming reactions.
Results and Discussion
Previously, we have reported a discrete Cu2+ phen complex, namely [Cu(phen)2OTf]OTf (1),14 which shows a good reactivity performing C- and N-atom transfer reactions.15 However, the phen ligand can be easily oxidized to functionalize the central ring of this ligand system. The C=C bond between C5 and C6 positions can be oxidized to form the 5,6-epoxyphen (L2)16 and 5,6,-dione (L3).17 L3 can be further reacted to form the 4,5-diazafluorenone (L4) by the loss of CO.18 These ligands (L2-L4) coordinate copper(II) triflate in a bidentate manner in EtOH to generate copper(II) complexes (2–4), as shown in Scheme 1.
Scheme 1.
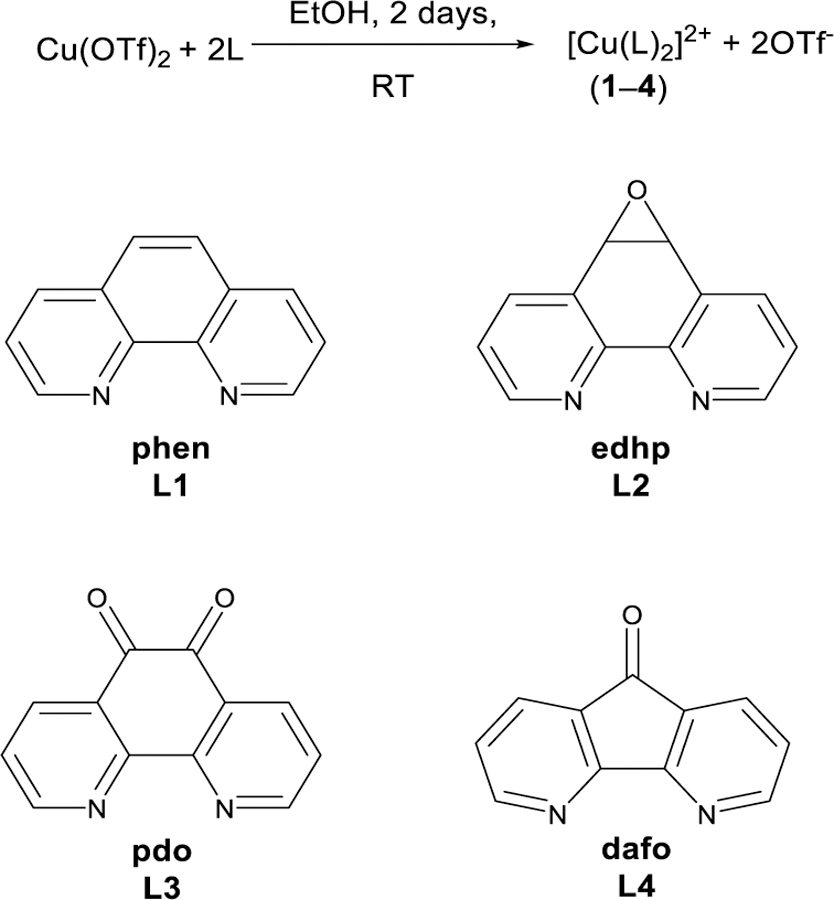
Synthesis of copper(II) complexes 1–4
The X-ray structure of [Cu(phen)2OTf]OTf has been previously reported, where the copper(II) center adopted a distorted square pyramidal structure that fits between a square pyramidal and a trigonal bipyramidal coordination mode (τ5 = 0.47).14 The coordinating triflate ion is bound weakly to the metal ion (Cu—O bond is ~2.5 Å), which is likely a highly labile bonding interaction in solution leaving an open coordination site that can be used to initiate targeted reactivity. X-ray quality crystals of complexes 2–4 were obtained and ORTEP diagrams of these complexes are reported in Figure 1. Complex (2 adopts a different 5-coordinate geometry (Fig. 1A), where the coordination mode surrounding the Cu2+ ion is much closer to a pure trigonal bipyramidal mode (τ5 = 0.84).19 A molecule of water is bound to the copper center instead of triflate in an equatorial position which has a Cu1—O1 bond distance of 2.086 Å, which is in between the Cu—O bond lengths of related [Cu(phen)2](NO3)2 and [Cu(phen)2]SO20,21 The Owater—Otriflate distance is ~ 2.70 and 2.73 Å, indicating the water is hydrogen bonded to the two triflate counter-ions.22
Figure 1.
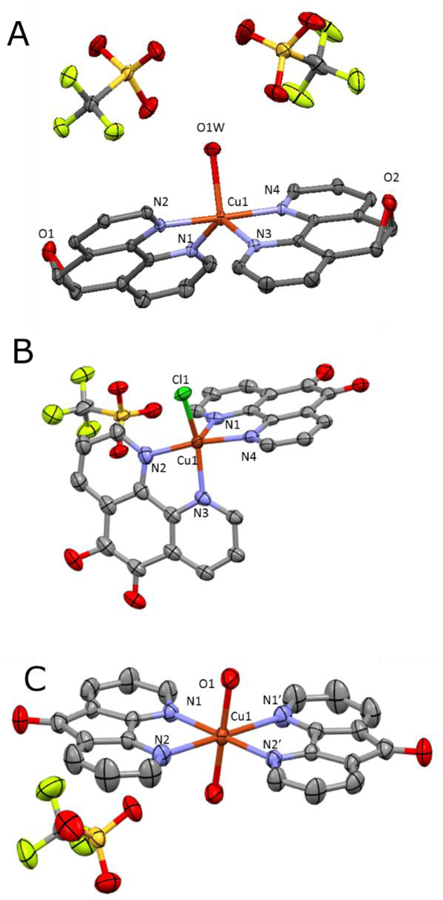
X-ray molecular structure of copper complexes. Thermal ellipsoids are shown at 50% probability. Selected bond lengths (Å) and angles (°). (2) Cu1-O1W: 2.086(2); Cu1-N3: 2.059 (2); Cu1-N4: 1.994(2); Cu1-N2: 1.990(2); Cu1-N1: 2.082(2); N1-Cu1-N3: 127.56(7); N2-Cu1-N4: 177.70(7); N2-Cu1-O1 (α): 90.24(7); N3-Cu1-O1 (β): 118.30(7). (3); Cu1-Cl1: 2.269(2); Cu1-N3: 1.984(4); Cu1-N4: 2.164(4); Cu1-N2: 2.000(5); Cu1-N1: 2.070(5); N1-Cu1-N3: 93.7(2); N2-Cu1-N4: 98.8(2); N2-Cu1-Cl (α): 90.6(1); N4-Cu1-Cl (β): 106.8(1). (4); Cu1-O2: 1.980; Cu1-N1: 1.992; Cu1-N2: 2.568; N1-Cu1-O: 89.45; N4-Cu1-O: 90.55; N1-Cu1-N2: 79.34
Complex 3 was crystalized with a bound chloride ion, which it likely extracted from the solvent and thus this is unlikely the structure of the complex formed in the reaction. Compared to previous structures, 3 a adopts distorted square-pyramidal (τ5 = 0.28), which has been observed in 5,6 dione complexes previously,23 where one of the phen Cu—N bonds is in the axial position as it is more elongated than the other (2.164 vs. 1.984 Å), while the second phen has almost equivalent C—N bonds (2.070 and 2.000 Å). We can see that the copper is bound by a chloride atom in the axial position, with a bond distance of 2.269 Å. This differs from the 2.250 Å Cu—Cl bond observed in [Cu(pda)2Cl]PF6 and the 2.294 Å Cu—Cl bond in [Cu(phen)2Cl]PF6.23
Complex 4 formed an octahedral complex with two water molecules bound to the center with each triflate interreacting with two different neighboring complexes, forming a large hydrogen bonded network with Owater—Otriflate distances of ~ 2.72 and 2.76 Å. This phenomena has been observed with the NO3− and ClO4− ions with similar complexes.24 The molecule is highly centrosymmetric with a center of inversion located on the copper giving only one triflate counter-ion in the asymmetric unit. The Cu—O bond distances of ~ 1.98 Å in this complex suggest these are stronger bonding interactions than those in complex (2. Two distinct C—N bond lengths were observed in 4 (1.992 and 2.568 Å), which are consistent with the coordination of modes in other bis(diazafluorenone) complexes.24–25 This asymmetry is tied to the improved overlap of the nitrogen lone pair and the metal’s d-orbitals resulting in unsymmetrical bond lengths.26
There is a wealth of information regarding the redox potential of copper complexes.27 In order to characterize the impact of the phen derivatives on the redox behavior of these copper(II) complexes, we have turned to cyclic voltammetry experiements.28 The complexes were scanned from between −1.5 to +1.5 V beginning at the open circuit potential. The redox potentials of all four complexes are shown in Figure 2 and summarized in Table 1, where the potentials are reported versus the normal hydrogen electrode (NHE).
Figure 2.
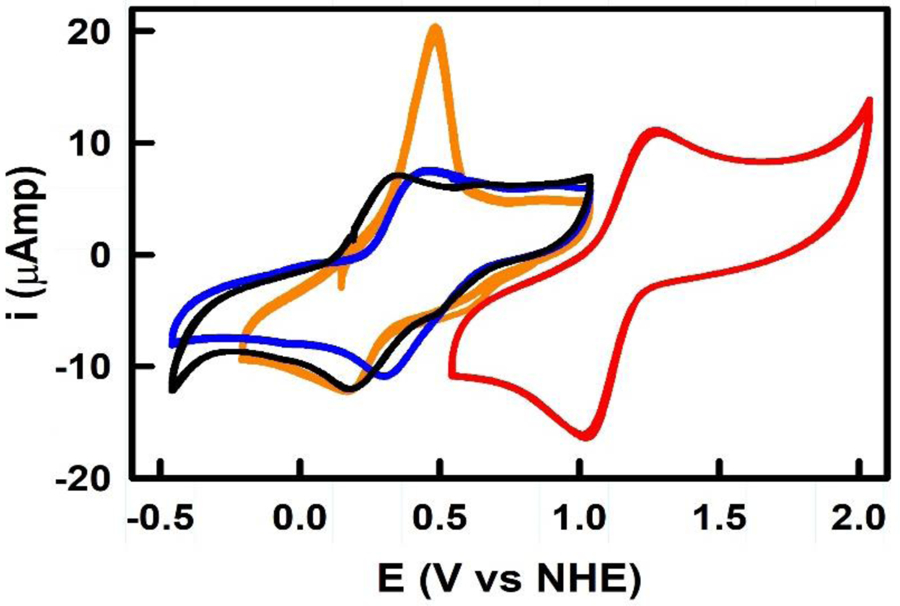
Cyclic voltammograms of complexes 1–4 vs NHE showing the Cu2+/+ redox couple at concentrations of 1 mM with a scan rate of 100 mV/s. 1, 2, 3, and 4 are shown in black, blue, orange, and red, respectively.
Table 1:
Spectroscopic and electrochemical data for copper complexes 1–4 in aqueous solution.
| Complex | λmax (nm) | ε* (M−1cm−1) | E½ (mV) | Epc (mV) | Epa (mV) |
|---|---|---|---|---|---|
| [Cu(phen)2]2+ | 740 | 200 | 265 | 190 | 340 |
| [Cu(edhp)2]2+ | 690 | 510 | 285 | 220 | 350 |
| [Cu(pdo)2]2+ | 685 | 400 | 343 | 191 | 494 |
| [Cu(dafo)2]2+ | 700 | 150 | 1165 | 1050 | 1280 |
Estimated molar absorptivity for the Cu2+ species, based on spin quantitation of samples
The unbound phen ligand has been known to lower the cathodic region with one electron quasi-reversible waves.29 The Cu2+/Cu+ redox wave for phenanthroline complexes has been shown to occur between 200 and 1200 mV (vs NHE) depending on the substitution present on the ligand.30 For 1 the reduction wave associated with the Cu2+ to Cu+ transition appears at 190 mV, while its oxidation wave occurs at 340 mV. These processes are consistent with a fast, metal ion centered, quasi-reversible electrochemical process.31 The formation of Cu+ is followed by the appearance of second smaller and broader reduction peaks starting at −260 mV and extending up to the cathodic limit of the complex. This indicates a kinetically slower electron exchange process of the reduced complex and its ligands. The shape of the wave at the cathodic limit is consistent with the decomposition of the complex leading to formation of free ligands and Cu metal. The reverse oxidation wave has slower kinetics as well. The oxidation wave starts to appear at −580 mV and the oxidation current increases until a distinct peak at –40 mV appears. This has previously ascribed to the oxidation of phen32 followed by the Cu+ oxidation at 340 mV, which is in range of other reported [Cu(Phen)2]2+ complexes (see Figures S1–S4 for further information).33 Complex (2 shows two reduction waves at 220 mV and −1060 mV. The first reduction wave at 220 mV is quasi-reversible generating Cu+ from the Cu2+ complex. The second reduction wave is irreversible and occurs at −1060 mV. This peak is typically described as a ligand conjugate reduction,34 where in both ligands undergo reduction simultaneously giving rise to a high cathodic current. John et al.34 observed these peaks when they scanned the cathodic regions with individual ligands. In the reverse scan, the one or both the ligands oxidize in a slow electron transfer process indicated by wider peaks. The oxidation wave associated with the conversion of Cu+ to Cu2+ is seen at 350 mV. Complex 3 shows that the Cu2+ complex undergoes reduction at 191 mV vs NHE. Upon oxidation of [Cu(pdo)]2+ at 494 mV, the complex decomposes to yield free ligand and copper ions. The decomposition of phendione has been reported by Goss et al.35 and was confirmed by matching the potentials of free ligand and the copper complex. The cyclic voltammogram in Figure S2 shows similar data that is consistent with ligand decomposition followed by an oxidation event. Scanning in the negative potential region showed a decrease in the oxidation currents, which is indicative of copper deposition on the glassy carbon electrode. Complex 4 showed two reduction waves. The first wave appearing at 1050 mV which we have assigned as the Cu2+/+ reduction wave. Immediately after the reduction, a sharp increase in current is observed indicating copper deposition on the glassy carbon electrode. When the scan is stopped before the oxidative stripping of Cu, the electrode surface showed a coating consistent with Cu is being electrodeposited at −240 mV from Cu+ complex. The plating of copper continues as the cathodic potential is increased. Correspondingly, during the reverse oxidative stripping, the oxidative current is higher indicating significant metal deposition. Nonetheless, the Cu2+/+ couple is always electrochemically quasi-reversible. The oxidation potential for the conversation of the Cu+ complex to its +2 oxidation state is 1279 mV. It is interesting to note that the presence of the dafone ligand in these complexes shifts the Cu2+/+ redox potential by at least 900 mV. Kulkarni et al.32 determined that the Cu(dafo)2Cl2 complex was observed to have Cu2+/+ redox couple of around 800 mV vs NHE, which strongly suggests that out of all the ligands investigated, complex 4 is going to be the most efficient at stabilizing copper(I) under atmospheric conditions.
Electroparamagnetic resonance (EPR) spectroscopy was performed to characterize the electronic structure of complexes 1–4 shown in Figure 3. Complex 1 shows a distinctive Cu2+ signal with a prototypical four-line hyperfine signal g|| = 2.27 (A|| = 157 G) and g⊥= 2.04, which is consistent with the nuclear spin associated with Cu (I = 3/2). This signal is axial and since g||> g⊥, the unpaired electron lies in the dx2-y2 orbital.10 Complexes 2–4 show a very similar EPR spectra with g⊥= 2.04, however the four hyperfine coupling signals for these complexes are not as distinct. Complexes 3 and 4 show some additional hyperfine structure that could be consistent with at least 2 electronically different copper(II) species contributing to the EPR spectra collected with g|| = 2.27 (A|| = 159 G) and g|| = 2.32 (A|| = 159 G). These data are consistent with EPR data collected for hydrated copper(II) complexes.12 Interestingly, the spectra shown in Figure 3 all come from samples with similar copper concentrations, which are confirmed by atomic absorption spectroscopy. Spin quantification of these samples indicate the percentage of copper(II) in samples 1–4 is only 58%, 14%, 22%, and 17%, respectively. Presumably the remainder of the sample are in an EPR silent, copper(I) state. Generally, these samples are made using copper(II) precursors and there are no obvious reducing agents added to these copper complexes. However, during complex formation L1, L2, L3, and L4 are added to copper(II) salts in sight excess to generate complexes 1–4 in moderate yields, some of these ligands, which as described above have a propensity to oxidize, may contribute the formation of copper(I) character of these samples.
Figure 3.
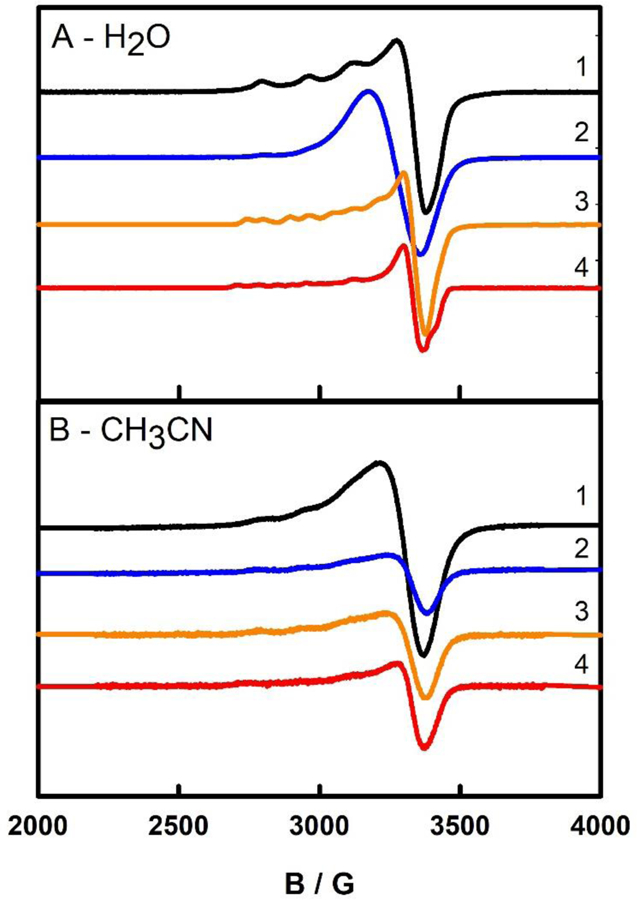
EPR of complexes 1 – 4 collected in water (A) and MeCN (B). Complexes 1, 2, 3, and 4 are shown in black, blue, orange, and red.
Subtle coordination changes in transition metal complexes have an impact on their electronic structure. The UV-vis spectra of complexes 1–4 are shown in Figure 4. Each complex has broad d-to-d transitions between 500 – 900 nm. Complex 1 had the most red-shifted absorbance maxima in this region, showing a broad absorption transition with a λmax of 735 nm. Complexes 2, 3 and 4 have similar absorbance maxima of 690 nm, 685 nm and 700 nm, respectively. Only complex 3 shows a second distinctive electron transition in the visible region (450 nm). Complex 4 has considerably lower intensity in this region than the others, which is likely to be due to the larger copper(I) content in this sample.
Figure 4.
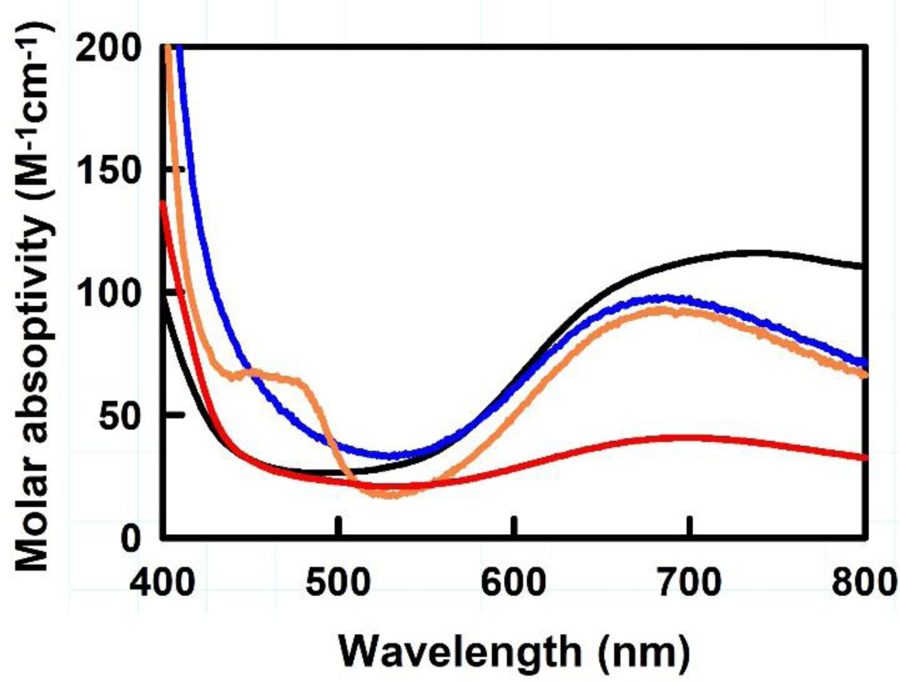
UV-Vis spectra of complexes 1–4 collected in water. 1, 2, 3, and 4 are shown in black, blue, orange, and red, respectively.
Complexes 1–4 show similar spectroscopic data, which suggests the metal centers in these complexes have similar electronic structure in their Cu2+ oxidation state. Using density functional theory, we have optimized models of these complexes to examine the electron structures of these complexes in hopes of better understanding the dramatic shift in redox potential for [Cu(dafo)2OH]+ compared to the other complexes described herein. Complexes in both the copper(I) and copper(II) states were explored (see Figure S6–S13 for further details). The [Cu(phen)2OTf]+ DFT model complex optimized using pBP/DN** to show a distorted trigonal pyramidal coordination geometry, much like the X-ray structural data for the same complex. However, in the gas phase calculation, some of the bonds and bonding angles show more favorable bond lengths and bond angles compared to its X-ray resolved coordination complex. For example, the crystallographically characterized complex 1 has a long 2.3 Å Cu—O bond, whereas the DFT model complex show a stronger 2.06 Å interaction between Cu and the triflate ion. The reduced 4-coordinate [Cu(phen)2]+ complex was also optimized to yield a copper complex with a distorted tetrahedral coordination mode. We omitted non-coordinating counterions when modeling this 18-electron complex. In both DFT optimized structures, the HOMO have distinctive metal based character, where the LUMO are primarily ligand-based delocalized π*-type orbitals (Figure 5.) Similar efforts were performed for complexes 2, 3, and 4, along with their 18-electron Cu+ forms as well. Interestingly, the [Cu(dafo)2OH]+ complex DFT optimized to demonstrate a distorted trigonal bipyrmidal structure over the X-ray crystallized octahedral complex observed in Figure 1. Although the DFT models seem to be some consistency in the electronic structure of the copper(II) complexes and their reduced counterparts in terms of the nature of the molecular orbitals and their energies, there is little insight offered from the DFT calculations which accounts for the drastic shift in redox potential for complex 4.
Figure 5.
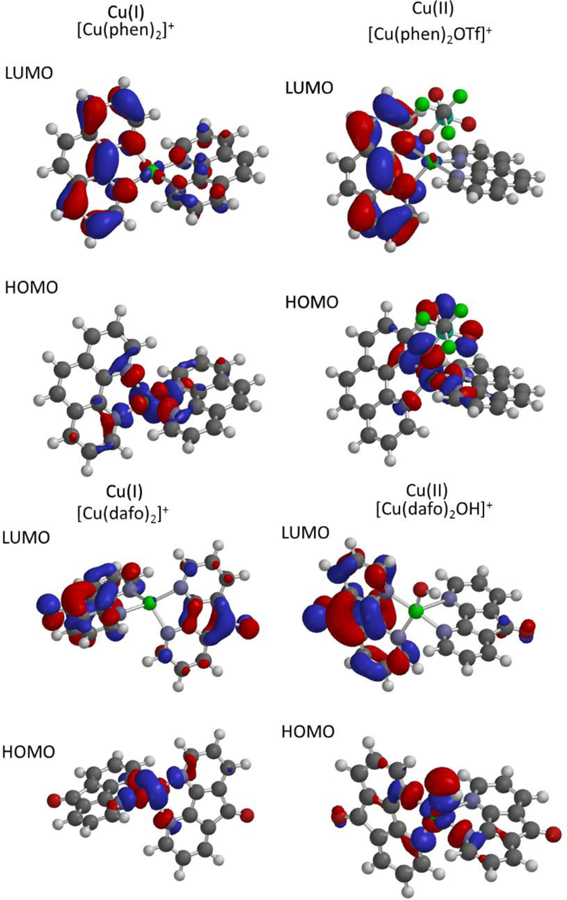
Computed HOMO-LUMO orbital diagrams using DFT optimization using pBP/DN**basis sets. The frontier orbitals of complex 1 and 4 are shown for different oxidation states of these complexes. Specifically A shows LUMO and HOMO orbitals associated with [Cu(phen)2]+ B shows related orbitals for [Cu(phen)2OTf]+, C shows LUMO and HOMO orbitals calculated for [Cu(dafo)2]+, and D shows the frontier orbitals for [Cu(dafo)2OH]+
In order to access these complexes as catalysts, we chose to investigate their potential application for C—C and C—heteroatom cross coupling reactions, such as the Chan-Evans-Lam coupling reaction. This CEL coupling is the only reported type of copper-dependent coupling reaction that is proposes to be initiated through a copper(II) species and uses O2 as an oxidant within the cycle to regenerate the copper(II) state during turnover.36 These coupling reactions occur with a boronic acid as the coupling agent to form C—C or C—heteroatom bonds and have begun to be extensively studied with most of the research focus on using copper salts or copper salts with a supporting ligand as the catalyst,37 where very few discrete complexes have been reported.38 CEL coupling reactions have also been reported to be more active under protic conditions when using copper(I) sources,39 where the current consensus mechanism for this process involves copper(I), copper(II), and copper(III) states.40 Here we apply complexes 1–4 to support C—N bond formation by coupling boronic acids to indole and other amines, where we aim to connect observed reactivity the structure or redox potential of these complexes.
The results and optimization for these reactions are shown in Table 2. Initially the four complexes were investigated as potential catalysts for the coupling of boronic acid with imidazole in methanol under ambient conditions (room temperature and aerobic environment) over a 24 hour time period. These reactions have been previously reported to proceed with high yields for copper(II) triflate species.39 It should be noted that negligible reactivity was observed without catalyst, under any of the reported conditions (Table 2, entry 1). Complexes 1–3 showed trace levels of the coupling product by gas chromatography mass spectrometry (GC-MS), while complex 4 showed 38% conversion of substrate to product (Table 2, entries 2–5). Heating the reactions to 50 °C increased the GC yields of complexes 1 and 2 to each around 30%, with complex 3 rising to 45% and complex 4 showing yields of ~72% (entries 6–9). The addition of base also improved yields further, where complex 4 was able to achieve yields of 92 % (entries 10–13). A similar observation has been reported for other CEL coupling reactions.41 Anisole, a side product, was also generated under these conditions with a yield of 25–30% by GC-MS. Although anisole is also observed in trace amounts in some other reactions, in relatively high concentrations it creates complicates the isolation of the cross-coupling product. This reaction was attempted in other polar solvents (including water, DMF, DMSO, and acetonitrile (Table 2, entries 14–18), however only limited reactivity was observed in other solvents. Reaction time and temperature were also investigated, cooling the reaction to 0 °C lowered the conversion to less than 10 %. Longer reaction times also increased yield, but full conversion was still not observed after 72 hrs at 25 °C.
Table 2.
Chen-Lam-Evans coupling of imidazole and boronic acid using catalysts 1–4
 | ||||||
|---|---|---|---|---|---|---|
| Entry | Catalyst | Base | Solvent | Temp | Time | Yield(%)a |
| 1 | - | - | MeOH | 25°C | 24 hr | ND |
| 2 | 1 | - | MeOH | 25°C | 24 hr | ND |
| 3 | 2 | - | MeOH | 25°C | 24 hr | ND |
| 4 | 3 | - | MeOH | 25°C | 24 hr | <5% |
| 5 | 4 | - | MeOH | 25°C | 24 hr | 38% |
| 6 | 1 | - | MeOH | 50°C | 24 hr | 32% |
| 7 | 2 | - | MeOH | 50°C | 24 hr | 25% |
| 8 | 3 | - | MeOH | 50°C | 24 hr | 45% |
| 9 | 4 | - | MeOH | 50°C | 24 hr | 75% (62%)b |
| 10 | 1 | K2CO3 | MeOH | 25°C | 24 hr | 9% |
| 11 | 2 | K2CO3 | MeOH | 25°C | 24 hr | 22% |
| 12 | 3 | K2CO3 | MeOH | 25°C | 24 hr | 41% |
| 13 | 4 | K2CO3 | MeOH | 25°C | 24 hr | 92% |
| 14 | 4 | - | DMF | 25°C | 24 hr | <5% |
| 15 | 4 | - | DMSO | 25°C | 24 hr | <5% |
| 16 | 4 | - | H2O | 25°C | 24 hr | <5% |
| 17 | 4 | - | MeCN | 25°C | 24 hr | <5% |
| 18 | 4 | - | MeOH | 0°C | 24 hr | <5% |
| 19 | 4 | - | MeOH | 25°C | 36 hr | 72% |
Yield by GC-MS
Isolated Yield
Complexes 1–4 all showed reactivity for CEL reaction, where complex 4 demonstrating good yields and the other complexes showing at best, fair yields. Overall, these complexes show reactivity for the CEL process along the following order: complex 4 > complex 3 > complex 2 ≈ complex 1, which is consistent with the increasing redox potential of these complexes. Additionally, complex 4 showed good consistency across different reactants, where several alternative substrates were investigated with both the boronic acid and the amine were examined (Figure 6.) The reactivity of complex 4 is affected when using benzimidazole or a substituted imidazole or boronic acid. However, no reactivity was observed for either 1,2 4, triazole or pyrrole, the cause of this is currently unknown but is being further explored.
Figure 6.
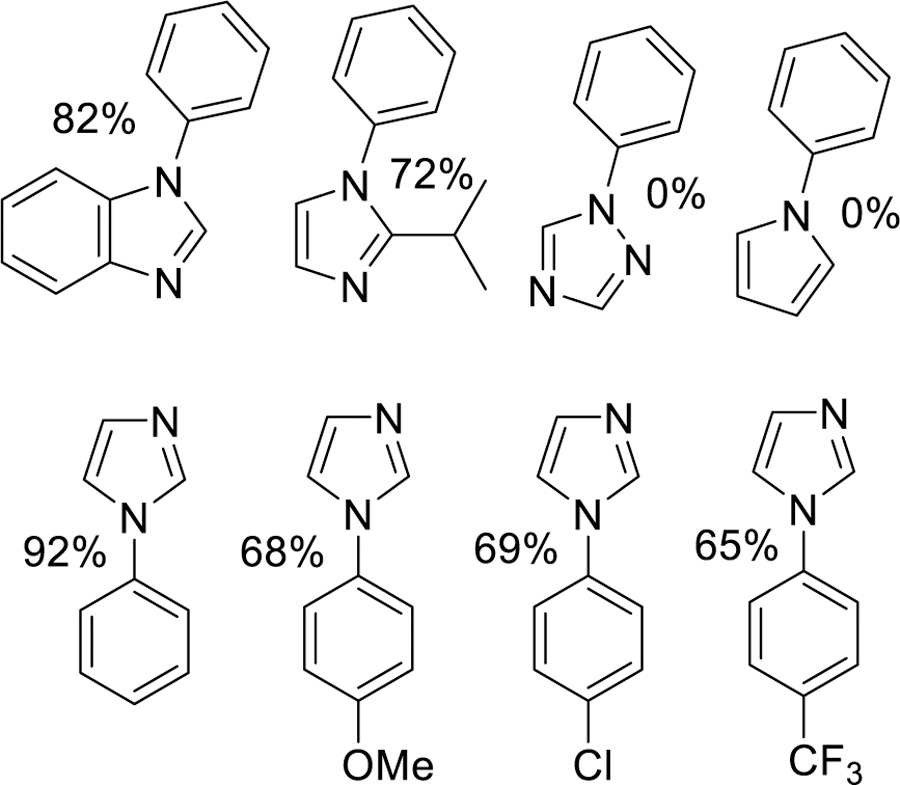
Substrate scope for Chan-Evans-Lam coupling of complex 4.
A series of copper complexes bound to phen and phen-derivatives have been synthesized and characterized. these new coordination complexes represent an air-stable option for copper-dependent organic transformations. The potential utility of these compounds was demonstrated using the CEL coupling reaction. In our hands, complex 4 performed well in supporting these copper-dependent C—N bond forming reactions under partially optimized conditions. Interestingly, complexes 1–4 all have similar visible and EPR spectra that suggest that the electronic states of the Cu2+ ions in these complexes are in similar ligand fields, yet all show some copper(I) content as well. Complexes 1–3 even share similar coordination geometries, where their X-ray structures show 5 coordinate Cu complexes with distorted square pyramidal to trigonal bipyramidal geometries. The [Cu(dafo)2]2+ complex, however, is structurally very different. Complex 4 was characterized in an octahedral coordination geometry with 2 solvent molecules in a trans orientation to each other. Interestingly the [Cu(dafo)2]2+ was also measured to have a uniquely high redox potential (+1.1 V v. NHE) compared to the other complexes described here that range from 265–343 mV v NHE for complexes 1–3, respectively. These potentials can easily be converted into ΔG using the relationship of ΔG = -nFE, where complexes 1–3 have ΔG associated with the one electron reduction to their Cu+ states of −6.1, −6.5, and −7.9 kcal/mol, respectively. The [Cu(dafo)2]2+ complex has a −26.9 kcal/mol ΔG associated with the reduction to its Cu+ species. One rational for this difference is that the structurally similar complexes 1–3 undergo dramatic reorganization upon reduction, which impacts the favorability of this process. The structurally distinctive [Cu(dafo)2]2+ complex must not require an impactful reorganization of the copper’s coordination geometry. This notion is partially supported by our DFT optimized structures for complexes 1–3 (c.f. the SI section), which show similar structure to the divalent X-ray crystallized complexes show in the literature and Figure 2.14 DFT optimized models of the related copper(I) complexes all show 4-coordinate, 18-electron copper(I) complexes with their copper(I) ions coordinated in distorted tetrahedral geometries. On the other hand, we had no success generating a DFT optimized model of the [Cu(dafo)2]2+ complex. By removing one of the axial ligands, this structure eventually converged to a structure consistent with complexes 1–3 as shown in Figure 5, but it remains to be seen if this model complex reflects the solution structure of these [Cu(dafo)2]2+ complexes. The reality is, at present it is unclear how the ligand architecture and coordination mode of these complexes impacts the Cu2+/+ redox potential in these complexes, but it is reasonably clear that the more oxidized (i.e. electron deficient) the phen derivative is the more it stabilizes the copper(I) oxidation state. The source of electrons that afford these copper(II) species to spontaneously reduce to their copper(I) states remains unclear. The most likely suspect capable of giving up electrons are the ligands themselves, but currently we have no specific proof supporting this notion.
Traditionally CEL coupling reactions are run with 50–150 mol% copper to achieve good yields of C—N coupled products.41–42 However the complexes reported here can catalyze CEL coupling reactions to generate similarly good yields, but with a fraction of the copper. These catalytic data are on par with reactivity reported for other N-donating copper complexes that have been reported.43 To date, Schaper’s catalysts for CEL coupling still show the best catalytic turnover, but have significantly different donor abiilities.44 However within the context of this work, it appears that the more electron deficient phen derivatives support the CEL coupling reaction better than those that are more electron rich, where complex 4 generated the highest yields for C—N bond forming reactions. At this time, we have no data that indicates how the electron deficient ligands to support this higher CEL reactivity. However, if we consider the most recent CEL mechanistic studies proposed by Watson,43 there appear to be several crucial steps that are highly depend on the oxidative power of the copper catalyst, where this oxidizing power is directly dependent on the reduction potentials associated with these complexes. We have adapted this mechanism to our work below, (Scheme 2) though further electrochemical and spectroscopic work is ongoing to help elucidate the validity of this mechanism on our system. The most obvious step that is redox dependent is the disproportionation of copper(II) into Cu+ and Cu3+ species (Scheme 2, reaction B.) In this case, the Cu2+/+ potential provides a wealth of energy that can be coupled to the generation of the catalytically important copper(III) species. Where we expect the Cu3+/2+ potential for these complexes to follow the same trend as the Cu2+/+ potentials measured above. This suggests the copper(III) species generated as 4 proceeds in the CEL reaction will be highly unstable leading to a rapid decay proceed through a reductive elimination to generate the C—N bond linked product (Scheme 2, reaction C.)
Scheme 2.
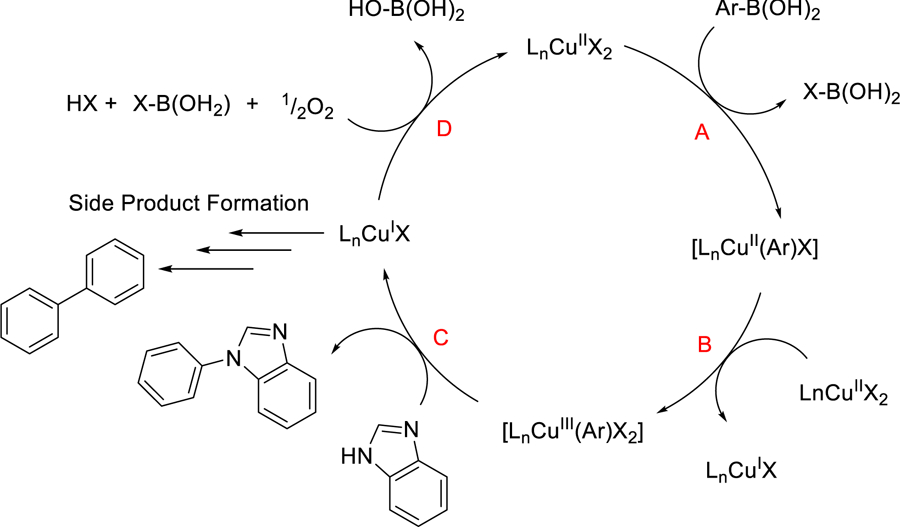
Suggested mechanism of catalyzed CEL coupling.
The increased stability of the resulting copper(I) state leads to increased formation of the phenolic based side products,45 which was also observed for complex 4 in this study. Alternately, these copper(I) species are thought to re-oxidized in air to generate the catalytically active starting copper(II) state (Scheme 2, reaction D), which implies that the redox potential associated with these Cu2+/+ have to be sufficiently low to react with dioxygen too. Alternatively, the Stahl group and others have used 4,5-diazafluoren-9-one (L4) as an ancillary ligand for many palladium-catalyzed reactions.46 Stahl has proposed that the geometric properties (or “bite angle”) of the 4,5-diazafluoren-9-one ligand helps support catalytic activity around the metal center,47 This geometric aspect could also enhanced catalytic activity of the copper(II)-dafo (4) complex for CEL coupling over the more prototypical copper-phen complexes 1, 2, and 3.)
Conclusion
It is our contention that there is a direct correlation between redox tuning of copper and the oxidized nature of the ligand geometric constraints that are key to developing better catalysts copper catalysts for CEL coupling. Currently, we are working to connect these individual steps in the CEL mechanism to the copper complexes and their reduction potentials.
Experimental
General Considerations
All solvents and reagents were obtained from commercial sources and were used as received. NMR spectra were obtained using a Bruker AVANCE III 500 MHz spectrometer at room temperature. 1H and 13C chemical shifts are reported vs TMS and are referenced to the residual solvent peaks. Mass spectra were obtained using a Bruker UHPLC microTOF-Q II High Resolution MS system operating in ESI ionization mode. Single crystal X-ray Crystallography was obtained using a Bruker Venture D8 with an IμS microfocus source. UV-Vis spectroscopy was obtained using an Olis14 UV/VIS/NIR Spectrophotometer.
Synthesis of [Cu(edhp)2(OH2)](OTf)2 (2).
Cu(OTf)2 (0.723g, 2 mmol) in a 100 mL RBF was treated with EtOH (25 mL) and stirred for 15 min to allow for complete dissolution. To this was added 5,6-epoxy-5,6-dihydro-[1,10]phenanthroline (0.728 g, 4 mmol) dissolved in EtOH (25 mL), causing an immediate color change and precipitation of 2 to occur. The mixture was for 18 hrs and filtered and the blue solid collected and dried under vacuum to yield 1.02 g (1.32 mmol, 66%). Crystals suitable for X-ray diffraction were grown via vapor diffusion of Et2O into an MeCN solution of 2. ESI–MS (m/z): observed, 455.0512 for [M – 2OTf]+; calcd, 455.0569 for [C24H16CuN4O2]+; 227.5249 for [M – 2OTf]2+; calcd, 227.5279 for [C24H16CuN4O2]2+ Elem. Anal. Calcd for C26H18CuF6N4O9S2: C, 40.45; H, 2.35; N, 7.26 Found C, 40.19; H 2.13; N, 7.93
Synthesis of [Cu(pdo)2(OH2)2][(OTf)2] (3).
Cu(OTf)2 (0.723 g, 2 mmol) in a 100 mL RBF was treated with EtOH (25 mL) and stirred for 15min to allow for complete dissolution. To this was added 1,10-Phenanthroline-5,6-dione (0.825 g, 4 mmol) dissolved in EtOH (12 mL), causing an immediate color change and precipitation of 3 to occur. The mixture was for 18 hrs and filtered and the blue solid collected and dried under vacuum. 1.18 g (1.44 mmol, 72%). Crystals suitable for x-ray diffraction were grown via vapor diffusion of hexanes into a chloroethanol solution of 3. ESI–MS (m/z): observed, 483.0126 for [M – 2OTf]+; calcd, 483.0144 for [C24H12CuN4O4]+; 241.5053 for [M – 2OTf]2+; calcd, 241.5072 for [C24H12CuN4O4]2+ Elem. Anal. Calcd for C26H16CuF6N4O12S2: 38.17; H, 1.97; N, 6.85 Found C, 38.07; H 1.89 N, 6.76
Synthesis of [Cu(dafo)2(OH2)2][(OTf)2] (4).
Cu(OTf)2 (0.173 g, 0.48 mmol) in a 100 mL RBF was treated with EtOH (12 mL) and stirred for 15min to allow for complete dissolution. To this was added 4,5-Diazafluoren-9-one (0.175 g, 0.96 mmol) dissolved in EtOH (12 mL), causing an immediate color change and precipitation of 4 to occur. The mixture was for 18 hrs and filtered and the blue solid collected and dried under vacuum. 0.272 g (0.36 mmol, 74%). Crystals suitable for x-ray diffraction were grown via vapor diffusion of Et2O into an MeCN solution of 4. ESI–MS (m/z): observed, 427.0215 for [M – 2OTf]+; calcd, 427.0245 for [C22H12CuN4O2]+; 213.5102 for [M – 2OTf]2+; calcd, 213.5123 for [C24H12CuN4O4]2+ Elem. Anal. Calcd for C24H16CuF6N4O10S2: C, 37.83; H, 2.12; N, 7.35 Found C, 37.18; H 2.00 N, 7.02
General procedure for copper catalysed coupling.
A 4 mL scintillation vial with a magnetic stirring bar was charged with imidazole (0.1 mmol), boronic acid (0.2 mmol), and copper complex (8 mol%). Methanol (0.5 mL) was added and stirred for the desired time and temperature. Once reaction was completed, water was added (0.5 mL) and the aqueous layer was extracted. This was repeated and the organic layer was dried with Na2SO4, filtered, and concentrated.
Electrochemistry
All electrochemical measurements were performed on Solartron SI1287 potentiostat. The supporting electrolyte was 0.1 M tetraethylammounium hexafluorophosphate (TEAPF6) in acetonitrile (MeCN) as the solvent. The working electrode was a 3 mm glassy carbon disk with platinum wire counter and Ag/Ag+ ion reference. The analyte concentrations were 1 mM and all solutions were maintained oxygen free by degassing in Argon for 15 minutes before measuring the current response. All potentials were converted to NHE based on the conversion: ENHE = EAg/Ag+ + 0.54V.
EPR
X-band EPR spectra were recorded on a Bruker ELEXSYS spectrometer equipped with an Oxford ESR-910 liquid helium cryostat. The quantification of all signals was relative to a Cu2+-EDTA spin standard prepared from a copper atomic absorption standard (Sigma-Aldrich). The microwave frequency was calibrated with a frequency counter and the magnetic field with a gaussmeter. The sample temperature was calibrated with a cernox sensor (Lakeshore CX-1050) mounted inside an EPR tube. The modulation amplitude and frequency were 1 mT and 100 kHz for all spectra. Species concentrations were determined with the software SpinCount developed by M. P. Hendrich.13
Supplementary Material
Acknowledgement
This research was supported by NIH R01 GM077387 (M.P.H.), with funding for the EPR spectrometer supported by the National Science Foundation (NSF CHE1126268). The authors are grateful to Mr. Bruno Donnadieu for his assistance with X-ray crystallography data analysis.
Footnotes
Accession Codes
CCDC 1952035 – 1952037 contain the supplementary crystallographic data for this paper. These data can be obtained free of charge via www.ccdc.cam.ac.uk/data_request/ cif, or by emailing data_request@ccdc.cam.ac.uk, or by contacting The Cambridge Crystallographic Data Centre, 12 Union Road, Cambridge CB2 1EZ, UK; fax: +44 1223 336033.
References
- 1.(a) Beletskaya IP; Cheprakov AV, Coord. Chem. Rev 2004, 248 (21–24), 2337–2364; [Google Scholar]; (b) Monnier F; Taillefer M, Angew. Chem. Int. Ed 2009, 48 (38), 6954–6971. [DOI] [PubMed] [Google Scholar]
- 2.Thapa S; Shrestha B; Gurung SK; Giri R, Org. Biomol. Chem 2015, 13 (17), 4816–4827. [DOI] [PubMed] [Google Scholar]
- 3.Beaumier EP; Pearce AJ; See XY; Tonks IA, Nat. Rev. Chem 2019, 3 (1), 15–34. [DOI] [PMC free article] [PubMed] [Google Scholar]
- 4.(a) Brandt WW; Dwyer FP; Gyarfas ED, Chem. Rev 1954, 54 (6), 959–1017; [Google Scholar]; (b) Sammes PG; Yahioglu G, Chem. Soc. Rev 1994, 23 (5), 327–334. [Google Scholar]
- 5.Lin Y; Cai M; Fang Z; Zhao H, RSC Advances 2016, 6 (88), 85186–85193. [Google Scholar]
- 6.Kirai N; Yamamoto Y, Eur. J. Org. Chem 2009, 2009, 1864. [Google Scholar]
- 7.(a) Furst A; Landefeld S; Hill MG; Barton JK, J. Am. Chem. Soc 2013, 135 (51), 19099–19102; [DOI] [PMC free article] [PubMed] [Google Scholar]; (b) Babu R; Bhargavi G; Rajasekharan MV, Eur. J. Inorg. Chem 2017, 2017 (14), 2155–2162. [Google Scholar]
- 8.(a) Xu G-J; Kou Y-Y; Feng L; Yan S-P; Liao D-Z; Jiang Z-H; Cheng P, Appl. Organomet. Chem 2006, 20 (5), 351–356; [Google Scholar]; (b) Kulkarni P; Padhye S; Sinn E, Inorg. Chim. Acta 2001, 321 (1), 193–199. [Google Scholar]
- 9.Saravani H; Rezvani AR; Mansouri G; Salehi Rad AR; Khavasi HR; Hadadzadeh H, Inorg. Chim. Acta 2007, 360 (8), 2829–2834. [Google Scholar]
- 10.Shee NK; Das D; Oluwafunmilayo Adekunle FA; Drew MGB; Datta D, Inorg. Chim. Acta 2011, 366 (1), 198–202. [Google Scholar]
- 11.Pivetta T; Trudu F; Valletta E; Isaia F; Castellano C; Demartin F; Tuveri R; Vascellari S; Pani A, J. Inorg. Biochem 2014, 141, 103–113. [DOI] [PubMed] [Google Scholar]
- 12.Das O; Paine TK, Dalton Trans 2012, 41 (37), 11476–11481. [DOI] [PubMed] [Google Scholar]
- 13.Petasis DT; Hendrich MP, Chapter Eight - Quantitative Interpretation of Multifrequency Multimode EPR Spectra of Metal Containing Proteins, Enzymes, and Biomimetic Complexes. In Methods Enzymol, Qin PZ; Warncke K, Eds. Academic Press: 2015; Vol. 563, pp 171–208. [DOI] [PMC free article] [PubMed] [Google Scholar]
- 14.Valle HU; Riley KM; Russell DE; Wolgemuth DK; Voges-Haupt CF; Rogers TA; Redd SL; Stokes SL; Emerson JP, ChemistrySelect 2018, 3 (18), 5143–5146. [Google Scholar]
- 15.Bencini A; Lippolis V, Coord. Chem. Rev 2010, 254 (17), 2096–2180. [Google Scholar]
- 16.Dixon EN; Snow MZ; Bon JL; Whitehurst AM; DeGraff BA; Trindle C; Demas JN, Inorg. Chem 2012, 51 (6), 3355–3365. [DOI] [PubMed] [Google Scholar]
- 17.Wendlandt AE; Stahl SS, J. Am. Chem. Soc 2014, 136 (1), 506–512. [DOI] [PMC free article] [PubMed] [Google Scholar]
- 18.Jäger S; Gude L; Arias-Pérez M-S, Bioorg. Chem 2018, 81, 405–413. [DOI] [PubMed] [Google Scholar]
- 19.Carugo O; Castellani CB, J. Chem. Soc., Dalton Trans 1990, (9), 2895–2902. [Google Scholar]
- 20.Catalan KJ; Jackson S; Zubkowski JD; Perry DL; Valente EJ; Feliu LA; Polanco A, Polyhedron 1995, 14 (15), 2165–2171. [Google Scholar]
- 21.Melnic E; Coropceanu EB; Kulikova OV; Siminel AV; Anderson D; Rivera-Jacquez HJ; Masunov AE; Fonari MS; Kravtsov VC, The Journal of Physical Chemistry C 2014, 118 (51), 30087–30100. [Google Scholar]
- 22.Mella P; Cabezas K; Cerda C; Cepeda-Plaza M; Günther G; Pizarro N; Vega A, New J. Chem 2016, 40 (7), 6451–6459. [Google Scholar]
- 23.Yamada Y; Sakurai H; Miyashita Y; Fujisawa K; Okamoto K.-i., Polyhedron 2002, 21 (21), 2143–2147. [Google Scholar]
- 24.Menon S; Rajasekharan MV, Polyhedron 1998, 17 (15), 2463–2476. [Google Scholar]
- 25.Balagopalakrishna C; Rajasekharan MV; Bott S; Atwood JL; Ramakrishna BL, Inorg. Chem 1992, 31 (13), 2843–2846. [Google Scholar]
- 26.Lu Z.-l.; Duan C.-y.; Tian Y.-p.; You X.-z.; Huang X.-y., Inorg. Chem 1996, 35 (8), 2253–2258. [DOI] [PubMed] [Google Scholar]
- 27.(a) James BR; Williams RJP, Journal of the Chemical Society (Resumed) 1961, (0), 2007–2019; [Google Scholar]; (b) Moore GR; Williams RJP, Coordination Chemistry Reviews 1976, 18 (1), 125–197; [Google Scholar]; (c) Azevedo F; Carrondo M. A. A. F. d. C. T.; de Castro B; Convery M; Domingues D; Freire C; Duarte MT; Nielsen K; Santos IC, Inorganica Chimica Acta 1994, 219 (1), 43–54; [Google Scholar]; (d) Beattie JK, Dynamics of Spin Equilibria in Metal Complexes. In Advances in Inorganic Chemistry, Sykes AG, Ed. Academic Press: 1988; Vol. 32, pp 1–53. [Google Scholar]
- 28.C. N. Authors: Piero Zanello, Fabrizia Fabrizi de Biani, Inorganic Electrochemistry: Theory, Practice and Application: Edition 2. 2003; p X001–X004.
- 29.(a) Wong C-Y; Chan MCW; Zhu N; Che C-M, Organometallics 2004, 23 (10), 2263–2272; [Google Scholar]; (b) Draper SM; Gregg DJ; Schofield ER; Browne WR; Duati M; Vos JG; Passaniti P, Journal of the American Chemical Society 2004, 126 (28), 8694–8701. [DOI] [PubMed] [Google Scholar]
- 30.Mukherjee R, 6.6 - Copper. In Comprehensive Coordination Chemistry II, McCleverty JA; Meyer TJ, Eds. Pergamon: Oxford, 2003; pp 747–910. [Google Scholar]
- 31.Bard A; Faulkner LR, Electrochemical Methods. Fundamentals and Applications. 2001.
- 32.Kulkarni P; Padhye S; Sinn E; Anson CE; Powell AK, Inorg. Chim. Acta 2002, 332 (1), 167–175. [Google Scholar]
- 33.Morehouse SM; Suliman H; Haff J; Nguyen D, Inorg. Chim. Acta 2000, 297 (1), 411–416. [Google Scholar]
- 34.John RP; Sreekanth A; Rajakannan V; Ajith TA; Kurup MRP, Polyhedron 2004, 23 (16), 2549–2559. [Google Scholar]
- 35.Goss CA; Abruna HD, Inorg. Chem 1985, 24 (25), 4263–4267. [Google Scholar]
- 36.(a) Hemming D; Fritzemeier R; Westcott SA; Santos WL; Steel PG, Chem. Soc. Rev 2018, 47 (19), 7477–7494; [DOI] [PubMed] [Google Scholar]; (b) Verma A; Santos WL, Copper-Catalyzed Coupling Reactions of Organoboron Compounds. In Boron Reagents in Synthesis, American Chemical Society: 2016; Vol. 1236, pp 313–356. [Google Scholar]
- 37.Hardouin Duparc V; Bano GL; Schaper F, ACS Catal 2018, 8 (8), 7308–7325. [Google Scholar]
- 38.Jia X; Peng P, Org. Biomol. Chem 2018, 16 (46), 8984–8988. [DOI] [PubMed] [Google Scholar]
- 39.Lan J-B; Chen L; Yu X-Q; You J-S; Xie R-G, Chem. Commun 2004, (2), 188–189. [DOI] [PubMed] [Google Scholar]
- 40.King AE; Brunold TC; Stahl SS, J. Am. Chem. Soc 2009, 131 (14), 5044–5045. [DOI] [PubMed] [Google Scholar]
- 41.Lan JB; Chen L; Yu XQ; You JS; Xie RG, Chem. Commun (Cambridge, U. K.) 2004, 188. [DOI] [PubMed] [Google Scholar]
- 42.Lam PYS; Clark CG; Saubern S; Adams J; Winters MP; Chan DMT; Combs A, Tetrahedron Lett 1998, 39, 2941. [Google Scholar]
- 43.(a) Collman JP; Zhong M; Zhang C; Costanzo S, The Journal of Organic Chemistry 2001, 66 (23), 7892–7897; [DOI] [PubMed] [Google Scholar]; (b) Collman JP; Zhong M, Org. Lett 2000, 2, 1233; [DOI] [PubMed] [Google Scholar]; (c) Vantourout JC; Miras HN; Isidro-Llobet A; Sproules S; Watson AJB, J. Am. Chem. Soc 2017, 139 (13), 4769–4779. [DOI] [PubMed] [Google Scholar]
- 44.(a) Hardouin Duparc V; Schaper F, Organometallics 2017, 36, 3053; [Google Scholar]; (b) Hardouin Duparc V; Schaper F, Dalton Trans 2017, 46, 12766. [DOI] [PubMed] [Google Scholar]
- 45.Vantourout JC; Miras HN; Isidro-Llobet A; Sproules S; Watson AJB, J. Am. Chem. Soc 2017, 139, 4769. [DOI] [PubMed] [Google Scholar]
- 46.(a) Kozack CV; Sowin JA; Jaworski JN; Iosub AV; Stahl SS, ChemSusChem 2019, 12 (13), 3003–3007; [DOI] [PMC free article] [PubMed] [Google Scholar]; (b) Zheng Y.-l.; Xiao L; Xie Q; Shao L.-m., Synthesis 2019, 51 (06), 1455–1465; [Google Scholar]; (c) Jaworski JN; Kozack CV; Tereniak SJ; Knapp SMM; Landis CR; Miller JT; Stahl SS, J. Am. Chem. Soc 2019, 141 (26), 10462–10474. [DOI] [PMC free article] [PubMed] [Google Scholar]
- 47.Campbell AN; White PB; Guzei IA; Stahl SS, J. Am. Chem. Soc 2010, 132 (43), 15116–15119. [DOI] [PMC free article] [PubMed] [Google Scholar]
Associated Data
This section collects any data citations, data availability statements, or supplementary materials included in this article.


