Abstract
Pharmacologic inhibitors of cyclin-dependent kinases 4 and 6 (CDK4/6) were designed to induce cancer cell cycle arrest. Recent studies have suggested that these agents also exert other effects, influencing cancer cell immunogenicity, apoptotic responses, and differentiation. Using cell-based and mouse models of breast cancer together with clinical specimens, we show that CDK4/6 inhibitors induce remodeling of cancer cell chromatin characterized by widespread enhancer activation, and that this explains many of these effects. The newly activated enhancers include classical super-enhancers that drive luminal differentiation and apoptotic evasion, as well as a set of enhancers overlying endogenous retroviral elements that is enriched for proximity to interferon-driven genes. Mechanistically, CDK4/6 inhibition increases the level of several Activator Protein-1 (AP-1) transcription factor proteins, which are in turn implicated in the activity of many of the new enhancers. Our findings offer insights into CDK4/6 pathway biology and should inform the future development of CDK4/6 inhibitors.
Introduction
Pharmacologic inhibitors of cyclin-dependent kinases 4 and 6 (CDK4/6) have had a major impact on oncology practice1. They are prescribed routinely for the treatment of estrogen-receptor positive breast cancer, and trials to determine their activity against several other cancer types are ongoing2. CDKs 4 and 6 mediate cellular transition from the G1 to the S phase of the cell cycle, and CDK4/6 inhibitors induce G1 cell cycle arrest in tumor cells3. They might also trigger other phenotypes in cancer cells including enhanced immunogenicity, apoptotic evasion, histologic tumor differentiation, and increased dependency on receptor tyrosine kinase signaling4–8. These effects are clinically meaningful but remain both poorly characterized and poorly understood.
CDK4/6 inhibitors also induce certain features of senescence in cancer cells, including cytoplasmic enlargement and increased β-galactosidase activity9,10. This is likely because they enforce activation of the retinoblastoma tumor suppressor (RB), an important mediator of the cellular senescence program11. Notwithstanding this, classical senescence and CDK4/6 inhibitor-induced “senescence” are not the same: first, CDK4/6 inhibitor treatment activates RB, whereas classical senescence is triggered by a DNA damage response that leads to RB activation but also accumulation of p5312,13; second, the effects of CDK4/6 inhibitors are germane to cancer cells, fundamentally different from the healthy fibroblasts that are commonly used to study senescence. Indeed, the extent to which CDK4/6 inhibition in cancer recapitulates all the hallmarks of classical senescence remains unclear.
In healthy cells, senescence triggered by a DNA damage response is associated with profound changes in the cellular enhancer landscape14,15. Presently, we do not understand the mechanisms behind this phenomenon, or whether it is also found in CDK4/6 inhibitor-treated cancer cells. Indeed, the effect of these agents on chromatin biology more generally has not been explored. In this study, we define the effects of CDK4/6 inhibition on chromatin architecture in breast cancer and show that remodeling of the cancer cell epigenome underlies several biological effects of these agents.
Results
CDK4/6 inhibition induces chromatin remodeling
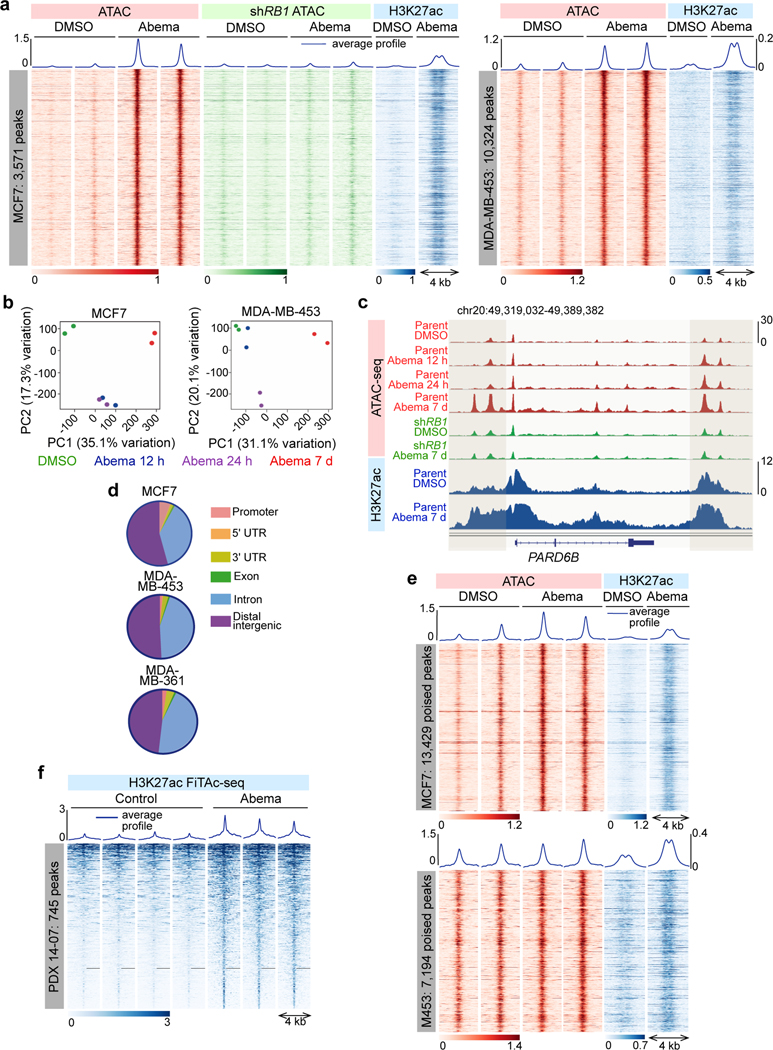
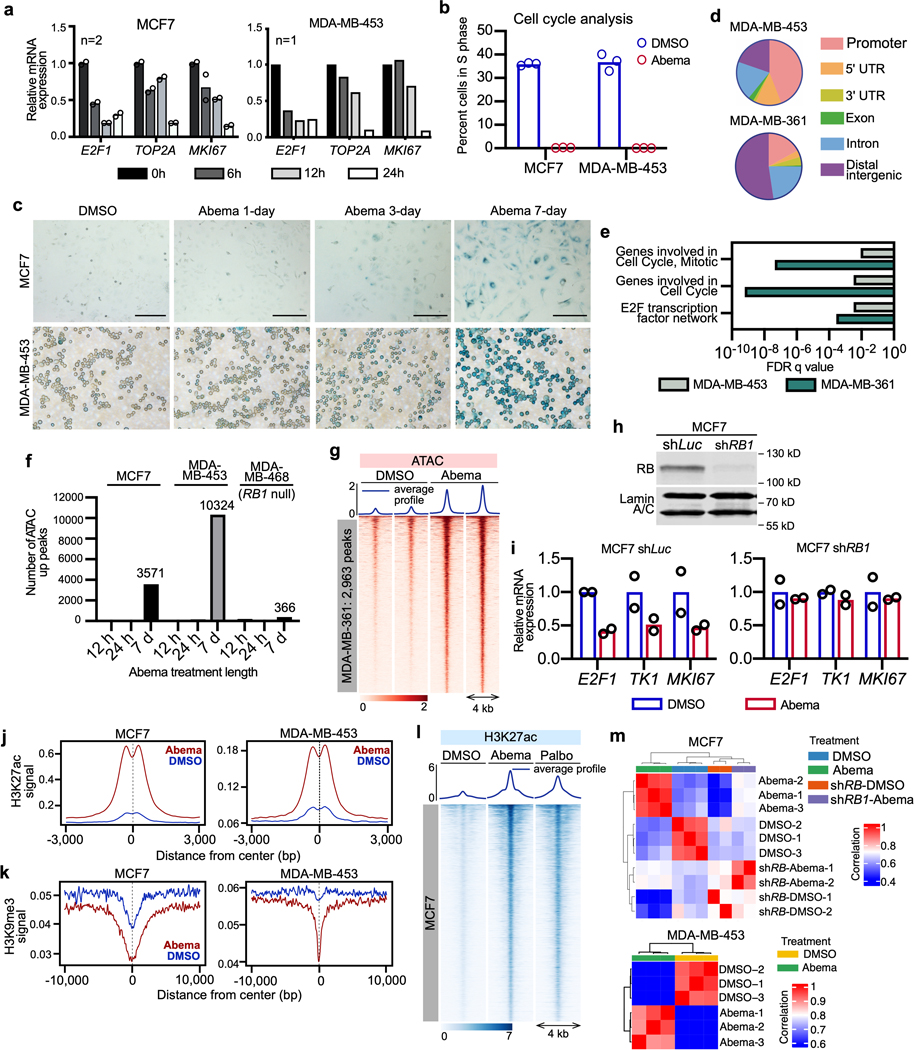
To determine the impact of CDK4/6 inhibitors on the breast cancer epigenome, we treated several RB1 wild-type, luminal breast cancer cell lines with DMSO control or the CDK4/6 inhibitor abemaciclib and measured genome-wide alterations in chromatin accessibility using an assay for transposase-accessible chromatin with high-throughput sequencing (ATAC-seq)16. We treated MCF7 and MDA-MB-453 cells for 12 or 24 hours, when E2F target gene downregulation and G1 arrest become evident, or for 7 days, when morphologic changes of senescence are readily apparent (Extended Data Figs. 1a–′c). Abemaciclib induced widespread chromatin remodeling, evidenced by new regions of both significantly increased (“up-peaks”) and decreased (“down-peaks”) chromatin accessibility (Fig. 1a and Extended Data Fig. 1). Notably, this remodeling occurred in two temporal phases, with principal components analysis (PCA) demonstrating distinct chromatin accessibility profiles at 12–24 hours when compared to 7 days (Fig. 1b). Down-peaks were observed at both early (12–24 hours) and later (7 days) timepoints, and were enriched for distribution over gene promoters regulating progression through G1 (Extended Data Figs. 1d, e)17. This is consistent with creation of a repressive chromatin environment at E2F target gene promoters and confirms that CDK4/6 inhibitors can recapitulate this previously described function of RB18. Given that this finding reflected an expected and well-characterized effect of CDK4/6 inhibitors (cell cycle arrest), we focused the rest of our studies on the regions of increased chromatin accessibility.
Fig. 1 |. CDK4/6 inhibition induces chromatin remodeling in breast cancer.
a, ATAC- and ChIP-seq heatmaps for regions with significantly increased ATAC-seq peak signal (up peaks) after 7 days of abemaciclib treatment in MCF7 (left) and MDA-MB-453 (right), determined by a threshold of adjusted P<0.05 calculated by DESeq2. Abemaciclib concentration used in vitro was 500 nM for all experiments unless otherwise noted. ATAC in red (parental cells) and green (cells expressing shRNA against RB1; shRB1); H3K27ac signals in the same genomic regions in parental cells are shown in blue.
b, Principal component analysis of ATAC-seq peaks in cells after treatment with DMSO or abemaciclib for the indicated times.
c, ATAC-seq and H3K27ac ChIP-seq tracks at the PARD6B locus in MCF7 parental and MCF7 shRB1 cells treated with DMSO or abemaciclib for 12 hours, 24 hours, or 7 days. Grey shading highlights regions where treatment-induced increases in ATAC-seq signal are seen in parental but not shRB1 cells.
d, Genomic distribution of regions showing significantly increased ATAC-seq signal from a and Extended Data Fig. 1g.
e, ATAC-seq and H3K27ac ChIP-seq heatmaps for regions with new H3K27ac peaks but no significant increase in ATAC-seq signal (“poised” enhancers) after abemaciclib treatment.
f, Heatmap depicting regions gaining H3K27ac (FiTAc-seq) in PDX 14–07 tumors treated with control or abemaciclib.
Importantly, the overwhelming majority of ATAC up-peaks were most readily apparent after 7 days of abemaciclib treatment (Extended Data Fig. 1f). At this late timepoint, we observed 3,571, 10,324, and 2,963 differential up-peaks in MCF7, MDA-MB-453, and MDA-MB-361 cells respectively as determined by adjusted P<0.05 (Fig. 1a and Extended Data Fig. 1g). Critically, the creation of these new regions of chromatin accessibility was an on-target effect of abemaciclib, since they were not seen in the MCF7 cells expressing an shRNA against RB1 or in the RB1 null cell line MDA-MB-468 (Figs. 1a, c and Extended Data Figs. 1f, h, i). In contrast to the down-peaks, very few up-peaks were situated over promoters (between 1–3 percent), and the vast majority were located within distal intergenic regions or introns, suggesting that they might represent newly activated enhancers (Fig. 1d). Supporting this notion, chromatin immunoprecipitation with next generation sequencing (ChIP-seq) revealed that regions defined by ATAC up-peaks showed increased H3K27 acetylation, a mark of active enhancers, and reduced H3K9 trimethylation, a repressive chromatin mark (Figs. 1a, c and Extended Data Figs. 1j, k). Notably, H3K27ac ChIP-seq analysis revealed that in addition to the gains overlapping with ATAC up-peaks, CDK4/6 inhibition also increased H3K27 acetylation over a separate set of enhancers that were already accessible and “poised” for activation, evidenced by accessible chromatin on ATAC-seq even prior to abemaciclib administration (Fig. 1e). In total, MCF7 and MDA-MB-453 cells showed 29,089 and 14,566 new H3K27ac peaks after 7 days of abemaciclib treatment, suggesting that prolonged CDK4/6 inhibition induces significant remodeling of the enhancer landscape in breast cancer cells. Importantly, similar results were observed after treatment with palbociclib, a different CDK4/6 inhibitor (Extended Data Fig. 1l). To determine whether a similar phenomenon can take place in vivo, we assessed how CDK4/6 inhibition changes H3K27 acetylation in a patient-derived xenograft (PDX) model of luminal breast cancer using FiTAc-seq (fixed-tissue chromatin immunoprecipitation sequencing for H3K27ac profiling)19,20. Abemaciclib treatment again induced marked gains in H3K27ac (Fig. 1f).
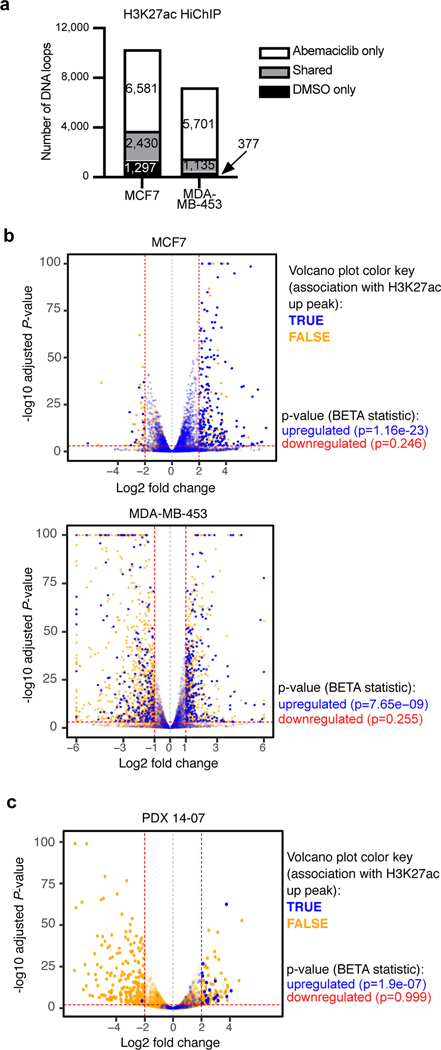
To gain stronger evidence that the changes observed on ATAC-seq and ChIP-seq reflected a global change in chromatin state, we quantified the number of H3K27ac-decorated enhancer-promoter loops in MCF7 and MDA-MB-453 cells using HiChIP21. We detected 6,581 and 5,701 genomic loops decorated with the H3K27ac mark that were unique to abemaciclib-treated cells in these two cell lines, respectively (Fig. 2a).
Fig. 2 |. CDK4/6 inhibitor-activated enhancers are predicted to be functional.
a, Numbers of DNA loops identified by H3K27ac HiChIP in cells treated with DMSO or abemaciclib for 7 days (loops called using adjusted P<0.01).
b,c, Association between abemaciclib-induced H3K27ac up-peaks and gene expression in cell lines treated with DMSO or abemaciclib (b) and in PDX 14–07 tumors treated with control or abemaciclib (c). Volcano plots depict RNA-seq log2 fold change and adjusted P-value calculated by DESeq2. Each dot represents one gene: blue indicates association with H3K27ac up-peak and orange indicates no association, as reported by the Binding and Expression Target Analysis (BETA). P-values below plots denote the significance of associations relative to background as calculated by BETA.
We next sought to assess whether enhancers putatively activated by CDK4/6 inhibitors are associated with expression of nearby genes. To this end, we performed transcriptomic profiling of MCF7 and MDA-MB-453 cells (Extended Data Fig. 1m) and PDX tumor tissue treated with control or abemaciclib, and then quantified the potential that any given gene is regulated by nearby H3K27ac up-peaks based on an aggregate quantification of all peaks within 100 kb of the gene’s transcriptional start site (TSS) (Binding and Expression Target Analysis [BETA])22. In all models, H3K27ac up-peaks were strongly associated with genes showing upregulated (but not downregulated) expression, consistent with these newly activated enhancers being functional (Figs. 2b, c).
CDK4/6 inhibition activates super-enhancers governing luminal differentiation
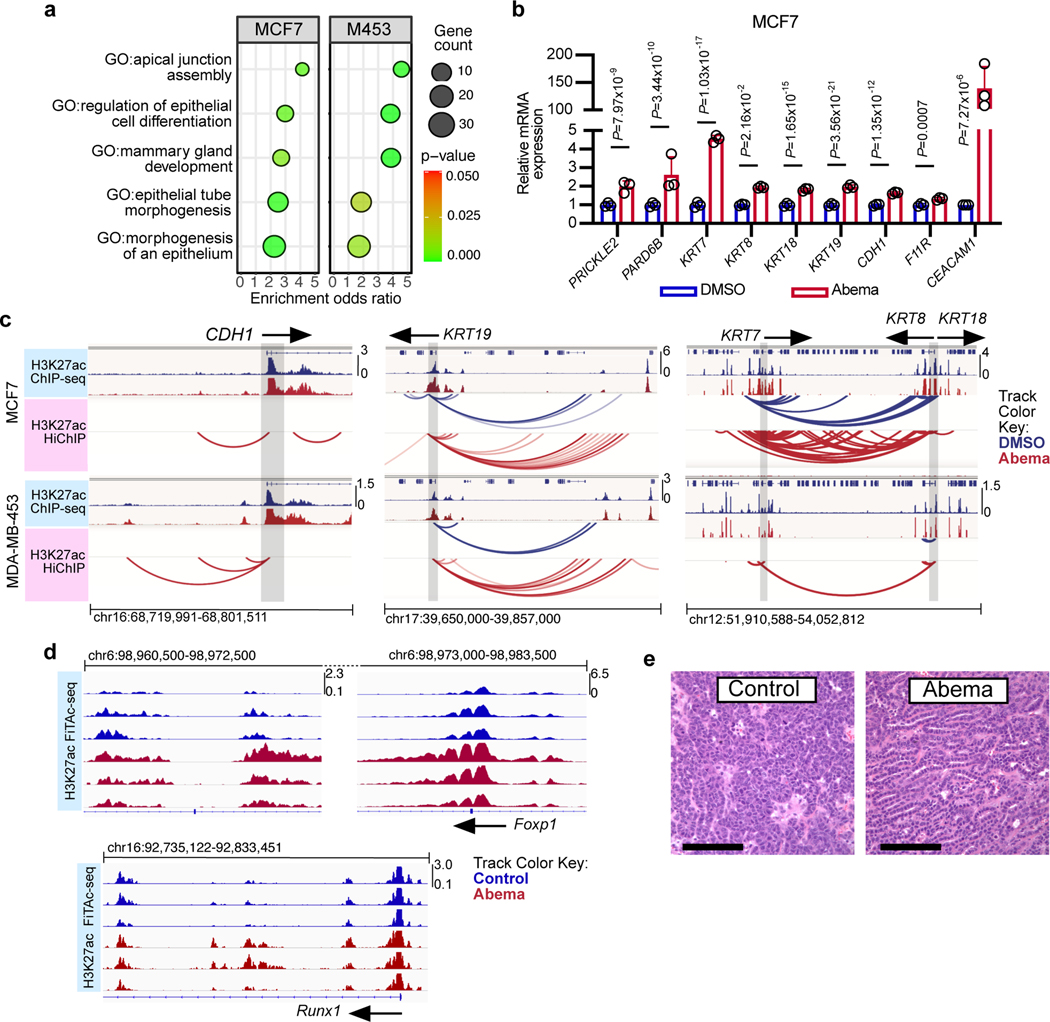
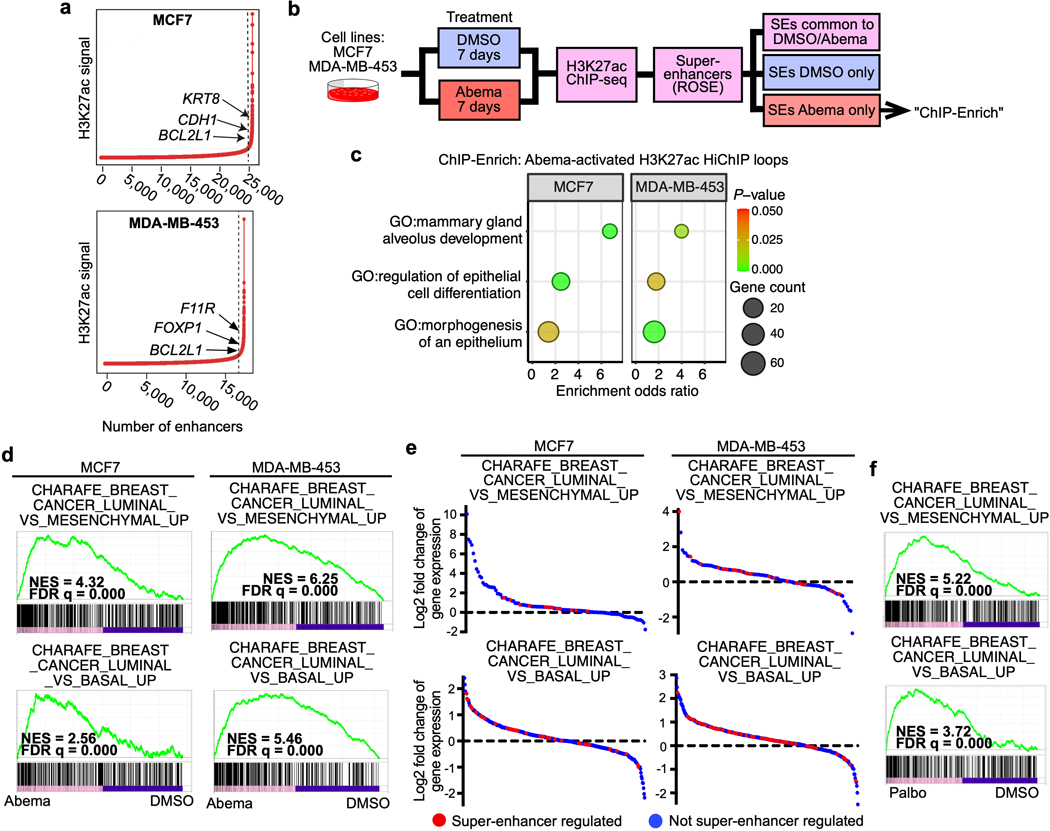
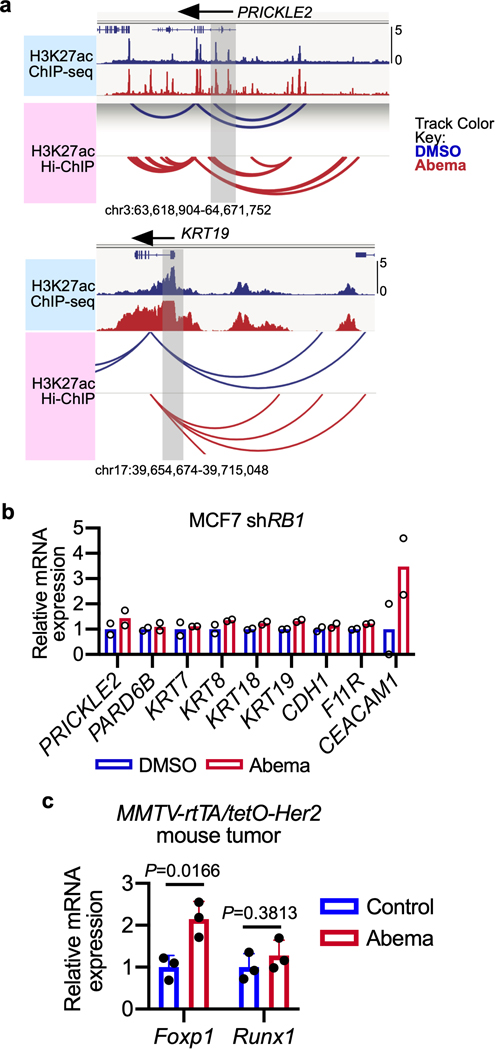
To understand the biological significance of CDK4/6 inhibitor-activated enhancers, we first classified them as either typical enhancers or “super-enhancers” (SEs), the latter being notable for their larger size, higher transcription factor density, and greater capacity to activate transcription23,24. We discovered 448 SEs in MCF7 and 186 SEs in MDA-MB-453 that showed marked increases in H3K27 acetylation after abemaciclib treatment (Extended Data Fig. 2a). We then applied gene set enrichment analysis (GSEA) to these SE regions (“ChIP-Enrich”, Extended Data Fig. 2b)25 to identify the biological processes that they might regulate, and also performed a similar analysis on all non-TSS associated ends of H3K27ac decorated loops identified by HiChIP. Strikingly, this analysis uncovered a specific set of biologic processes common to both cell lines, dominated by Gene Ontology (GO) terms pertaining to development and differentiation of mammary epithelial tissue (e.g. mammary gland development, epithelial cell differentiation, apical-basal polarity, maintenance of intercellular junctions) (Fig. 3a, Extended Data Fig. 2c, and Supplementary Tables 1 and 2). This prediction was supported by RNA-sequencing analyses, which showed upregulation of gene signatures indicative of luminal differentiation of breast cancer cells (Extended Data Figs. 2d, e). Notably, these signatures were also upregulated after palbociclib treatment (Extended Data Fig. 2f). Specific examples of genes activated by these SEs included those encoding critical regulators of epithelial cell polarity (e.g. PRICKLE2, PARD6B), structural filaments indicative of a mature luminal cell phenotype (KRT7, KRT8, KRT18, KRT19), and cell-cell adhesion molecules that enforce epithelial integrity (e.g. CDH1, F11R, CEACAM1) (Supplementary Table 3). This activation was evidenced by gains in H3K27ac at SEs and upregulation of adjacent gene expression, the latter of which was also confirmed to be RB-dependent. We also identified new H3K27ac-decorated promoter-enhancer loops in regions in and around these genes (Figs. 1c, 3b, c and Extended Data Figs. 3a, b).
Fig. 3 |. CDK4/6 inhibitor-activated enhancers promote luminal differentiation.
a, ChIP-Enrich analysis of super-enhancers gaining H3K27ac after 7 days of abemaciclib treatment in MCF7 and MDA-MB-453 cells.
b, Relative RNA-seq normalized reads of luminal differentiation-related genes in MCF7 cells treated with DMSO or abemaciclib (n=3 independent cultures). Means ± standard deviation (s.d.) are shown. Adjusted P values were determined by DESeq2.
c, Representative H3K27ac ChIP-seq tracks, aligned with H3K27ac-decorated genomic loops identified by HiChIP, in cells treated with DMSO or abemaciclib. Gene promoters are highlighted in grey.
d, Representative H3K27ac FiTAc-seq tracks in MMTV-rtTA/tetO-Her2 tumors treated with control or abemaciclib.
e, Representative hematoxylin and eosin (H&E) staining of tumors in d, from two independent experiments. Scale bars represent 200 μm.
We next investigated whether CDK4/6 inhibitor-activated enhancers might promote luminal differentiation in two in vivo models by analysis of the FiTAc-seq data. ChIP-Enrich analysis showed significant upregulation of several terms related to mammary epithelial differentiation in both our PDX model and in murine MMTV-rtTA/tetO-HER2 transgenic mammary carcinomas treated with abemaciclib (Supplementary Table 4)4. In the transgenic model, abemaciclib increased H3K27ac over putative enhancers adjacent to genes that promote mammary epithelial differentiation and ductal morphogenesis (e.g. Foxp1, Runx1)26,27 and also induced striking mammary tubule formation in these tumors, indicative of a more differentiated state (Figs. 3d, e and Extended Data Fig. 3c).
CDK4/6 inhibition activates a super-enhancer driving apoptotic evasion
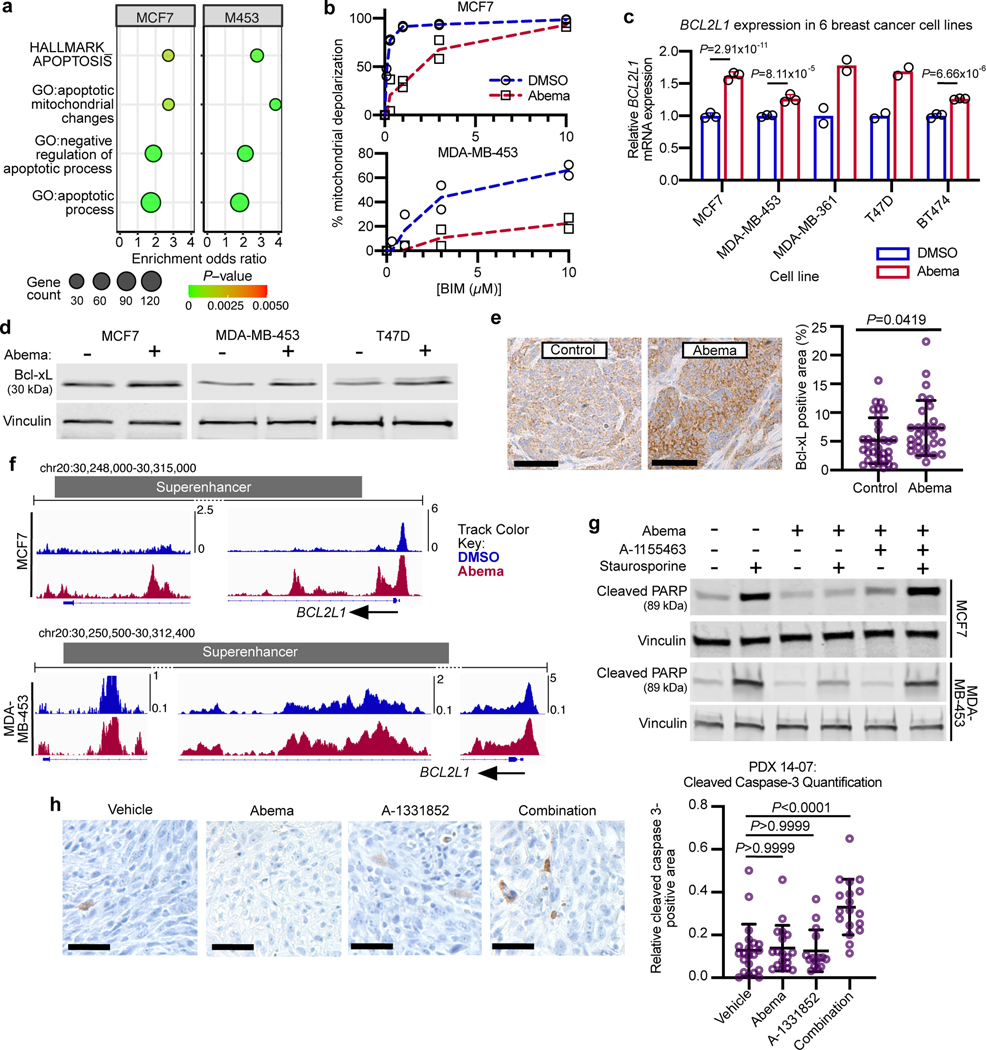
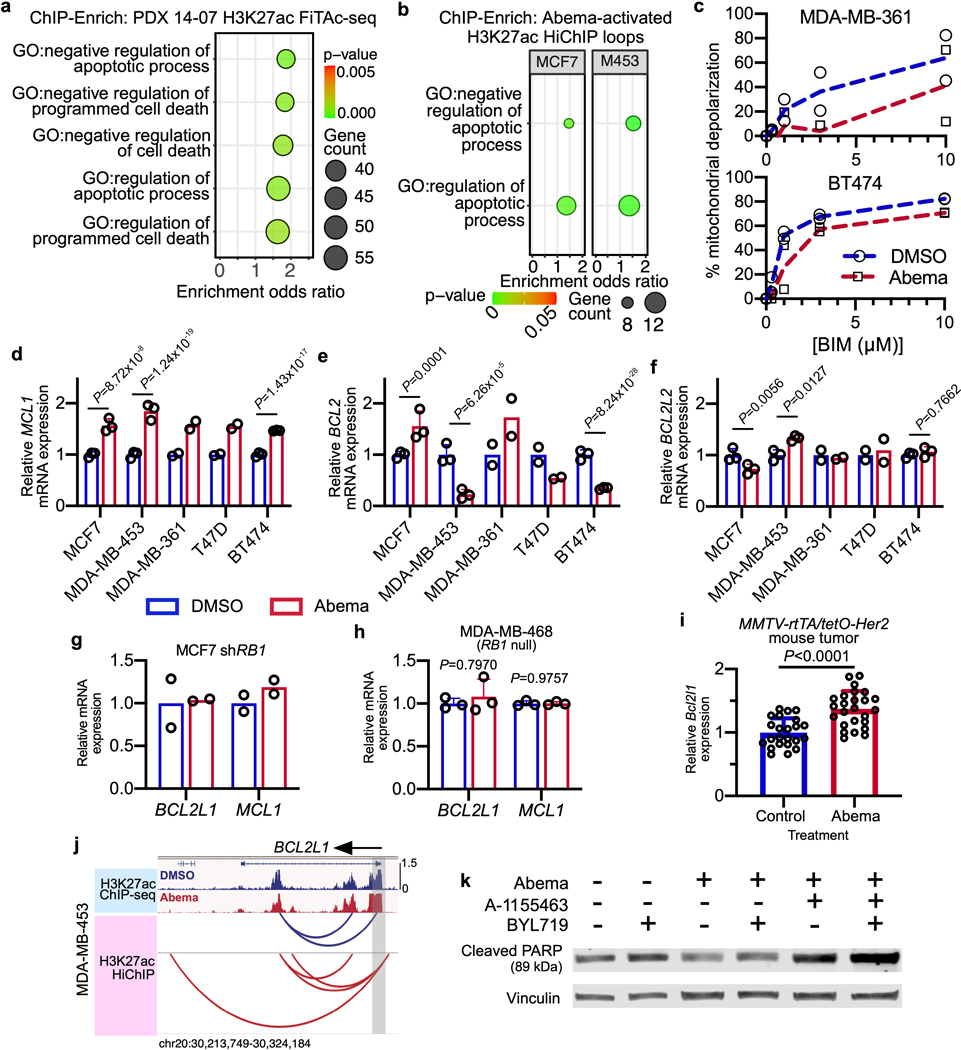
Our analysis also suggested that CDK4/6 inhibitor-activated SEs may influence tumor cell apoptosis, as the genes near SE-associated H3K27ac up peaks were strongly enriched for the term “HALLMARK_APOPTOSIS” in both MCF7 and MDA-MB-453 cells (Fig. 4a). Additional enriched terms in cell lines and the PDX model suggested that activated SEs might specifically control transcriptional programs that negatively regulate the intrinsic apoptotic pathway in cancer cells (Fig. 4a, Extended Data Figs. 4a, b and Supplementary Tables 1, 2, and 4). These observations were notable because (i) we have previously reported that CDK4/6 inhibitors impair breast cancer cell apoptotic responses6, and (ii) apoptotic evasion, a hallmark of cancer, can be driven by SEs more generally28. To functionally validate this finding, we treated four luminal breast cancer cell lines (MCF7, MDA-MB-453, MDA-MB-361, BT474) with DMSO or abemaciclib for 7 days and performed dynamic BH3 profiling (DBP) to measure changes in net apoptotic signaling at the mitochondrion29. In each case, abemaciclib pre-treatment reduced mitochondrial depolarization in response to the pro-apoptotic peptide BIM, indicating that CDK4/6 inhibition “unprimes” tumor cells, reducing the likelihood that they will undergo apoptosis (Fig. 4b and Extended Data Fig. 4c)30.
Fig. 4 |. CDK4/6 inhibitor-activated enhancers potentiate apoptotic evasion.
a, ChIP-Enrich analysis of super-enhancers gaining H3K27ac after 7 days of abemaciclib treatment in MCF7 and MDA-MB-453 cells.
b, Dose-response curves showing percent mitochondrial depolarization in MCF7 and MDA-MB-453 cells after exposure to Bim peptide (dynamic BH3 profiling), after treatment with DMSO or abemaciclib for 7 days (n=2 technical replicates, representative of two independent experiments).
c, Relative BCL2L1 RNA-seq normalized reads in human breast cancer cell lines treated with DMSO or abemaciclib (MDA-MB-361 and T47D: n=2, MCF7, MDA-MB-453, and BT474: n=3 independent cultures). Means ± s.d. are shown. DESeq2 was used to calculate adjusted P-values.
d, Western blot showing Bcl-xL expression in MCF7, MDA-MB-453, and T47D cells treated with DMSO or abemaciclib. Blots shown are representative of two independent experiments in MCF7 and MDA-MB-453, and one experiment in T47D.
e, Representative Bcl-xL staining and fraction of Bcl-xL-positive area in mammary tumors of MMTV-rtTA/tetO-Her2 mice treated with control (n=32) or abemaciclib (n=29) for 12 days. Means ± s.d. of percent area are shown. P value was determined by a two-tailed Mann-Whitney test. Scale bars indicate 200 μm.
f, H3K27ac ChIP-seq tracks at BCL2L1 in cell lines treated with DMSO or abemaciclib.
g, Western blots assessing cleaved PARP in MCF7 and MDA-MB-453 cells treated with DMSO or abemaciclib, followed by the addition of Bcl-xL inhibitor A-1155463 for 24 hours, and then induced to undergo apoptosis with staurosporine for 4 hours as indicated. Representative images are from two independent experiments in MCF7 and one experiment in MDA-MB-453.
h, Representative cleaved caspase-3 staining and quantification of cleaved caspase-3-positive area in PDX 14–07 tumors treated with vehicle (n=21), abemaciclib (n=18), Bcl-xL inhibitor A-1331852 (n=15), or the combination (n=18). Mean ± s.d. of positively stained area are shown. P values were determined by Kruskal-Wallis, Dunn’s multiple comparisons test. Scale bars represent 100 μm. Western blots in d and f are cropped; uncropped blot images for the experiments in this figure are shown in Source Data Fig. 4.
We hypothesized that this negative effect on apoptotic priming, occurring at the mitochondrial membrane, might be caused by increased levels of one or more anti-apoptotic members of the Bcl-2 protein family. Notably, we observed an RB-dependent upregulation of BCL2L1 (encoding Bcl-xL) and MCL1 (but not BCL2L2 or BCL2) gene expression in 5 out of 5 cell lines treated with abemaciclib (Fig. 4c and Extended Data Fig. 4d–′h). Given that the final levels of Bcl-2 family proteins are regulated not only by transcription but also by post-translational modifications, we next assessed Bcl-xL and Mcl-1 protein levels, and observed that abemaciclib increased Bcl-xL (but not Mcl-1, data not shown) levels in cells (Fig. 4d). Consistent with this, Bcl2l1 transcript and Bcl-xL protein levels in MMTV-rtTA/tetO-HER2 tumor tissue were also elevated after CDK4/6 inhibitor treatment (Fig. 4e and Extended Data Fig. 4i). Supporting the notion that this increase was due to newly activated SEs, we observed increased H3K27 acetylation over a 45-kilobase long SE encompassing much of the BCL2L1 gene in MCF7 and MDA-MB-453 cells (Fig. 4f, Extended Data Fig. 4j).
We next sought to determine whether the negative effect on apoptotic priming was directly caused by elevated Bcl-xL levels. Consistent with our DBP data, abemaciclib pre-treatment decreased tumor cell apoptosis (assessed by cleavage of Poly ADP ribose polymerase (PARP)) in response to short-term staurosporine treatment, and this effect was completely mitigated by selective and potent Bcl-xL inhibition (Fig. 4g). In vivo, Bcl-xL inhibition induced apoptosis in PDX tumors pre-treated with abemaciclib but not vehicle control, suggesting that CDK4/6 inhibition might increase tumor cell dependency on Bcl-xL for survival (Fig. 4h). Finally, in vitro studies showed similar effects using a clinically relevant agent, the phosphoinositide 3-kinase (PI3K) inhibitor BYL719, instead of staurosporine (Extended Data Fig. 4k). Collectively, these data are consistent with a model where CDK4/6 inhibition leads to the activation of a SE that drives increases in intra-tumoral levels of Bcl-xL, hence inducing an anti-apoptotic state. This state can be reversed by Bcl-xL inhibition, restoring the apoptotic response to therapeutically relevant drugs.
LTR enhancers are predicted to regulate tumor immunogenicity
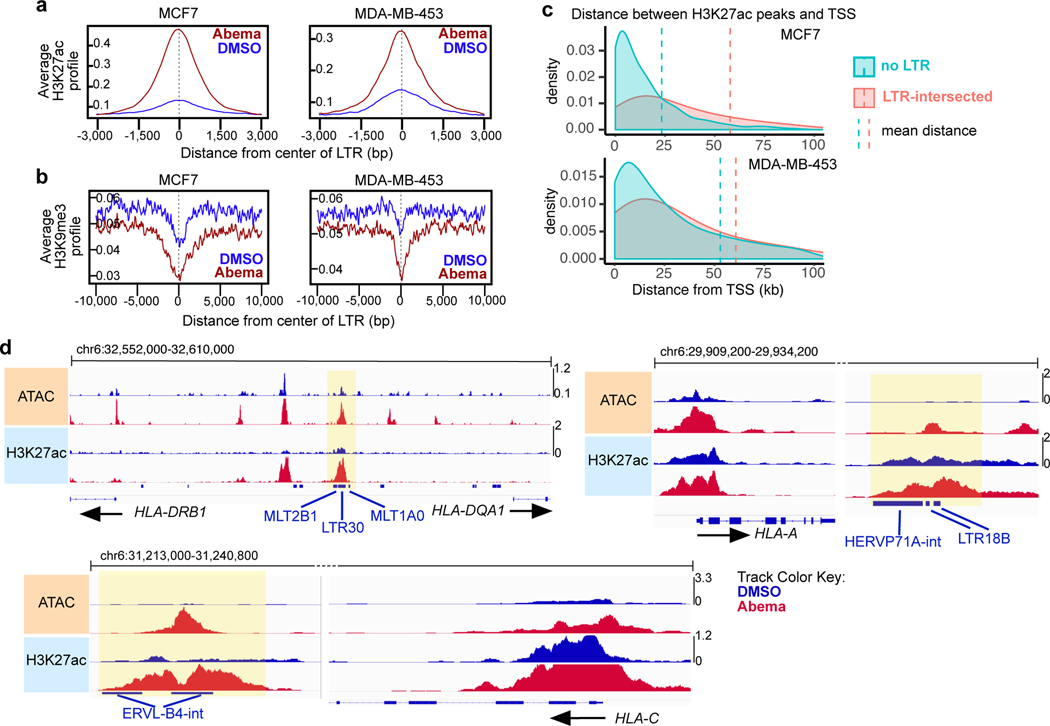
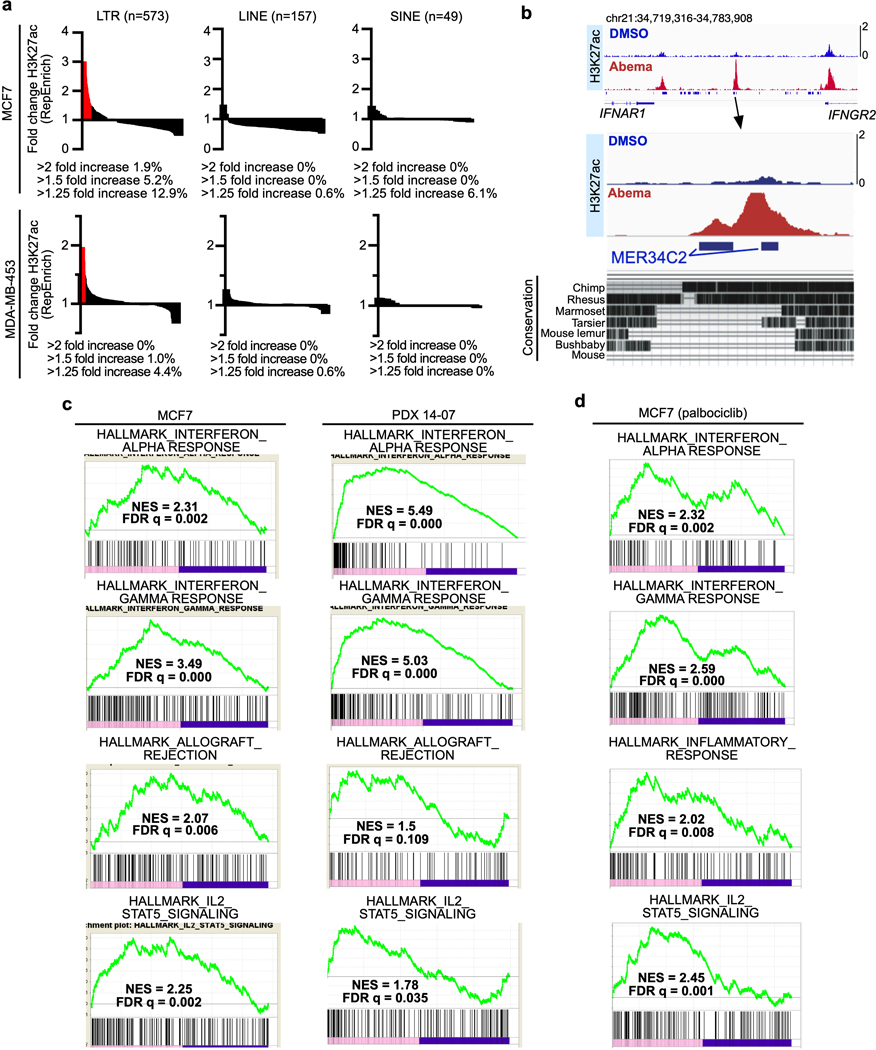
One unique epigenetic phenomenon seen in classical senescence is the activation of regulatory DNA sequences overlying transposable elements (TEs) in the genome31. To determine whether this is also seen after CDK4/6 inhibition, we analyzed ChIP-seq data from MCF7 and MDA-MB-453 cells to quantify H3K27 acetylation (both at uniquely and non-uniquely mapped reads) over repetitive genomic elements32. Remarkably, and distinct from reports describing classically senescent cells, abemaciclib treatment increased aggregate H3K27ac (>1.5 fold) in 30 and 6 distinct long terminal repeat (LTR) family members in MCF7 and MDA-MB-453 cells, respectively, but in none of the long or short interspersed nuclear elements (LINEs and SINEs) (Extended Data Fig. 5a). We next analyzed only uniquely mappable reads and found that the peak of the composite H3K27ac signal and the trough of the composite H3K9me3 signal were directly aligned over the center of these LTRs, strongly suggesting that they were bona fide enhancers (Figs. 5a, b). In addition, abemaciclib-responsive LTR enhancers were, on average, located further away from the nearest TSS than non-LTR enhancers, consistent with their tendency to regulate expression of nearby genes over longer distances33 (Fig. 5c).
Fig. 5 |. CDK4/6 inhibitor-activated LTR enhancers are predicted to regulate immune genes.
a,b, Composite profiles of H3K27ac (a) and H3K9me3 (b) ChIP-seq signals at abemaciclib-activated LTR enhancers in MCF7 and MDA-MB-453 cells after 7 days of treatment. Zero on x-axes represents center of each LTR region.
c, Density plots of distances between abemaciclib-induced H3K27ac up-peaks and the nearest transcriptional start site (TSS) in MCF7 and MDA-MB-453 cells (red: LTR-intersected enhancers; blue: non-intersected with LTRs). Vertical dashed lines indicate mean distances.
d, Representative ATAC-seq and H3K27ac ChIP-seq tracks at abemaciclib-activated LTR enhancers and adjacent immune genes in MCF7 treated with DMSO or abemaciclib for 7 days. LTRs annotated using Repeat Masker are shown as blue bars. Yellow highlights indicate H3K27ac up-peaks that align with an LTR.
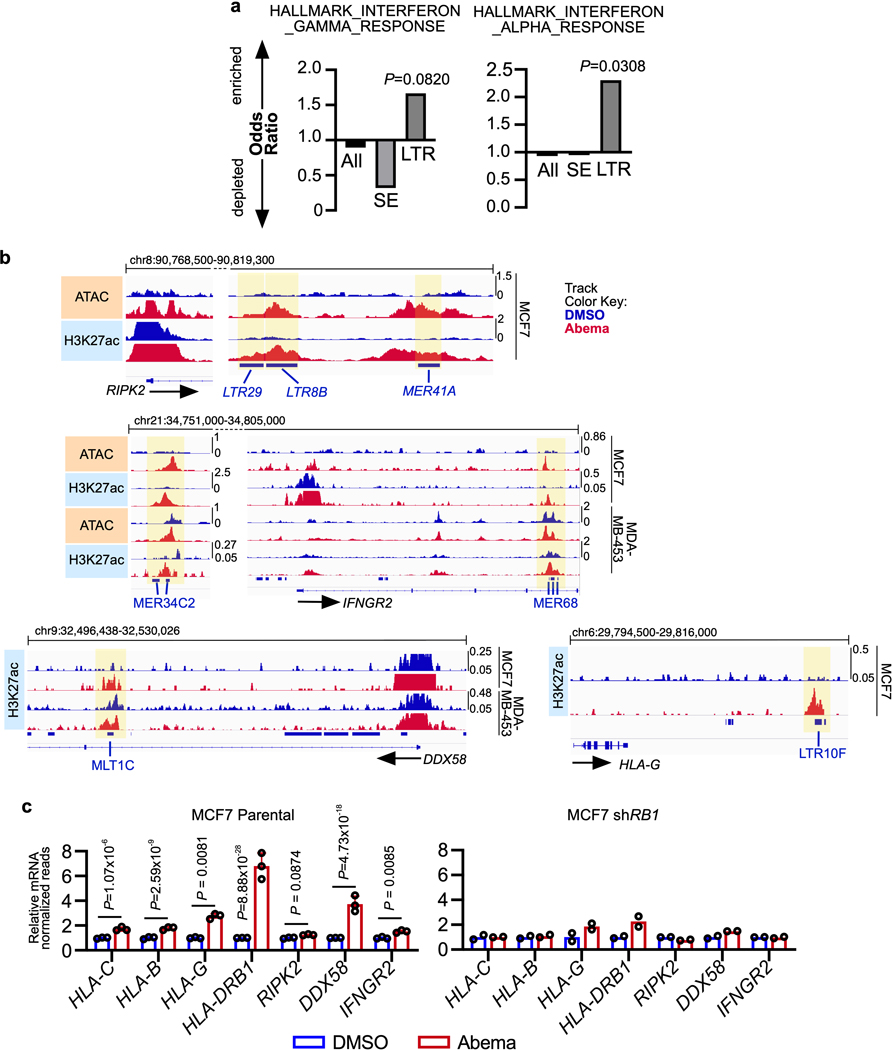
LTR elements, which make up a large portion of endogenous retroviral (ERV) sequences, integrated into the genome after retroviral infection of human ancestors. As a result, the conservation of a given LTR sequence across species is dependent upon the time at which it integrated, with more recent integrations more likely to be primate-specific. Consistent with this, we found that individual abemaciclib-activated LTRs showed little cross-species conservation, suggesting that they represented an evolutionarily more recent set of DNA sequences (Extended Data Fig. 5b). Notably, certain families of recently integrated LTRs have evolved to persist at sites that facilitate their regulation of interferon-stimulated genes (ISGs), and CDK4/6 inhibitors have previously been shown to enhance interferon-driven gene expression programs in tumor cells6,7,34. We confirmed this gene expression program in a cell line and a PDX model (Extended Data Fig. 5c, d) and speculated that the subset of LTR-derived enhancers activated by CDK4/6 inhibitors might specifically contribute towards upregulating ISG expression. To test this, we used the ChIP-Enrich platform to compare the regulatory potential of (i) all enhancers, (ii) SEs, and (iii) LTR enhancers activated by abemaciclib. Interestingly, LTR enhancers were uniquely enriched for proximity to interferon-driven genes (Extended Data Fig. 6a). Furthermore, we observed that several interferon-driven genes upregulated by abemaciclib in an RB-dependent manner were situated in close proximity to newly activated LTR enhancers, including genes involved in antigen presentation (both MHC Class I and II genes, e.g. HLA-A, HLA-C, HLA-DRB1, HLA-DQA1), receptors for critical immune cytokines (IFNGR2), and key components of immune signaling complexes (e.g. RIPK2) (Fig. 5d and Extended Data Figs. 6b, c). Thus, a subset of CDK4/6 inhibitor-activated enhancers directly overlies LTRs, and it is possible (although not proven here) that these might contribute to the treatment-induced augmentation of tumor cell immunogenicity.
AP-1 implicated in enhancer activation
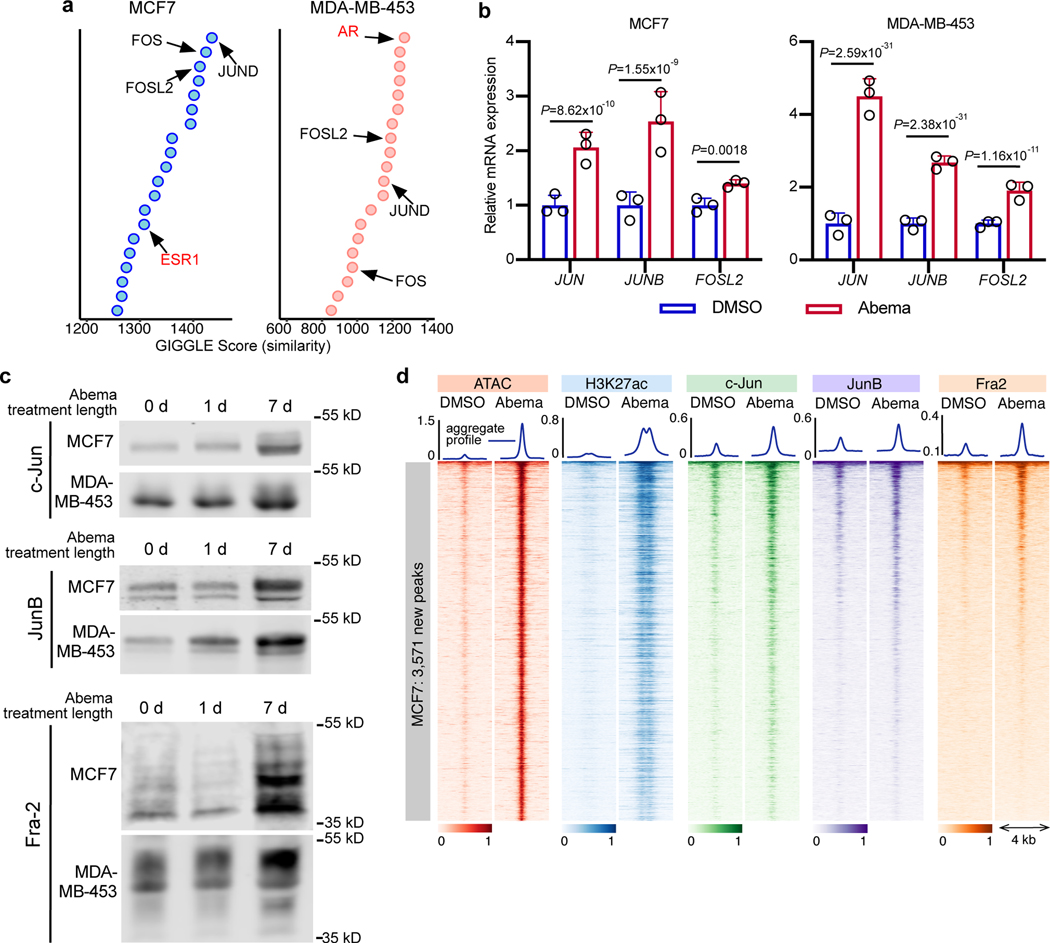
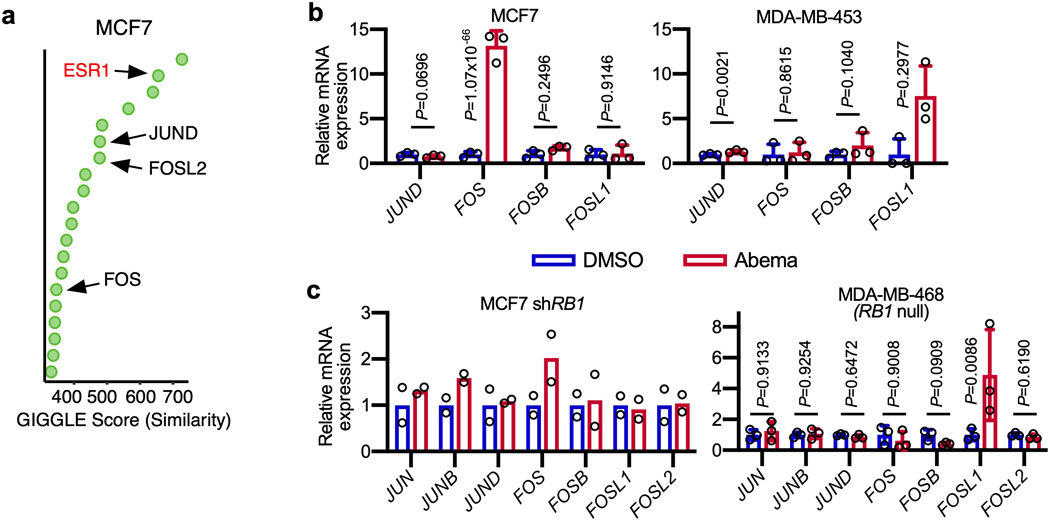
We next sought to identify transcription factors involved in the activation of enhancers by CDK4/6 inhibitors. To this end, we overlaid the genomic coordinates of CDK4/6 inhibitor-upregulated H3K27ac sites in MCF7 and MDA-MB-453 cells with those from publicly available ChIP-seq datasets35. As expected, we found enrichment for hormone receptors that are characteristic of luminal breast cancers (estrogen receptor (ER) in MCF7 and androgen receptor (AR) in MDA-MB-453). In addition, this analysis revealed striking enrichment for Activator Protein-1 components (Fos and Jun proteins; Fig. 6a and Extended Data Fig. 7a). We turned our attention to the AP-1 factors because (i) they have a characterized role in maintaining the mature luminal mammary cell state which we had observed after CDK4/6 inhibition36,37; and (ii) previous studies have shown that RB hypophosphorylation can activate AP-1 transcriptional activity, which in turn increases AP-1 levels in a feed-forward manner38–40.
Fig. 6 |. CDK4/6 inhibitor-induced active enhancers demonstrate increased AP-1 binding.
a, Similarity (GIGGLE) scores between regions of increased H3K27ac signal genome-wide in MCF7 and MDA-MB-453 cells after abemaciclib treatment, and GEO-archived datasets of ChIP-seq for transcription factors (using “Cistrome Toolkit”). Top 20 factors identified are shown - AP-1 factors (black) and steroid hormone receptors (red) are labeled.
b, Relative RNA-seq normalized reads of AP-1 factors in MCF7 and MDA-MB-453 treated with DMSO or abemaciclib for 7 days (n=3 independent cultures). Means ± s.d. are shown. DESeq2 was used to calculate adjusted P-values.
c, Western blot showing AP-1 factor protein expression in nuclear extracts of MCF7 and MDA-MB-453 cells treated with abemaciclib for 0, 1, or 7 days (equal number of nuclei per lane). Images of c-Jun and JunB are representative of three independent experiments in MCF7, image of Fra2 is representative of two independent experiments. Image of JunB in MDA-MB-453 is representative of two independent experiments, and images of c-Jun and Fra2 are representative of one experiment. Western blots are cropped; uncropped blot images for the experiments in this figure are shown in Source Data Fig. 6.
d, Heatmap of c-Jun, JunB, and Fra2 binding (ChIP-seq) at abemaciclib-induced ATAC up-peak regions as in Fig. 1a in MCF7 cells treated with DMSO or abemaciclib.
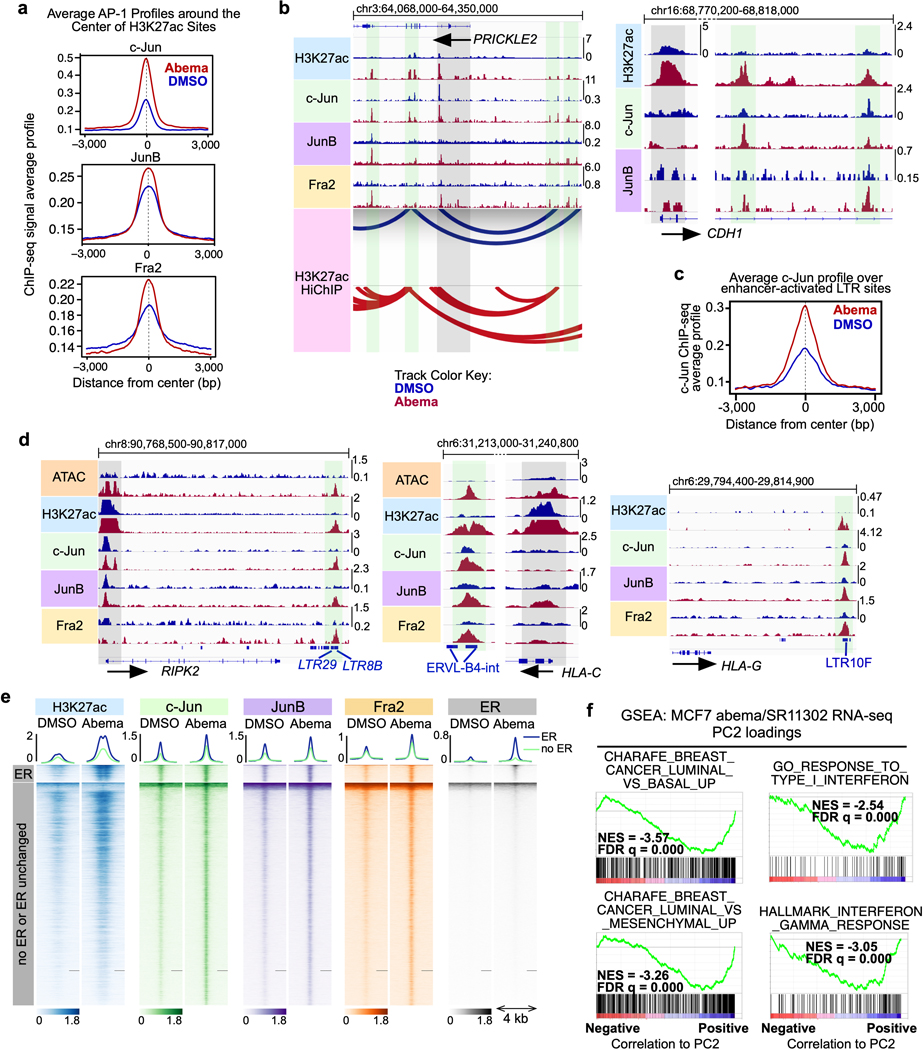
First, we noted that abemaciclib increased the expression of several AP-1 factor genes in luminal breast cancer cell lines (e.g. JUN, JUNB, and FOSL2) in an RB-dependent manner, and that this led to an increased level of these factors in the nucleus (Figs. 6b, c and Extended Data Figs. 7b, c). Moreover, ChIP-seq for c-Jun, JunB and Fra-2 (all AP-1 factors) uncovered widespread increases in AP-1 binding at abemaciclib-activated enhancers (Fig. 6d and Extended Data Fig. 8a), and ChIP-Enrich analysis revealed that regions gaining AP-1 binding were predicted to regulate genes governing mammary differentiation, apoptotic evasion, and interferon responses (Supplementary Table 5). We also observed specific increases in c-Jun, JunB, and Fra-2 binding at H3K27ac-decorated enhancers looping directly to the promoters of genes involved in cell polarity and adhesion (e.g. PRICKLE2, CDH1) and at LTR enhancers adjacent to interferon-stimulated genes (Extended Data Figs. 8b–′d). Finally, only a small minority of activated, c-Jun/JunB/Fra-2-bound enhancers in MCF7 cells also showed increased ER binding as assessed by ChIP-seq, suggesting the role of ER as a driver of enhancer activity, at least at this subset of enhancers, might be limited (Extended Data Fig. 8e).
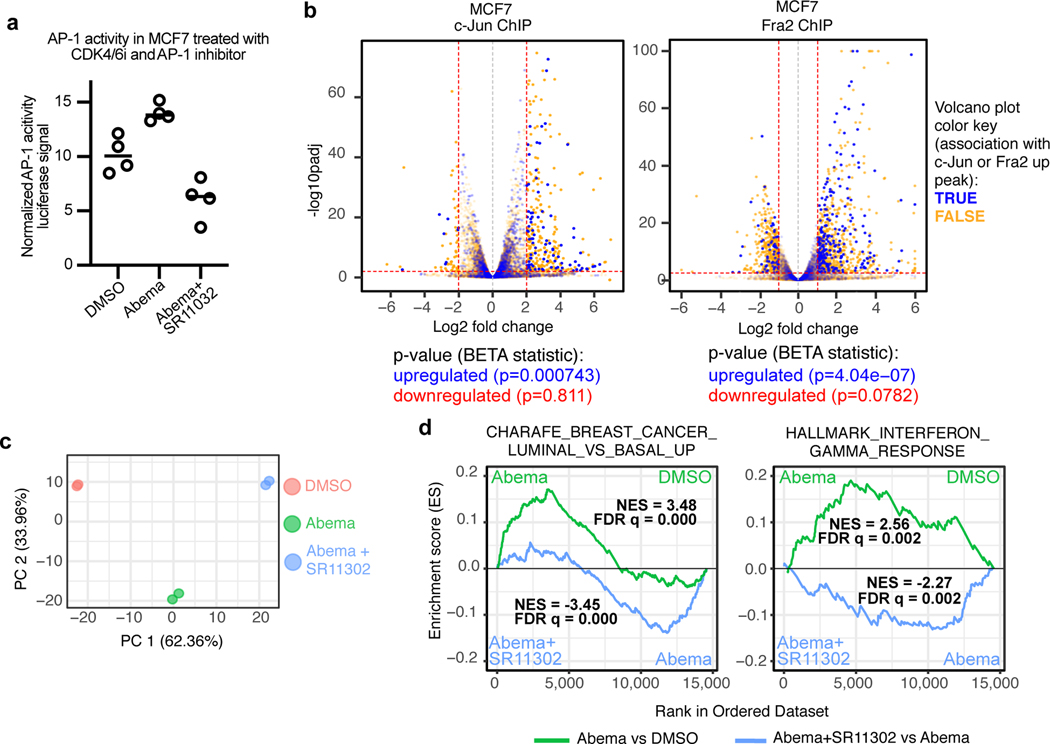
We next sought to establish a functional role for AP-1 factors in mediating new enhancer activity after CDK4/6 inhibition. Abemaciclib increased AP-1 transcriptional activity in MCF7 cells as measured with an AP-1 activity luciferase reporter assay, and at a genome-wide level, abemaciclib-induced c-Jun “up-peaks” and Fra-2 “up-peaks” were strongly associated with upregulated expression of nearby genes – both implying that AP-1 plays a functional role in driving CDK4/6 inhibitor-mediated enhancer activity (Figs. 7a, b). In addition, concomitant treatment of MCF7 cells with SR11302 (a retinoid that selectively transrepresses AP-1 activity but does not activate transcription41) suppressed the abemaciclib-induced upregulation of genes governing luminal mammary differentiation and interferon responses (Figs. 7a, c, d and Extended Data Fig. 8f). Collectively, these data demonstrate that CDK4/6 inhibition increases AP-1 levels in breast cancer cells, in turn driving new enhancer activity that underpins key biological effects of treatment.
Fig. 7 |. Upregulation of key transcriptional signatures by CDK4/6 inhibitors is mitigated by concomitant inhibition of AP-1.
a, Relative AP-1 transcriptional activity (firefly:renilla luciferase ratio) in MCF7 cells transfected with the AP-1 firefly luciferase reporter plasmid and a Renilla luciferase plasmid. Cells were treated with DMSO, abemaciclib, or abemaciclib plus SR11302 for 7 days (n=4 technical replicates from one experiment).
b, Association between abemaciclib-induced c-Jun (left) or Fra2 (right) up-peaks and gene expression in MCF7 cells treated with DMSO or abemaciclib. Volcano plots depict RNA-seq log2 fold change and adjusted P-values were calculated by DESeq2. Each dot represents one gene: blue indicates association with AP-1 factor up-peak, and orange indicates no association, as reported by BETA. P-values below plots denote the significance of associations relative to background as calculated by BETA.
c, Principal components analysis of RNA-seq data from MCF7 cells treated with DMSO, abemaciclib, or abemaciclib and SR11302 (n=2 technical replicates from one experiment).
d, Gene set enrichment analysis (GSEA) plots of RNA-seq of MCF7 cells treated with abemaciclib compared to treatment with DMSO or the combination of abemaciclib and SR11302. Normalized enrichment scores (NES) and false discovery rate (FDR) q values were calculated using GSEAPreranked.
Clinical evidence of CDK4/6 inhibitor-induced enhancer remodeling
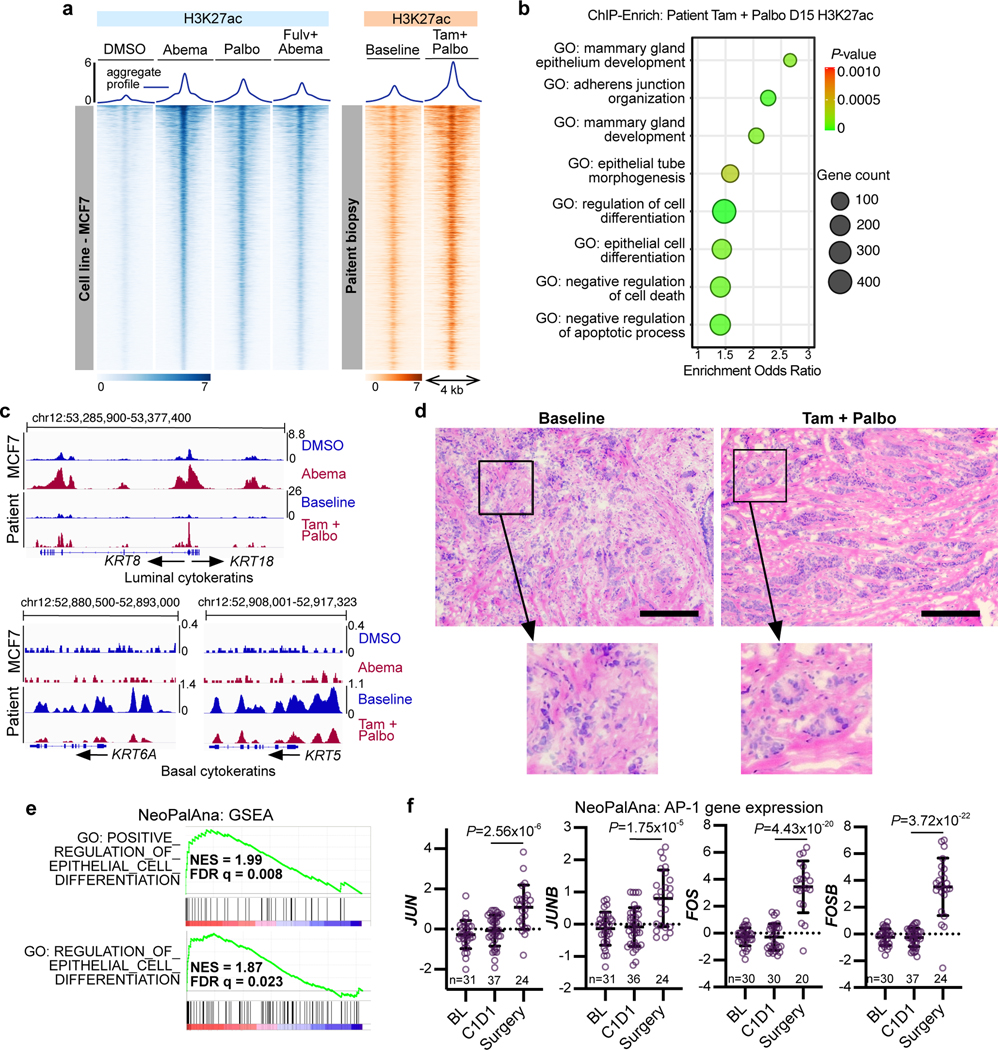
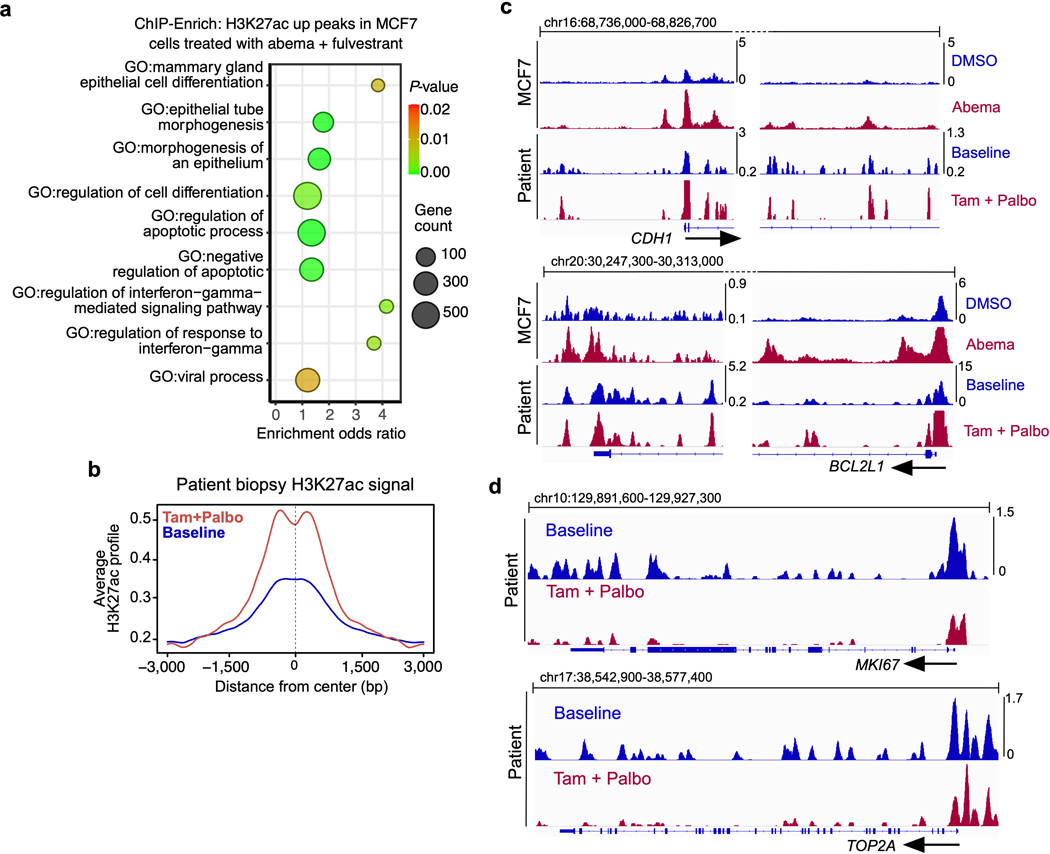
Finally, we sought evidence that CDK4/6 inhibitor enhancer remodeling is a clinically relevant phenomenon. In clinical practice, CDK4/6 inhibitors are often prescribed in combination with anti-estrogenic therapies2, and to first model this, we treated MCF7 cells with abemaciclib plus fulvestrant, a selective estrogen receptor degrader, and performed H3K27ac ChIP-seq. Although the intensity of the H3K27ac signal was attenuated in some regions, the vast majority of new H3K27ac up-peaks seen after CDK4/6 inhibitor monotherapy were also induced by combination treatment (Fig. 8a). Moreover, ChIP-Enrich analysis of enhancers activated in dual-treated cells revealed the same sets of gene ontology terms as were observed after abemaciclib monotherapy (Extended Data Fig. 9a). We then performed H3K27ac ChIP-seq on a pair of primary breast cancer biopsies obtained at baseline and again after 14 days of treatment with CDK4/6 inhibition and endocrine therapy (palbociclib and tamoxifen) from a patient enrolled in a neoadjuvant clinical trial (NCT02764541). Remarkably, H3K27ac ChIP-seq profiles from these clinical specimens recapitulated our preclinical findings: (i) many enhancers activated by 7 days of abemaciclib treatment in MCF7 were also activated in the clinical samples (Fig. 8a and Extended Data Fig. 9b); (ii) ChIP-Enrich analysis of enhancer regions activated in the clinical samples uncovered ontology terms related to mammary differentiation and apoptotic evasion (Fig. 8b); (iii) CDK4/6 inhibition markedly increased the H3K27ac signal at SEs spanning luminal cytokeratins (KRT8, KRT18), junctional adhesion molecules (CDH1), and BCL2L1, and reciprocally decreased signal around S phase genes (MKI67, TOP2A) and basal cytokeratins (KRT5, KRT6A) (Fig. 8c and Extended Data Figs. 9c, d); (iv) treatment induced histologic tumor differentiation evidenced by increased tubule formation (Fig. 8d). Finally, we interrogated gene expression data from a larger clinical cohort – the NeoPalAna clinical trial - in which patients underwent tumor biopsy before and after treatment with palbociclib42. Consistent with our preclinical observations, GSEA revealed upregulation of gene expression signatures related to epithelial differentiation (Fig. 8e). Moreover, of over 15,000 genes analyzed in biopsies of the NeoPalAna trial, JUNB, JUN, FOS, and FOSB were all amongst the 35 most significantly upregulated genes after palbociclib treatment (Fig. 8f).
Fig. 8 |. Clinical evidence of CDK4/6 inhibitor-induced enhancer remodeling.
a, H3K27ac ChIP-seq heatmap in MCF7 cells treated with DMSO, abemaciclib, palbociclib or abemaciclib and fulvestrant (left, blue) and the corresponding regions in paired clinical biopsies from one patient at baseline or after 14 days of palbociclib and tamoxifen treatment (right, orange). Heatmap covers all abemaciclib-induced H3K27ac up-peaks in MCF7 cells.
b, ChIP-Enrich analysis of H3K27ac up-peaks in the biopsies from the patient in a treated with tamoxifen and palbociclib compared to baseline.
c, H3K27ac ChIP-seq tracks at regions in proximity to luminal (top) and basal (bottom) cytokeratins in MCF7 cells treated with DMSO or abemaciclib, and in the paired biopsies from the patient in a at baseline or after tamoxifen and palbociclib.
d, H&E stained sections of the patient tumor as in a-c at baseline and after 14 days’ palbociclib and tamoxifen treatment. Scale bars represent 200 μm.
e, Upregulated epithelial cell differentiation signatures from GSEA of primary ER-positive breast cancers treated with palbociclib for 12 weeks in the NeoPalAna trial (C1D1, n=34; surgery, n=23). FDR q values were calculated by GSEA.
f, Expression of JUN, JUNB, FOS, and FOSB in primary breast cancers of patients at baseline (BL), after 1 month of endocrine treatment (C1D1), and 12 weeks after addition of palbociclib (SURG) in the NeoPalAna trial (n represents number of patient biopsies, noted in each graph). Means ± s.d. of relative microarray reads are shown. LIMMA was used to calculate adjusted P-values.
Discussion
Collectively, our data demonstrates a previously unreported consequence of CDK4/6 inhibition in breast cancer – remodeling of chromatin architecture characterized by widespread enhancer activation. Several of these are SEs governing biologic processes including luminal differentiation and apoptotic evasion. A second distinct group of enhancers overlies LTRs, does not show cross-species conservation, and is statistically enriched for proximity to ISGs. Our findings also have clinical relevance, lending support for therapeutic combinations comprising CDK4/6 inhibitors together with either Bcl-xL inhibitors or immunotherapy.
Our study offers new insights into previously described features of RB activation (e.g. cellular differentiation) and suggests a unifying epigenetic mechanism to explain several of the recently described but poorly understood consequences of CDK4/6 inhibitors4–6,8,43,44. We demonstrate an RB-dependent upregulation of AP-1 expression in CDK4/6 inhibitor treated breast cancer cells, (noting that other groups have detailed a potential mechanism for this38–40) and also implicate heightened AP-1 activity as a driver of key drug-induced transcriptional programs.
It is important to acknowledge that CDK4/6 inhibitors are administered concomitantly with endocrine therapy in most cases, and our insights into the effects of this combination remain limited. Future studies should aim to dissect the interplay of the CDK4/6 pathway and ER at the level of chromatin, taking into account the different mechanisms of action of various endocrine therapies. In addition, functional confirmation that LTR enhancers drive immune gene expression in this setting is currently lacking.
Finally, it is likely that the phenomenon of CDK4/6 inhibitor-induced enhancer activation is relevant to cancers derived from other cellular lineages and even non-cancerous cells (e.g. proliferating immune cells), and we predict that the responses of other cell types to CDK4/6 inhibition might also have epigenetic underpinnings that will show marked lineage specificity.
Methods
Cell lines.
MCF7 (Cat #HTB-22), BT474 (Cat #HTB-20), T47D (Cat # HTB-133), MDA-MB-468 (Cat #HTB-132), MDA-MB-361 (Cat #HTB-27) were cultured in RPMI containing 10% FBS, 1% GlutaMax, and 1% HEPES. MDA-MB-453 (Cat #HTB-131) was cultured in DMEM containing 10% FBS. All cell lines were obtained from ATCC and tested negative for mycoplasma (MycoAlert Mycoplasma Detection Kit, Lonza). Cell line identity was confirmed by short tandem repeat analysis (Promega GenePrint 10 System).
In vitro drug studies.
Abemaciclib methanesulfonate was obtained from Eli Lilly. BYL719 and palbociclib were purchased from Haoyuan Chemexpress. Staurosporine was purchased from Enzo Life Sciences. Fulvestrant was purchased from Selleckchem. A-1155463 was obtained from ChemieTek. SR11302 was purchased from Tocris. All drugs were diluted in dimethyl sulfoxide (DMSO) for in vitro studies. Unless otherwise noted, abemaciclib and palbociclib were used at 500 nM in vitro, with treatment length of 7 days.
For ATAC-sequencing, cells were treated with DMSO control or with abemaciclib for 12 hours, 24 hours, or 7 days. For H3K27ac ChIP-seq, cells were treated with DMSO, abemaciclib, palbociclib, or with abemaciclib and fulvestrant (100 nM) for 7 days. For H3K9me3, estrogen receptor (ER), c-Jun, JunB, and Fra2 ChIP-seq, cells were treated with DMSO or abemaciclib for 7 days.
For transcriptome and RNA-sequencing, cells were treated with abemaciclib, palbociclib, or abemaciclib and SR11302 (20 μM) for 7 days (unless otherwise indicated), and RNA was extracted using the NucleoSpin® RNA plus kit (Macherey-Nagel) per manufacturer’s protocol.
For experiments assessing apoptosis by measuring cleaved poly (ADP-ribose) polymerase (PARP), cells were treated with DMSO or abemaciclib (MCF7, 1000 nM; MDA-MB-453, 500 nM) for 3 days, then cell media was changed to include abemaciclib and A-1155463 (1 μM), as indicated. After 24 hours, staurosporine (500 nM) was added for 4 hours, or BYL719 (1 μM) was added for 8 hours.
shRNA experiments.
Cell lines constitutively expressing shRNA to RB1 (TRCN0000295842, Sigma) or to luciferase (control) were made as previously described4. Knockdown efficiency was confirmed by western blot.
Animal experiments.
PDX 14–07 originated from a biopsy of a liver metastasis and transplanted into female Foxn1nu nude mice (M. musculus) as previously described4. Tumor formation was induced and sustained in female MMTV-rtTA/tetO-HER2 FVB mice with doxycycline as previously described4, and these tumors were transplanted into female nude mice for FiTAc-seq experiments. All mice were around 6–10 weeks of age at the time of tumor transplant. Mice were assigned randomly to treatment groups with equal average starting tumor volumes, and tumors were 5–10 mm in diameter when treatment began. Caliper measurements of tumors were performed 2–3 times per week, and tumor volumes were calculated as previously described4. Mouse euthanasia was achieved by CO2 inhalation.
Abemaciclib methanesulfonate (Eli Lilly) was prepared as previously described4 and administered by daily oral gavage. A-1331852, purchased from Haoyuan Chemexpress, was formulated in 10% ethanol, 2.5% DMSO, 27.5% PEG300, and 60% PHOSAL® 50 PG, and stored away from light45.
Six nude mice carrying MMTV-rtTA/tetO-HER2 tumors were dosed with abemaciclib (90 mg per kg body weight) or control for up to 59 days. Nude mice transplanted with PDX 14–07 tumors were treated with abemaciclib (90 mg per kg body weight) or control for 21 to 28 days as previously described4. These studies were performed in compliance with federal laws and institutional guidelines as approved by the Institutional Animal Care and Use Committee of the Dana-Farber Cancer Institute.
Twenty-eight nude mice transplanted with PDX 14–07 tumors into the left thoracic mammary fat pad were treated with abemaciclib (90 mg per kg body weight) or vehicle for 11 or 6 days, respectively, by daily oral gavage and then treated with abemaciclib (lowered to 75 mg per kg body weight, daily), A-1331852 (25 mg per kg body weight, by oral gavage every 12 hours, 3 doses in total), the combination, or with vehicle for 24 hours. This study was performed in compliance with federal laws and institutional guidelines as approved by the Animal Ethics Experimentation Committee of the Peter MacCallum Cancer Centre.
ATAC-sequencing.
Treated cells were washed with PBS, crosslinked with 1% paraformaldehyde (Thermo Scientific #28906) for 10 minutes, quenched with glycine, and flash frozen until processing. Fifty thousand cells were resuspended in 1 mL of cold ATAC-seq resuspension buffer (RSB; 10 mM Tris-HCl pH 7.4, 10 mM NaCl, and 3 mM MgCl2 in water). Cells were centrifuged at maximum speed for 10 minutes in a pre-chilled (4°C) fixed-angle centrifuge. After centrifugation, supernatant was carefully aspirated. Cell pellets were then resuspended in 50 μL of ATAC-seq RSB containing 0.1% NP40, 0.1% Tween-20, and 0.01% digitonin by pipetting up and down three times and incubated on ice for three minutes. After lysis, 1 mL of ATAC-seq RSB containing only 0.1% Tween-20 was added, and the tubes were inverted to mix. Nuclei were then centrifuged for five minutes at max speed in a pre-chilled fixed-angle centrifuge. Supernatant was removed, and nuclei were resuspended in 50 μL of transposition mix (25 μL 2X TD buffer, 2.5 μL transposase (100 nM final), 16.5 μL PBS, 0.5 μL 1% digitonin, 0.5 μL 10% Tween-20, and 5 μL water46) by pipetting up and down six times. Transposition reactions were incubated at 37°C for 30 minutes in a thermomixer with shaking at 1000 rpm. Reactions were cleaned up with Qiagen MinElute columns. Libraries were amplified as described by Buenrostro, et al47.
ChIP- and FiTAc-sequencing.
Treated cells were washed with PBS and crosslinked with 1% paraformaldehyde (Thermo Scientific #28906) for 10 minutes, or crosslinked with two agents starting with 2 mM DSG (Pierce) for 45 minutes at room temperature followed by 1 mL of 1% formaldehyde for 10 minutes. Frozen tissue samples were pulverized using CP02 cryoPREP (Covaris) as previously described48, washed in PBS, and cross-linked with 1% formaldehyde for 10 minutes. Cross-linked cell lines or tissues were quenched with 0.125 M glycine for 5 minutes at room temperature. Cross-linked material was resuspended in 0.1% SDS (50 mM Tris-HCl pH8, 10 mM EDTA) and sonicated for 5 minutes with a Covaris E220 instrument (5% duty cycle, 140 Peak Incident Power, 200 Cycles per burst, 1 mL AFA Fiber milliTUBEs).
FiTAc-seq was performed as previously described20. Briefly, FFPE sections containing >80% tumor cell enrichment were used. Chromatin was prepared from 10 sections, each 10 μm thick. Sections were washed 3 times with xylenes to remove paraffin, rehydrated in an ethanol/water series, and prepared as previously described19, with modified buffer and sonication conditions (Covaris E220 instrument, 20 min, 5% duty cycle, 105 Peak Incident Power, 200 Cycles per burst, 1mL AFA Fiber milliTUBEs).
Soluble chromatin (5 μg) was immunoprecipitated with Protein A/G Dynabeads (Thermo Fisher 10002D, 10004D) and 10 μg of H3K27ac (Diagenode C15410196), H3K9me3 (Abcam ab8898), ER (Santa Cruz sc-543), or c-Jun (CST 9165) antibodies. ChIP-seq libraries were constructed using Accel-NGS 2S DNA library kit from Swift Biosciences. Fragments of the desired size were enriched using AMPure XP beads (Beckman Coulter). Libraries were sequenced on a NextSeq instrument (Illumina). Thirty micrograms of soluble chromatin were immunoprecipitated with Protein A Dynabeads and 3.1 μg of JunB (CST 3753) or 1 μg of Fra2 (CST 19967) antibody. ChIP-seq libraries were constructed using NEBNext® Ultra™ II kit from New England Biolabs. 75-bp paired-end reads were sequenced on a NextSeq instrument.
RNA-sequencing.
Total RNA was isolated from cell lines or tissues using a NucleoSpin® RNA Plus kit (Macherey-Nagel). 500 ng RNA was used to prepare libraries using the NEBNext® Ultra™ RNA Library Prep Kit for Illumina. RNA quantity and quality were assessed on an Agilent 2100 Bioanalyzer. For all RNA-seq, reads were sequenced on a NextSeq 500 instrument (Illumina), with the exception of the experiments involving SR11302 or palbociclib, where library preparation and RNA-sequencing were performed by Novogene using their paired-end sequencing pipeline.
Transcriptome methodology.
Transcriptome analysis in mouse tumor tissue were performed as previously described6.
Flow cytometry.
Cell cycle analysis was performed with BrdU/PI as previously described4.
β-galactosidase activity.
Senescence-associated β-galactosidase staining was performed as previously described4. Images were acquired with a Nikon Eclipse Ti microscope with a 4X objective and DS-2Mv camera.
Western blots.
Western blotting was performed as previously described4 with slight modifications: unless otherwise noted, protein lysates from tumor cells were extracted using 1X Cell Lysis Buffer (CST 9803) supplemented with PhosSTOP phosphatase inhibitors (Sigma) and cOmplete™, Mini EDTA-free Protease Inhibitor Cocktail (Sigma), and samples were normalized by total protein concentration measured by the Bio-Rad Protein Assay Dye Reagent (Bio-Rad 5000006) or equal numbers of nuclei, as indicated.
Primary antibodies used include cleaved-PARP (CST 9541), Bcl-xL (Abcam ab32370), RB (CST 9309), Lamin A/C (CST 4777), JunB (CST 3753), c-Jun (CST 9165), Fra-2 (CST 19967) and vinculin (Sigma V9131). Primary antibodies were used at 1:1,000, except vinculin, which was used at 1:5,000. Secondary antibodies used include Quick Western Kit IRDye 680RD (Licor 926–68100) used at 1:1000, Mouse IgG (H&L) Antibody DyLight™ 800 Conjugated (Rockland 610–145-002) used at 1:5,000, and Goat anti-Rabbit IgG (H+L) Highly Cross-Adsorbed Secondary Antibody, Alexa Fluor 680 (Invitrogen A21109) used at 1:3,000. Secondary antibodies with different lot numbers were used and consistent results were observed. Western blot images were acquired on the Odyssey CLx Imaging System (LI-COR Biosciences) and processed using ImageStudio Lite v5.2.5 software.
Nuclear extraction.
Treated cells were trypsinized and resuspended in Buffer A (pH 7.0, 10 mM HEPES, 5 mM MgCl2, 25 mM KCl) at 1×10⁴ cells per μL. Cell suspension was passed through a 25 ½ gauge needle 10 times and incubated on ice for 15 minutes. NP-40 was added to each sample to attain 0.2% final concentration. Cells were vortexed for 10 seconds and centrifuged at 14,000 xg for 30 seconds at 4°C. The supernatant was removed, while the nuclear pellet was lysed in 1X Laemmli buffer (5% β-mercaptoethanol) at 1×10⁴ cells per μL and boiled at 95°C for 10 minutes.
HiChIP.
HiChIP experiments were performed as previously described21. In brief, nuclear isolation and in situ Hi-C contact generation were performed by proximity ligation on 5×10⁶ crosslinked cells per condition using biotin-dATP. The isolated nuclei were then lysed and sonicated prior to chromatin immunoprecipitation against the epitope of interest (H3K27ac, Diagenode Cat# C15410196, Lot# A1723–0041D). Next, reverse crosslinking and DNA purification were performed on the immunoprecipitated DNA prior to biotin capture of the Hi-C contacts. The HiChIP libraries were prepared as previously described21, which consists of on-bead library prep with Illumina transposase (Tn5), adjusting enzyme amount linearly according to the amount of post-ChIP DNA (i.e. 1.25 μL Tn5 for 25 ng of DNA). Finally, DNA libraries were prepared with Tn5 on beads amplifying for 13 cycles in total. Libraries were sequenced on an Illumina platform, and the resulting paired-end data was aligned to the hg19 genome with the HiC-Pro pipeline49.
Immunohistochemistry.
Hematoxylin and eosin staining was performed as previously described4. MMTV-rtTA/tetO-HER2 tumors were stained with an antibody against Bcl-xL (Abcam ab32370) as previously described4. PDX 14–07 tumors were stained with an antibody against cleaved caspase-3 (Cell Signaling Technology #9661 S Lot 45) at 1:150 dilution and using sodium citrate buffer pH 6 for antigen retrieval.
Images were acquired with a Nikon Eclipse E600 microscope or with an Olympus BX51 microscope, and three to four fields were analyzed per tumor. Image analysis was performed using a semi-automated in-house platform (NIH ImageJ).
Patient data.
Paired patient biopsy samples for ChIP-seq analysis were obtained from one 43-year-old female patient enrolled on the PELOPS clinical trial (NCT02764541). All patients provided informed consent to participate in this trial and the trial was conducted with local IRB approval. Details of this trial are available on clinicaltrials.gov. The formal protocol is not public as the trial is ongoing. For the specific patient described, a core biopsy of a primary breast cancer was obtained and frozen directly in OCT medium. A second biopsy of the same tumor was obtained after 14 days treatment with palbociclib and tamoxifen. A single frozen section was stained with hematoxylin and eosin from each timepoint and confirmed tumor cellularity of 70% in both samples by a breast pathologist. Two sections of 30 μm thickness were scraped into plastic tubes, washed with PBS and cross-linked with 1% formaldehyde for 10 minutes. Cross-linked tissues were quenched with 0.125 M glycine for 5 minutes at room temperature. Cross-linked material was resuspended in 0.1% SDS (50 mM Tris-HCl pH8, 10 mM EDTA) and sonicated for 10 minutes with a Covaris E220 instrument (5% duty cycle, 140 Peak Incident Power, 200 Cycles per burst, 1 mL AFA Fiber milliTUBEs). Chromatin immunoprecipitation, library construction, and sequencing procedures were the same as above.
Microarray gene expression data (GEO GSE93204) were obtained from biopsy samples from the NeoPalAna clinical trial (NCT01723774)42. GSEA analysis was performed as described by Subramanian et al, using the weighted method for calculating the enrichment statistic and the MSigDB GO v6.0 gene set collection6,50. Background correction and quantile normalization were performed using R (3.5.1) to perform LIMMA analysis (limma_3.36.5)51.
Dynamic BH3 Profiling.
BH3 profiling was performed as previously described29.
AP-1 activity luciferase assay.
MCF7 cells stably expressing a Renilla luciferase plasmid pSL9/RLUC were reverse transfected with the AP-1 activity luciferase reporter plasmid pGL4.44[luc2P AP1 RE Hygro] (purchased from Promega, E4111) using FuGENE® HD (Promega E2311) as per manufacturer’s protocol. Stably transfected cells were selected by one week of treatment with hygromycin at 500 μg/mL. Cells were treated as indicated, then lysed for luciferase activity measurement using the Dual-Luciferase® Reporter Assay (Promega E1910) as per manufacturer’s protocol and data were collected using Cytation 3.
Biological materials.
There are no restrictions on availability of unique biological materials upon reasonable request to the corresponding author.
Statistics and reproducibility.
Statistical analyses were performed as described in the figure legend for each experiment. All measurements were taken from distinct samples. All data are presented as mean ± standard deviation unless otherwise noted in the legends. Differences were considered statistically significant at P≤0.05.
Analysis of ATAC-seq, FiTAc-seq, and ChIP-seq data:
The ChiLin pipeline 2.0.052 was used for quality control and pre-processing of the data. We used Burrows-Wheeler Aligner (BWA Version: 0.7.17-r1188)53 as a read mapping tool to align to hg19 or mm10, and Model-based Analysis of ChIP-Seq (MACS2)54 (v2.1.0.20140616) as a peak caller using default parameters. Based on a dynamic Poisson distribution, MACS2 effectively captures local biases in the genome sequence, allowing for more sensitive and robust prediction of binding sites. Unique reads for a position for peak calling were used to reduce false positive peaks, and statistically significant peaks were finally selected by calculating a false discovery rate (FDR) of reported peaks. CEAS analysis is used to annotate resulting peaks with genome features55. ATAC peaks were called using MACS2 with a FDR<0.01 cut-off. PCA was performed using princomp in R. H3K27ac peaks in MCF7 (used in Figs. 1, 2, and 3), PDX tumors, MMTV-rtTA/tetO-HER2 tumors, and patient biopsies, and H3K9me3, c-Jun, and ER peaks were called using MACS2 with a FDR<0.01 cut-off. H3K27ac peaks in MCF7 (used in Extended Data Fig. 2c and Fig. 6) and MDA-MB-453 were called using MACS2 with a FDR<0.05 cut-off. DESeq2 was used to identify differential peaks in ATAC-seq and FiTAc-seq, where gained or lost peaks were defined with the threshold of log2 fold change + or – 0, respectively, and adjusted P<0.05. The H3K27ac, c-Jun, JunB, Fra2, and ER ChIP-seq differential peaks were determined using subtraction via bedtools (v2.26.0)56. c-Jun, JunB, Fra2, and ER peaks were intersected using bedtools56. Binding and Expression Target Analysis (BETA) v1.0.0 was used to integrate ChIP-seq of transcription factors or chromatin regulators with differential gene expression data to infer direct target genes22. Cistrome Toolkit (dbtoolkit.cistrome.org) was used to probe which factors might regulate the user-defined genes35. Genomic Regions Enrichment of Annotations Tool (GREAT; http://great.stanford.edu/public/html/) was used to annotate peaks with their biological functions17. Conservation plots were obtained with the Conservation Plot (version 1.0.0) tool available in Cistrome35. ChIP-Enrich (v2.6.1; chip-enrich.med.umich.edu) was used to perform GSEA on genomic regions of interest (H3K27ac peaks)25.
Analysis of Super-enhancers:
H3K27ac peaks were called using MACS2 with a FDR<0.01 cut-off. Super-enhancers (SEs) were called by ROSE23 in H3K27ac ChIP-seq data. ChIP-Enrich was used to perform GSEA on SE regions of interest.
Visualization of ChIP-seq, ATAC-seq, and FiTAc-seq data:
Normalized profiles corresponding to read coverage per 1 million reads were used for heatmaps and for visualization using the integrative genomics viewer (IGV). Wiggle tracks were visualized using the integrative genomics viewer. Heat maps were prepared using deepTools (v2.5.4)57. Aggregation plots for ChIP-seq signals were generated using Sitepro in CEAS55. In the volcano plots associated with BETA, ChIP-seq peak summits were associated with the nearest TSS within a distance of +/− 50 kb, and incorporating DESeq2 output from RNA-seq, the volcano plot was generated with ggplot2. Cistrome Toolkit and ChIP-Enrich results were visualized using ggplot2.
Analysis and Visualization of Transcriptome and RNA-seq data:
Transcriptome data was processed as previously described6. For RNA-seq data, read alignment, quality control and data analysis were performed using VIPER (feeec6e)58. RNA-seq reads were mapped by STAR59 v2.6.0 to hg19, and gene counts were generated. For RNA-seq performed by Novogene, read alignment and quality control were carried out using Novogene’s standard pipeline. Differential gene expression analyses were performed on absolute gene counts for RNA-seq data and raw read counts for transcriptomic profiling data using DESeq2 (1.18.1 or 1.22.1)60 in R (v3.4.2). Principal component analysis was performed on DESeq2 variance-stabilizing transformation (VST)-normalized RNA-seq data using prcomp and plotted with ggplot2 in R. Genes were ranked according to a rank metric calculated by the formula: . For GSEA, the ranked gene list was analysed with the GSEAPreranked v3 tool using MSigDB Hallmarks v6.0–1, GO v6.0–1, Curated v6.2 gene set collections. Mountain plots were created using the Broad Institute GSEA software50 or by ggplot2 in R. Sample-sample correlation heatmaps were generated by ggplot2.
Analysis of Repeat Elements:
Read counts for each type of repetitive element were determined by RepEnrich232. Differential analysis of these read counts was performed using edgeR (version 3.26.3)61. Using Repeatmasker annotations, repetitive elements were intersected with H3K27ac peaks as determined by MACS2 using bedtools.
HiChIP contact calling:
The resulting paired-end data was aligned to hg19 genome with the HiC-Pro pipeline49, and contact calling was performed with Fit-HiC pipeline62. To call interactions from HiChIP data, we performed the mapping and pre-processing using the default settings of HiC-Pro v2.9.049 and bowtie 1.1.263 as the base mapper. We then used fitHiChIP (v6.0)64 to call interactions based on allValidPairs using ChIP-seq peaks as interaction anchors. FitHiChIP performs equal occupancy binning of input reads pairs into variable-sized genomic distance bins using the default 5 kb bins. Expected counts were characterized using a spline regression model that accounts for assay-specific biases as well as the scaling of contact probability with genomic distance, computing statistical significance using a global background of expected counts (P2PBckgr_1). Interactions with adjusted P<0.01 were used to generate the final FitHiChIP-identified interaction list. ChIP-Enrich was used to perform GSEA on genomic regions of interest that are not overlying TSS.
Other statistical analyses
All other statistical analyses were performed in GraphPad Prism v8. A two-tailed unpaired t-test was performed on data sets that passed the normality test. A non-parametric Mann-Whitney test or Kruskal-Wallis test accompanied by Dunn’s multiple comparisons was performed on data sets that did not pass the normality test.
Information on replication relevant to each figure is included in the legends. Further information on research design is available in the Nature Research Reporting Summary linked to this article.
Data Availability Statement
ATAC-seq, ChIP-seq, RNA-seq, and HiChIP data that support the findings of this study have been deposited into the Gene Expression Omnibus (GEO) repository under accession codes GSE157097, GSE157082, GSE157222, GSE157218, GSE157216, GSE157214, GSE157211, GSE157385, GSE157384, GSE157383, and GSE157381. Previously deposited transcriptomic data (GSE990626, GSE9320442) that are used in this study are also available at Gene Expression Omnibus4. Source data for Fig. 4, 6 and Extended Data Fig. 1, 4 are provided with this paper. All other data that support the findings of this study are available from the corresponding author upon reasonable request.
Code Availability
No unpublished code was used in this manuscript.
Extended Data
Extended Data Fig. 1. Transcriptional, phenotypic, and epigenetic effects of CDK4/6 inhibitors in human breast cancer cells.
a, Relative RNA-seq normalized reads of representative E2F target genes in breast cancer cell lines treated with abemaciclib for the indicated times (n=2 in MCF7, n=1 in MDA-MB-453, independent cultures).
b, Percentage of cells in S-phase in cell lines treated with dimethyl sulfoxide (DMSO; control) or abemaciclib (abema) for 24 hours (n=3 independent cultures).
c, Representative senescence-associated β-galactosidase staining (blue) of cells treated with DMSO or abemaciclib for 1, 3, or 7 days. Scale bars represent 200 μm. Representative images of two independent experiments in MCF7 and two technical replicates from one experiment in MDA-MB-453.
d, Genomic distribution of regions of significantly reduced ATAC-seq signal in cells treated with abemaciclib, compared to DMSO.
e, GREAT (Genomic Regions Enrichment of Annotations) analysis of regions of significantly reduced ATAC-seq signal within 10 kb of the single nearest gene in cells treated with abemaciclib for 7 days (compared to DMSO).
f, Number of regions with significantly increased ATAC-seq signal in cells treated with abemaciclib as indicated.
g, Heatmap of regions with significantly increased ATAC-seq peak signal after abemaciclib treatment in MDA-MB-361. Up-peaks were determined by a threshold of adjusted P<0.05 calculated by DESeq2.
h, Western blot for RB in MCF7 shLuc and shRB1 cells, representative images from two independent experiments. Western blots are cropped; uncropped blot images for the experiments in this figure are shown in Source Data Extended Data Fig. 1.
i, Relative RNA-seq normalized reads of cell cycle-related genes in MCF7 shRB1 cells and MCF7 shLuc cells (n=2 independent cultures) treated with DMSO or abemaciclib.
j,k, Composite profiles of H3K27ac (j) and H3K9me3 (k) ChIP-seq signals at regions of significantly increased ATAC-seq signal in MCF7 and MDA-MB-453 treated with DMSO or abemaciclib for 7 days.
l, Heatmap of H3K27ac ChIP-seq profiles in MCF7 treated with DMSO, abemaciclib, or palbociclib at abemaciclib-induced H3K27ac up-peak regions.
m, Sample-sample correlation between RNA-seq samples of MCF7 and MDA-MB-453 treated with DMSO or abemaciclib (parental: n=3; shRB1: n=2).
Extended Data Fig. 2. Characterization of CDK4/6 inhibitor-activated super-enhancers in breast cancer cell lines.
a, Signal distribution at abemaciclib-activated H3K27ac-marked enhancers in MCF7 and MDA-MB-453 cells. Arrows indicate the positioning of super-enhancers (to the right of dashed line).
b, Schema for analysis of biological processes regulated by abemaciclib-activated super-enhancers.
c, GO analysis of non-TSS ends of H3K27ac-decorated genomic loops (HiChIP) identified exclusively in abemaciclib-treated MCF7 and MDA-MB-453 cells. Odds ratios and P-values were calculated by ChIP-Enrich.
d, Gene Set Enrichment Analysis (GSEA) of RNA-seq data from MCF7 and MDA-MB-453 cells treated with abemaciclib compared to DMSO.
e, RNA-seq log2 fold change of gene expression of all genes within indicated GSEA gene sets in MCF7 and MDA-MB-453 cells treated with DMSO or abemaciclib for 7 days, calculated by DESeq2. Each dot represents one gene: red, predicted to be regulated by abemaciclib-activated super-enhancers; blue, not predicted to be regulated by abemaciclib-activated super-enhancers.
f, GSEA of RNA-seq data from MCF7 and MDA-MB-453 cells treated with palbociclib compared to DMSO. FDR q values in d and f were calculated by GSEAPreranked.
Extended Data Fig. 3. Enhanced expression of luminal differentiation-related genes is associated with increased H3K27 acetylation at nearby super-enhancers.
a, Representative H3K27ac ChIP-seq genome browser tracks with co-localized H3K27ac-decorated genomic loops (HiChIP) in MCF7 cells treated with DMSO or abemaciclib for 7 days. Gene promoters are highlighted in grey.
b, Relative RNA-seq normalized reads of genes in MCF7 shRB1 cells treated with DMSO or abemaciclib for 7 days (n=2 independent cultures).
c, Relative mRNA expression of genes shown in Fig. 3d in MMTV-rtTA/tetO-Her2 tumors treated for up to 59 days with vehicle or abemaciclib (n=3 independent tumors). Means ± s.d. are shown. P-values were determined by two-tailed unpaired t-tests corrected for multiple comparisons by Holm-Sidak method.
Extended Data Fig. 4. CDK4/6 inhibition promotes apoptotic evasion via BCL2L1.
a,b, ChIP-Enrich analysis of regions gaining H3K27ac after 7 days of abemaciclib treatment of PDX 14–07 tumors (21–28 days of treatment) (a), or of non-TSS ends of genomic loops (measured by HiChIP) detected only in abemaciclib-treated MCF7 and MDA-MB-453 cells (b).
c, Dose-response curves showing percent mitochondrial depolarization in MDA-MB-361 and BT474 treated with DMSO or abemaciclib for 7 days and after exposure to Bim peptide (dynamic BH3 profiling; n=2 technical replicates, data are representative of two independent experiment).
d-f, Relative RNA-seq normalized reads of MCL1 (d), BCL2 (e), and BCL2L2 (f) in human breast cancer cell lines treated with DMSO or abemaciclib, measured by RNA-seq (MDA-MB-361 and T47D: n=2; MCF7, MDA-MB-453, and BT474: n=3 independent cultures). Mean ± s.d. are shown. DESeq2 was used to determine adjusted P-values.
g,h, Relative RNA-seq normalized reads of BCL2L1 and MCL1 in MCF7 shRB1 cells (g; n=2 independent cultures) and MDA-MB-468 (h, RB1 null; n=3 independent cultures) treated with DMSO or abemaciclib. Data are presented as mean ± s.d. DESeq2 was used to calculate adjusted P-values.
i, Relative Bcl2l1 expression by transcriptomic profiling of MMTV-rtTA/tetO-Her2 tumors treated with vehicle (n=23) or abemaciclib (n=25) for 12 days. Mean ± s.d. of normalized reads are shown. P-values were determined using a two-tailed unpaired t-test.
j, H3K27ac ChIP-seq tracks and co-localized H3K27ac-decorated genomic loops (identified by HiChIP) adjacent to BCL2L1 in MDA-MB-453 cells treated with DMSO or abemaciclib for 7 days. Gene promoters are highlighted in grey.
k, Western blot showing cleaved PARP in MCF7 cells treated with DMSO or abemaciclib (500 nM) for 3 days, followed by treatment with A1155463 (1 μM) for 24 hours and BYL719 (1 μM) for 8 hours as indicated. Representative blots of two independent experiments in MCF7. Western blots are cropped; uncropped blot images for the experiments in this figure are shown in Source Data Extended Data Fig. 4.
Extended Data Fig. 5. Effect of CDK4/6 inhibition on H3K27ac signal at transposable elements and on interferon-stimulated gene expression.
a, Fold change in H3K27ac signal at LTRs, LINEs, and SINEs identified by RepEnrich in MCF7 and MDA-MB-453 treated with DMSO or abemaciclib for 7 days (red, FC>1.5).
b, Cross-species conservation of a representative LTR enhancer activated by abemaciclib treatment in MCF7 cells.
c, GSEA using RNA-sequencing data from MCF7 cells treated with abemaciclib compared to DMSO for 7 days, or genome-wide transcriptomic profiling of PDX 14–07 tumors treated with abemaciclib compared with vehicle for 21–28 days.
d, GSEA using RNA-sequencing data from MCF7 cells treated with palbociclib compared to DMSO for 7 days. FDR q values in c, d were calculated by GSEAPreranked.
Extended Data Fig. 6. CDK4/6 inhibitor-activated LTR enhancers are predicted to regulate immune genes.
a, Gene Ontology analysis of interferon-related signatures using genes predicted to be regulated by all abemaciclib-activated enhancers, abemaciclib-activated SEs, or abemaciclib-activated LTR enhancers in MCF7 cells treated with DMSO or abemaciclib for 7 days. Odds ratios and P-values calculated by ChIP-Enrich.
b, ATAC-seq and H3K27ac ChIP-seq tracks near representative immune genes in MCF7 and MDA-MB-453 treated with DMSO or abemaciclib for 7 days. LTRs annotated using Repeat Masker are shown as blue bars. Yellow highlights indicate H3K27ac up-peaks that align with an LTR.
c, Relative RNA-seq normalized reads of immune genes in MCF7 parental and shRB1 cells treated with DMSO or abemaciclib for 7 days, measured by RNA-seq (parental: n=3; shRB1: n=2). Means ± s.d. are shown. DESeq2 was used to calculated adjusted P-values.
Extended Data Fig. 7. Effect of CDK4/6 inhibition on AP-1 gene expression.
a, Similarity (GIGGLE) scores between regions of increased H3K27ac signal genome-wide in MCF7 cells after palbociclib treatment and GEO-archived datasets of ChIP-seq for transcription factors (using “Cistrome Toolkit”). Top 20 factors identified are shown - AP-1 factors and steroid hormone receptors are labeled.
b, c, Relative RNA-seq normalized reads of AP-1 members in MCF7 and MDA-MB-453 (b), and in MCF7 shRB1 and MDA-MB-468 (c) treated with DMSO or abemaciclib (MCF7, MDA- MB-453, MDA-MB-468, n=3; MCF7 shRB1, n=2). Means ± s.d. are shown. DESeq2 was used to calculated adjusted P-values.
Extended Data Fig. 8. AP-1 binding increases at CDK4/6i-induced enhancers and drives transcriptional activity that can be reversed by an AP-1 inhibitor.
a, Composite profile of c-Jun, JunB, and Fra2 ChIP-seq signals in MCF7 cells treated with DMSO or abemaciclib over regions of abemaciclib-induced H3K27ac up-peaks.
b, H3K27ac, c-Jun, JunB, and Fra2 ChIP-seq tracks at PRICKLE2 and CDH1 loci in MCF7 cells treated with DMSO or abemaciclib. DNA loops (called by FDR<0.01) from H3K27ac HiChIP are depicted for PRICKLE2. Grey highlights indicate gene promoters. Green highlights indicate regions with abemaciclib-induced increases in both H3K27ac signal and c-Jun binding.
c, Composite profile of c-Jun ChIP-seq signal over abemaciclib-activated LTR enhancers in MCF7 cells treated with DMSO or abemaciclib.
d, H3K27ac, c-Jun, JunB, and Fra2 ChIP-seq tracks at RIPK2, HLA-C, and HLA-G loci in MCF7 cells treated with DMSO or abemaciclib. Green highlights as in b. LTRs annotated with Repeat Masker are shown in blue.
e, Heatmap of H3K27ac, c-Jun, JunB, Fra2, and estrogen receptor (ER) ChIP-seq profiles at regions showing increased binding for any of c-Jun, JunB, or Fra2 (combined) after 7 days of abemaciclib treatment in MCF7 cells. The cluster “ER” denotes regions with increased ER binding after abemaciclib treatment and contains 1,124 regions. The cluster “no ER or ER unchanged” denotes regions with no change in ER binding or no ER at all and contains 14,504 regions.
f, Analysis of GSEA signatures associated with luminal differentiation and interferon response using Principle Component 2 loadings from Fig. 7c. NES and FDR q values were calculated using GSEAPreranked.
Extended Data Fig. 9. Patterns of enhancer activation in breast cancers treated with combined CDK4/6 inhibition and endocrine therapy.
a, ChIP-Enrich analysis of regions gaining H3K27ac in MCF7 cells treated with abemaciclib plus fulvestrant (100 nM) versus DMSO for 7 days.
b, Composite profiles of H3K27ac ChIP-seq signal from patient biopsies (baseline and tamoxifen + palbociclib, as in Fig. 8a), centered over ATAC peak-intersected, abemaciclib-induced H3K27ac up-peaks in MCF7 cells.
c, H3K27ac ChIP-seq tracks at CDH1 and BCL2L1 from MCF7 cells and tumor biopsies from same patient as in b.
d, H3K27ac ChIP-seq tracks at MKI67 and TOP2A from tumor biopsies from same patient as in b.
Supplementary Material
Acknowledgments
This work is supported by the National Health and Medical Research Council of Australia (Investigator Grant GNT1177357 to S.G.); Susan G. Komen for the Cure (to I.K., to M.B., and CCR18547966 to S.G.); the Breast Cancer Alliance (Young Investigator Grant to S.G.); the Royal Australasian College of Physicians (Research Establishment Fellowship to S.G.); Eli Lilly and Co (to S.G.); the NIH/NCI (P50 CA168504 to S.G., I.K., E.W., and J.J.Z.; R35 CA210057 to J.J.Z.; P50 CA165962-06A1 to J.J.Z.; P01CA080111 to M.B; R01CA193910 to M.L.F; R02HG005220 to K.D.K. (PI Rafael A. Irizarry), R01GM083084 to K.D.K. (PI Rafael A. Irizarry), U41HG004059 to K.D.K. (PI Martin T. Morgan)); the United States Department of Defense CDMRP (W81XWH-18-1-0491 to J.J.Z); the Breast Cancer Research Foundation (BCRF-18-179 to J.J.Z.; to O.M.-F.), the Ministry of Economy and Competitiveness (Instituto de Salud Carlos III) PI18-01604 to P.C.; the Chan Zuckerberg Initiative (DAF grant 2018-183142 to K.D.K. (PI Rafael A. Irizarry)); Stand Up To Cancer (SU2C) and The V Foundation (TVF) SU2C-TVF Convergence Scholar Awards (D2015-037 to J.M.); Ramon y Cajal Programme, Ministerio de Economia y Competitividad (RYC-2015-18357 to J.M.); Terri Brodeur Breast Cancer Foundation (to V.W.D.); and the European Union’s Horizon 2020 research and innovation programme (Marie Skłodowska-Curie grant agreement No. 754490 to C.G. and the MINDED project).
Footnotes
Competing Interests Statement
S.G. is the recipient of research funding from Eli Lilly and Co which has been used to support a part of this work. S.G. has served as a paid advisory board member for Eli Lilly and Co, G1 Therapeutics, Pfizer, and Novartis. S.G. also conducts laboratory research sponsored by G1 Therapeutics and clinical research sponsored by Eli Lilly and Co and by Novartis. J.J.Z. is founder and board director of Crimson Biotech and Geode Therapeutics. J.M. is a consultant for Oncoheroes Biosciences and Vivid Biosciences. M.B. receives sponsored research support from Novartis. M.B. is a consultant to H3 Biomedicine and serves on the SAB of Kronos Bio and GV20 Therapeutics. C.M. is a consultant for Pfizer, Novartis, Seattle Genetics and Eli Lilly and Co and receives institutional research funding from Pfizer and Puma. I.K. receives institutional research funding and grants from Genentech/Roche and Pfizer. I.K. is an advisory board participant, consultant, and has received honoraria from Daiichi/Sankyo, Macrogenics, and Genentech/Roche. I.K. is an advisory board participant and has received honoraria from Context Therapeutics, Taiho Oncology, and Seattle Genetics. I.K. is a data monitoring board member at Novartis. E.W. is a consultant at and has received honoraria from Carrick Therapeutics, DragonFly, Genentech/Roche, Genomic Health, GSK, Jounce, Eli Lilly and Co, Seattle Genetics, and Merck. E.W. is a scientific advisory board member and has received honoraria from Leap. M.E. has patents and receives royalties from prosigna/Nanostring. O. M.-F. receives institutional research funding from AbbVie, Genentech, Roche, and Pfizer, and has received honoraria from Roche. M.A.D. has been a member of the advisory boards for CTX CRC, Storm Therapeutics, Celgene and Cambridge Epigenetix. The Dawson lab receives research funding from CTX CRC. All other authors declare no conflicts of interest.
References
- 1.Sherr CJ, Beach D. & Shapiro GI Targeting CDK4 and CDK6: From Discovery to Therapy. Cancer discovery 6, 353–367, doi: 10.1158/2159-8290.CD-15-0894 (2016). [DOI] [PMC free article] [PubMed] [Google Scholar]
- 2.Spring LM et al. Cyclin-dependent kinase 4 and 6 inhibitors for hormone receptor-positive breast cancer: past, present, and future. Lancet 395, 817–827, doi: 10.1016/S0140-6736(20)30165-3 (2020). [DOI] [PubMed] [Google Scholar]
- 3.Finn RS et al. PD 0332991, a selective cyclin D kinase 4/6 inhibitor, preferentially inhibits proliferation of luminal estrogen receptor-positive human breast cancer cell lines in vitro. Breast cancer research : BCR 11, R77, doi: 10.1186/bcr2419 (2009). [DOI] [PMC free article] [PubMed] [Google Scholar]
- 4.Goel S. et al. Overcoming Therapeutic Resistance in HER2-Positive Breast Cancers with CDK4/6 Inhibitors. Cancer cell 29, 255–269, doi: 10.1016/j.ccell.2016.02.006 (2016). [DOI] [PMC free article] [PubMed] [Google Scholar]
- 5.Herrera-Abreu MT et al. Early Adaptation and Acquired Resistance to CDK4/6 Inhibition in Estrogen Receptor-Positive Breast Cancer. Cancer research 76, 2301–2313, doi: 10.1158/0008-5472.CAN-15-0728 (2016). [DOI] [PMC free article] [PubMed] [Google Scholar]
- 6.Goel S. et al. CDK4/6 inhibition triggers anti-tumour immunity. Nature 548, 471–475, doi: 10.1038/nature23465 (2017). [DOI] [PMC free article] [PubMed] [Google Scholar]
- 7.Schaer DA et al. The CDK4/6 Inhibitor Abemaciclib Induces a T Cell Inflamed Tumor Microenvironment and Enhances the Efficacy of PD-L1 Checkpoint Blockade. Cell Rep 22, 2978–2994, doi: 10.1016/j.celrep.2018.02.053 (2018). [DOI] [PubMed] [Google Scholar]
- 8.Hurvitz S. et al. Biological effects of abemaciclib in a phase 2 neoadjuvant study for postmenopausal patients with HR+, HER2- breast cancer [abstract]. . Cancer research 77 (4 Suppl), Abstract nr S4–06 (2017). [Google Scholar]
- 9.Choi YJ et al. The requirement for cyclin D function in tumor maintenance. Cancer cell 22, 438–451, doi: 10.1016/j.ccr.2012.09.015 (2012). [DOI] [PMC free article] [PubMed] [Google Scholar]
- 10.Yoshida A, Lee EK & Diehl JA Induction of Therapeutic Senescence in Vemurafenib-Resistant Melanoma by Extended Inhibition of CDK4/6. Cancer research 76, 2990–3002, doi: 10.1158/0008-5472.CAN-15-2931 (2016). [DOI] [PMC free article] [PubMed] [Google Scholar]
- 11.Narita M. et al. Rb-mediated heterochromatin formation and silencing of E2F target genes during cellular senescence. Cell 113, 703–716 (2003). [DOI] [PubMed] [Google Scholar]
- 12.Shay JW, Pereira-Smith OM & Wright WE A role for both RB and p53 in the regulation of human cellular senescence. Experimental cell research 196, 33–39 (1991). [DOI] [PubMed] [Google Scholar]
- 13.Munoz-Espin D. & Serrano M. Cellular senescence: from physiology to pathology. Nature reviews. Molecular cell biology 15, 482–496, doi: 10.1038/nrm3823 (2014). [DOI] [PubMed] [Google Scholar]
- 14.Tasdemir N. et al. BRD4 Connects Enhancer Remodeling to Senescence Immune Surveillance. Cancer discovery 6, 612–629, doi: 10.1158/2159-8290.CD-16-0217 (2016). [DOI] [PMC free article] [PubMed] [Google Scholar]
- 15.Sen P. et al. Histone Acetyltransferase p300 Induces De Novo Super-Enhancers to Drive Cellular Senescence. Mol Cell 73, 684–698 e688, doi: 10.1016/j.molcel.2019.01.021 (2019). [DOI] [PMC free article] [PubMed] [Google Scholar]
- 16.Buenrostro JD, Giresi PG, Zaba LC, Chang HY & Greenleaf WJ Transposition of native chromatin for fast and sensitive epigenomic profiling of open chromatin, DNA-binding proteins and nucleosome position. Nat Methods 10, 1213–1218, doi: 10.1038/nmeth.2688 (2013). [DOI] [PMC free article] [PubMed] [Google Scholar]
- 17.McLean CY et al. GREAT improves functional interpretation of cis-regulatory regions. Nat Biotechnol 28, 495–501, doi: 10.1038/nbt.1630 (2010). [DOI] [PMC free article] [PubMed] [Google Scholar]
- 18.Chicas A. et al. H3K4 demethylation by Jarid1a and Jarid1b contributes to retinoblastoma-mediated gene silencing during cellular senescence. Proceedings of the National Academy of Sciences of the United States of America 109, 8971–8976, doi: 10.1073/pnas.1119836109 (2012). [DOI] [PMC free article] [PubMed] [Google Scholar]
- 19.Cejas P. et al. Chromatin immunoprecipitation from fixed clinical tissues reveals tumor-specific enhancer profiles. Nature medicine 22, 685–691, doi: 10.1038/nm.4085 (2016). [DOI] [PubMed] [Google Scholar]
- 20.Font-Tello A. et al. FiTAc-seq: fixed-tissue ChIP-seq for H3K27ac profiling and super-enhancer analysis of FFPE tissues. Nat Protoc 15, 2503–2518, doi: 10.1038/s41596-020-0340-6 (2020). [DOI] [PubMed] [Google Scholar]
- 21.Mumbach MR et al. HiChIP: efficient and sensitive analysis of protein-directed genome architecture. Nat Methods 13, 919–922, doi: 10.1038/nmeth.3999 (2016). [DOI] [PMC free article] [PubMed] [Google Scholar]
- 22.Wang S. et al. Target analysis by integration of transcriptome and ChIP-seq data with BETA. Nature protocols 8, 2502–2515, doi: 10.1038/nprot.2013.150 (2013). [DOI] [PMC free article] [PubMed] [Google Scholar]
- 23.Whyte WA et al. Master transcription factors and mediator establish super-enhancers at key cell identity genes. Cell 153, 307–319, doi: 10.1016/j.cell.2013.03.035 (2013). [DOI] [PMC free article] [PubMed] [Google Scholar]
- 24.Loven J. et al. Selective inhibition of tumor oncogenes by disruption of super-enhancers. Cell 153, 320–334, doi: 10.1016/j.cell.2013.03.036 (2013). [DOI] [PMC free article] [PubMed] [Google Scholar]
- 25.Welch RP et al. ChIP-Enrich: gene set enrichment testing for ChIP-seq data. Nucleic acids research 42, e105, doi: 10.1093/nar/gku463 (2014). [DOI] [PMC free article] [PubMed] [Google Scholar]
- 26.Fu NY et al. Foxp1 Is Indispensable for Ductal Morphogenesis and Controls the Exit of Mammary Stem Cells from Quiescence. Dev Cell 47, 629–644 e628, doi: 10.1016/j.devcel.2018.10.001 (2018). [DOI] [PubMed] [Google Scholar]
- 27.Hong D. et al. Runx1 stabilizes the mammary epithelial cell phenotype and prevents epithelial to mesenchymal transition. Oncotarget 8, 17610–17627, doi: 10.18632/oncotarget.15381 (2017). [DOI] [PMC free article] [PubMed] [Google Scholar]
- 28.Sengupta S. & George RE Super-Enhancer-Driven Transcriptional Dependencies in Cancer. Trends Cancer 3, 269–281, doi: 10.1016/j.trecan.2017.03.006 (2017). [DOI] [PMC free article] [PubMed] [Google Scholar]
- 29.Montero J. et al. Drug-induced death signaling strategy rapidly predicts cancer response to chemotherapy. Cell 160, 977–989, doi: 10.1016/j.cell.2015.01.042 (2015). [DOI] [PMC free article] [PubMed] [Google Scholar]
- 30.Del Gaizo Moore V. & Letai A. BH3 profiling--measuring integrated function of the mitochondrial apoptotic pathway to predict cell fate decisions. Cancer Lett 332, 202–205, doi: 10.1016/j.canlet.2011.12.021 (2013). [DOI] [PMC free article] [PubMed] [Google Scholar]
- 31.De Cecco M. et al. Genomes of replicatively senescent cells undergo global epigenetic changes leading to gene silencing and activation of transposable elements. Aging Cell 12, 247–256, doi: 10.1111/acel.12047 (2013). [DOI] [PMC free article] [PubMed] [Google Scholar]
- 32.Criscione SW, Zhang Y, Thompson W, Sedivy JM & Neretti N. Transcriptional landscape of repetitive elements in normal and cancer human cells. BMC Genomics 15, 583, doi: 10.1186/1471-2164-15-583 (2014). [DOI] [PMC free article] [PubMed] [Google Scholar]
- 33.Fuentes DR, Swigut T. & Wysocka J. Systematic perturbation of retroviral LTRs reveals widespread long-range effects on human gene regulation. Elife 7, doi: 10.7554/eLife.35989 (2018). [DOI] [PMC free article] [PubMed] [Google Scholar]
- 34.Chuong EB, Elde NC & Feschotte C. Regulatory evolution of innate immunity through co-option of endogenous retroviruses. Science 351, 1083–1087, doi: 10.1126/science.aad5497 (2016). [DOI] [PMC free article] [PubMed] [Google Scholar]
- 35.Zheng R. et al. Cistrome Data Browser: expanded datasets and new tools for gene regulatory analysis. Nucleic acids research 47, D729–D735, doi: 10.1093/nar/gky1094 (2019). [DOI] [PMC free article] [PubMed] [Google Scholar]
- 36.Pellacani D. et al. Analysis of Normal Human Mammary Epigenomes Reveals Cell-Specific Active Enhancer States and Associated Transcription Factor Networks. Cell Rep 17, 2060–2074, doi: 10.1016/j.celrep.2016.10.058 (2016). [DOI] [PubMed] [Google Scholar]
- 37.Dravis C. et al. Epigenetic and Transcriptomic Profiling of Mammary Gland Development and Tumor Models Disclose Regulators of Cell State Plasticity. Cancer cell 34, 466–482 e466, doi: 10.1016/j.ccell.2018.08.001 (2018). [DOI] [PMC free article] [PubMed] [Google Scholar]
- 38.Nead MA, Baglia LA, Antinore MJ, Ludlow JW & McCance DJ Rb binds c-Jun and activates transcription. EMBO J 17, 2342–2352, doi: 10.1093/emboj/17.8.2342 (1998). [DOI] [PMC free article] [PubMed] [Google Scholar]
- 39.Nishitani J. et al. Recruitment of the retinoblastoma protein to c-Jun enhances transcription activity mediated through the AP-1 binding site. J Biol Chem 274, 5454–5461, doi: 10.1074/jbc.274.9.5454 (1999). [DOI] [PubMed] [Google Scholar]
- 40.Angel P, Hattori K, Smeal T. & Karin M. The jun proto-oncogene is positively autoregulated by its product, Jun/AP-1. Cell 55, 875–885, doi: 10.1016/0092-8674(88)90143-2 (1988). [DOI] [PubMed] [Google Scholar]
- 41.Fanjul A. et al. A new class of retinoids with selective inhibition of AP-1 inhibits proliferation. Nature 372, 107–111, doi: 10.1038/372107a0 (1994). [DOI] [PubMed] [Google Scholar]
- 42.Ma CX et al. NeoPalAna: Neoadjuvant Palbociclib, a Cyclin-Dependent Kinase 4/6 Inhibitor, and Anastrozole for Clinical Stage 2 or 3 Estrogen Receptor-Positive Breast Cancer. Clinical cancer research : an official journal of the American Association for Cancer Research 23, 4055–4065, doi: 10.1158/1078-0432.CCR-16-3206 (2017). [DOI] [PMC free article] [PubMed] [Google Scholar]
- 43.Haines E. et al. Palbociclib resistance confers dependence on an FGFR-MAP kinase-mTOR-driven pathway in KRAS-mutant non-small cell lung cancer. Oncotarget 9, 31572–31589, doi: 10.18632/oncotarget.25803 (2018). [DOI] [PMC free article] [PubMed] [Google Scholar]
- 44.Walter DM et al. RB constrains lineage fidelity and multiple stages of tumour progression and metastasis. Nature, doi: 10.1038/s41586-019-1172-9 (2019). [DOI] [PMC free article] [PubMed] [Google Scholar]
Methods-only References
- 45.Leverson JD et al. Exploiting selective BCL-2 family inhibitors to dissect cell survival dependencies and define improved strategies for cancer therapy. Sci Transl Med 7, 279ra240, doi: 10.1126/scitranslmed.aaa4642 (2015). [DOI] [PubMed] [Google Scholar]
- 46.Corces MR et al. An improved ATAC-seq protocol reduces background and enables interrogation of frozen tissues. Nat Methods 14, 959–962, doi: 10.1038/nmeth.4396 (2017). [DOI] [PMC free article] [PubMed] [Google Scholar]
- 47.Buenrostro JD, Wu B, Chang HY & Greenleaf WJ ATAC-seq: A Method for Assaying Chromatin Accessibility Genome-Wide. Curr Protoc Mol Biol 109, 21 29 21–29, doi: 10.1002/0471142727.mb2129s109 (2015). [DOI] [PMC free article] [PubMed] [Google Scholar]
- 48.Savic D, Gertz J, Jain P, Cooper GM & Myers RM Mapping genome-wide transcription factor binding sites in frozen tissues. Epigenetics Chromatin 6, 30, doi: 10.1186/1756-8935-6-30 (2013). [DOI] [PMC free article] [PubMed] [Google Scholar]
- 49.Servant N. et al. HiC-Pro: an optimized and flexible pipeline for Hi-C data processing. Genome biology 16, 259, doi: 10.1186/s13059-015-0831-x (2015). [DOI] [PMC free article] [PubMed] [Google Scholar]
- 50.Subramanian A. et al. Gene set enrichment analysis: a knowledge-based approach for interpreting genome-wide expression profiles. Proc Natl Acad Sci U S A 102, 15545–15550, doi: 10.1073/pnas.0506580102 (2005). [DOI] [PMC free article] [PubMed] [Google Scholar]
- 51.Ritchie ME et al. limma powers differential expression analyses for RNA-sequencing and microarray studies. Nucleic acids research 43, e47, doi: 10.1093/nar/gkv007 (2015). [DOI] [PMC free article] [PubMed] [Google Scholar]
- 52.Qin Q. et al. ChiLin: a comprehensive ChIP-seq and DNase-seq quality control and analysis pipeline. BMC Bioinformatics 17, 404, doi: 10.1186/s12859-016-1274-4 (2016). [DOI] [PMC free article] [PubMed] [Google Scholar]
- 53.Li H. & Durbin R. Fast and accurate short read alignment with Burrows-Wheeler transform. Bioinformatics 25, 1754–1760, doi: 10.1093/bioinformatics/btp324 (2009). [DOI] [PMC free article] [PubMed] [Google Scholar]
- 54.Zhang Y. et al. Model-based analysis of ChIP-Seq (MACS). Genome biology 9, R137, doi: 10.1186/gb-2008-9-9-r137 (2008). [DOI] [PMC free article] [PubMed] [Google Scholar]
- 55.Shin H, Liu T, Manrai AK & Liu XS CEAS: cis-regulatory element annotation system. Bioinformatics 25, 2605–2606, doi: 10.1093/bioinformatics/btp479 (2009). [DOI] [PubMed] [Google Scholar]
- 56.Quinlan AR & Hall IM BEDTools: a flexible suite of utilities for comparing genomic features. Bioinformatics 26, 841–842, doi: 10.1093/bioinformatics/btq033 (2010). [DOI] [PMC free article] [PubMed] [Google Scholar]
- 57.Ramirez F, Dundar F, Diehl S, Gruning BA & Manke T. deepTools: a flexible platform for exploring deep-sequencing data. Nucleic acids research 42, W187–191, doi: 10.1093/nar/gku365 (2014). [DOI] [PMC free article] [PubMed] [Google Scholar]
- 58.Cornwell M. et al. VIPER: Visualization Pipeline for RNA-seq, a Snakemake workflow for efficient and complete RNA-seq analysis. BMC Bioinformatics 19, 135, doi: 10.1186/s12859-018-2139-9 (2018). [DOI] [PMC free article] [PubMed] [Google Scholar]
- 59.Dobin A. et al. STAR: ultrafast universal RNA-seq aligner. Bioinformatics 29, 15–21, doi: 10.1093/bioinformatics/bts635 (2013). [DOI] [PMC free article] [PubMed] [Google Scholar]
- 60.Love MI, Huber W. & Anders S. Moderated estimation of fold change and dispersion for RNA-seq data with DESeq2. Genome biology 15, 550, doi: 10.1186/s13059-014-0550-8 (2014). [DOI] [PMC free article] [PubMed] [Google Scholar]
- 61.Robinson MD, McCarthy DJ & Smyth GK edgeR: a Bioconductor package for differential expression analysis of digital gene expression data. Bioinformatics 26, 139–140, doi: 10.1093/bioinformatics/btp616 (2010). [DOI] [PMC free article] [PubMed] [Google Scholar]
- 62.Ay F, Bailey TL & Noble WS Statistical confidence estimation for Hi-C data reveals regulatory chromatin contacts. Genome research 24, 999–1011, doi: 10.1101/gr.160374.113 (2014). [DOI] [PMC free article] [PubMed] [Google Scholar]
- 63.Langmead B, Trapnell C, Pop M. & Salzberg SL Ultrafast and memory-efficient alignment of short DNA sequences to the human genome. Genome biology 10, R25, doi: 10.1186/gb-2009-10-3-r25 (2009). [DOI] [PMC free article] [PubMed] [Google Scholar]
- 64.Bhattacharyya S, Chandra V, Vijayanand P. & Ay F. Identification of significant chromatin contacts from HiChIP data by FitHiChIP. Nat Commun 10, 4221, doi: 10.1038/s41467-019-11950-y (2019). [DOI] [PMC free article] [PubMed] [Google Scholar]
Associated Data
This section collects any data citations, data availability statements, or supplementary materials included in this article.
Supplementary Materials
Data Availability Statement
ATAC-seq, ChIP-seq, RNA-seq, and HiChIP data that support the findings of this study have been deposited into the Gene Expression Omnibus (GEO) repository under accession codes GSE157097, GSE157082, GSE157222, GSE157218, GSE157216, GSE157214, GSE157211, GSE157385, GSE157384, GSE157383, and GSE157381. Previously deposited transcriptomic data (GSE990626, GSE9320442) that are used in this study are also available at Gene Expression Omnibus4. Source data for Fig. 4, 6 and Extended Data Fig. 1, 4 are provided with this paper. All other data that support the findings of this study are available from the corresponding author upon reasonable request.


