Abstract
Channelized Hotelling observer (CHO), which has been shown to be well correlated with human observer performance in many clinical CT tasks, has a great potential to become the method of choice for objective image quality assessment. However, the use of CHO in clinical CT is still quite limited, mainly due to its complexity in measurement and calculation in practice, and the lack of access to an efficient and validated software tool for most clinical users. In this work, a web-based software platform for CT image quality assessment and protocol optimization (CTPro) was introduced. A validated CHO tool, along with other common image quality assessment tools, was made readily accessible through this web platform for clinical users and researchers without the need of installing additional software. An example of its application to evaluation of convolutional-neural-network (CNN)-based denoising was demonstrated.
Keywords: Image quality assessment, channelized Hotelling observer (CHO), protocol optimization, radiation dose reduction
1. INTRODUCTION
Accurate and quantitative methods for efficient and objective assessment of CT image quality are essential to ensure that radiation dose reduction does not inadvertently sacrifice important diagnostic information [1]. Some traditional metrics exist, but they do not generalize properly for non-linear methods such as iterative reconstruction (IR) and deep-learning-based noise reduction [2, 3]. Tremendous progress towards task-based image quality assessment using CHO has been made during the past decade [4–8]. Its correlation with human observer performance in low-contrast detection, classification and localization tasks in clinical CT has been demonstrated [8–13]. Studies have been performed to improve its computational efficiency and inter-laboratory variation [14, 15]. CHO-based image quality assessment has been shown to avoid clinically significant diagnostic errors [16]. Despite this progress, the use of CHO is still quite limited in clinical CT, mainly due to its complexity in measurement and calculation in routine practice, and the lack of access to an efficient and validated software tool for most clinical users. Based on our extensive validation studies [8–13], we developed a highly automated solution – CT PRotocol Optimization (CTPro) software, and successfully demonstrated its performance on CT diagnosis and dose optimization [17]. In this work, we propose to encapsulate this software on a web-based platform that includes CHO and other traditional image quality assessment tools, so that it could become readily accessible to a broader range of CT researchers and clinical users.
2. METHODS
2.1. Overall design of a web-based platform
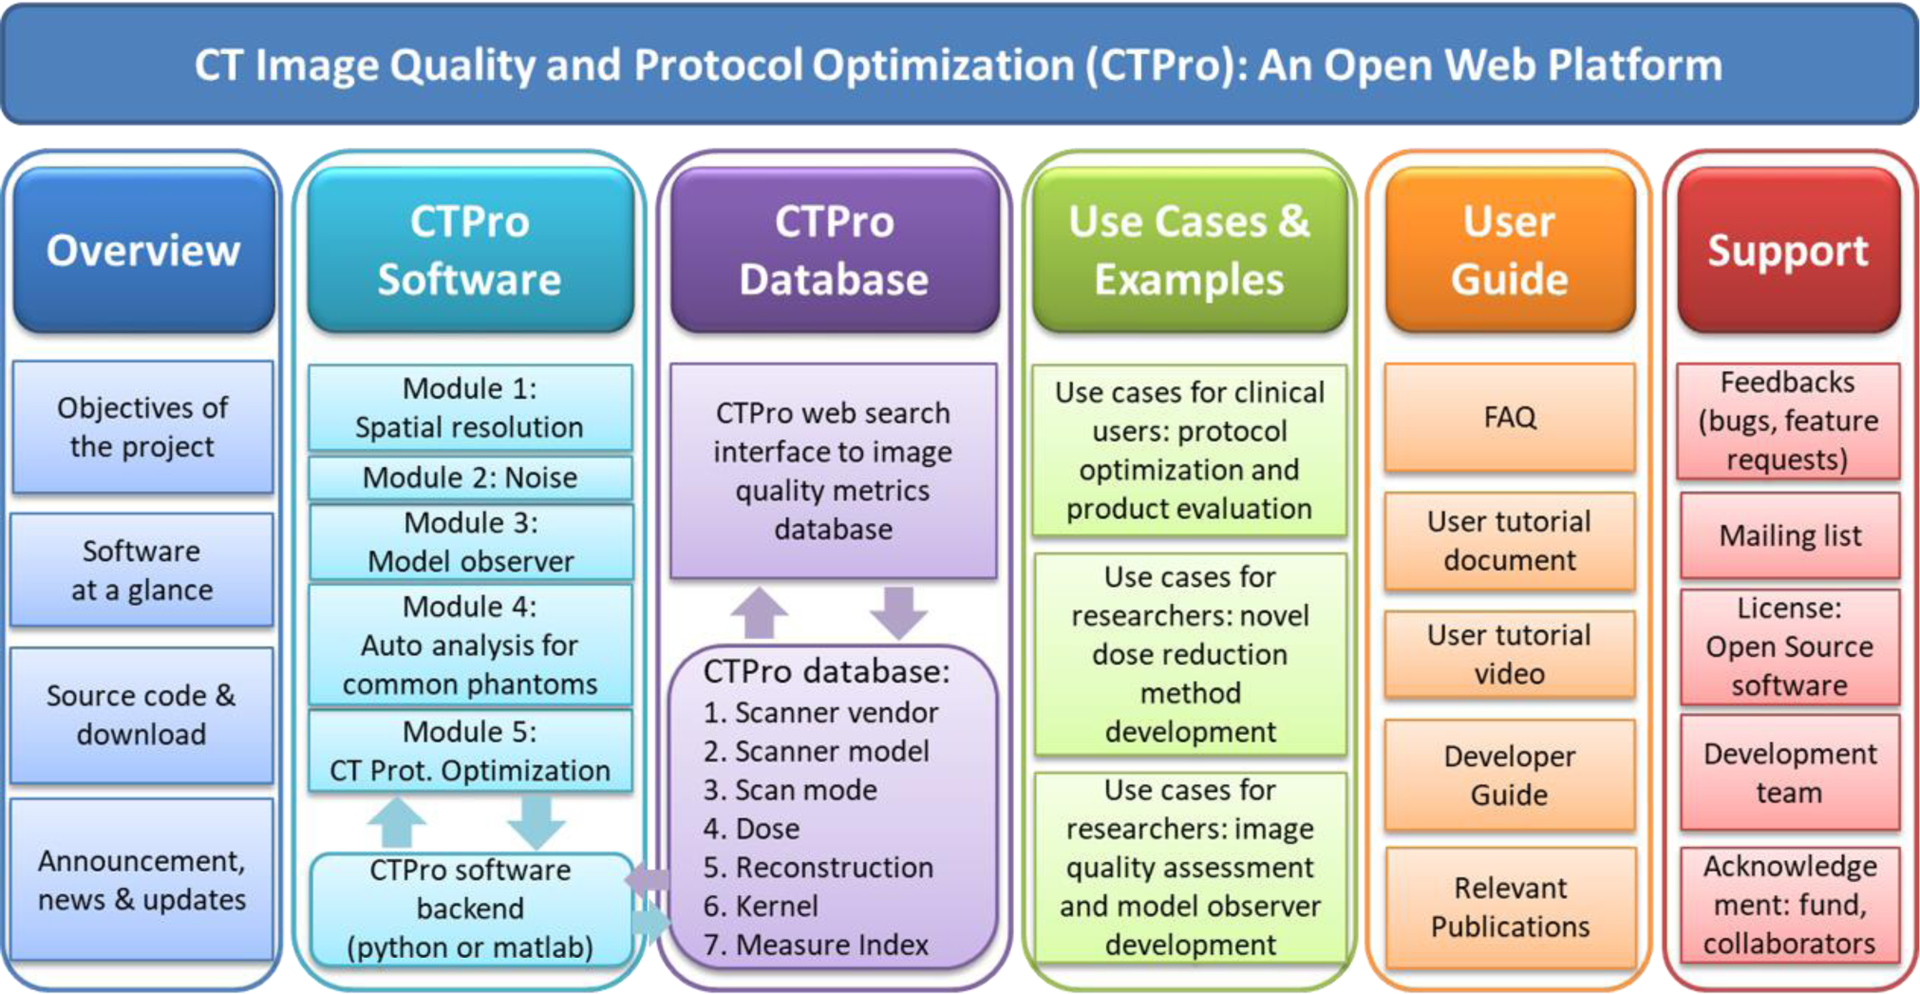
A major advantage of the web-based platform is its accessibility: any user using a web browser can access and run CTPro modules without the need of installing additional software. A variety of web frameworks such as PHP, ASP.NET, Django, Node.JS and programming languages (e.g., JavaScript, Perl, and Python) exist today for the development of web-based platforms. Many of these technologies are highly customizable and scalable. In this work, we selected JavaScript for our frontend website design with the charts generated using ChartJS. As shown in Figure 1, the CTPro website contains six major sections. The overview displays the introduction of the project, software overview, source code and download, and announcement. The source code of the basic image quality evaluation tools will be made public and downloadable to facilitate collaboration among the CT community. The software section serves as the web-interface to the software backend, which contains various modules for image quality evaluation and protocol optimization, including the evaluation of spatial resolution, noise, CHO-based low-contrast detectability, quality analysis for common phantoms, and CT protocol optimization. The database section provides an interface to query data from our relational database which stores the image data and the evaluation results data for different scanners, dose levels, reconstruction methods, etc. This database makes it possible for the clinical users and researchers to compare evaluation performance with different sets of data on a common platform. The example section comprises past cases of the CTPro software being applied to studies like protocol optimization, development of model observer, and examination of new dose reduction method. The guide section provides the users with tutorials documents and video guide for users who are interested in using the web-based platform and contributing to the software tools or database. The support section allows the users to report issues and request new features.
Figure 1.

Overall design of the CTPro web-based platform for CT image quality assessment and protocol optimization. The website contains six major sections: overview, CTPro software, CTPro database, uses cases and examples, user guide, and support.
2.2. CTPro software
The backend software modules are currently written in Matlab but will be transitioned to NodeJS with Express so that the software development and the website design can be written in a single language. Three software modules have been developed, 1) CHO for low-contrast evaluation, 2) noise power spectrum (NPS) for noise evaluation, and 3) modulation transfer function (MTF), contrast-dependent MTF, and slice sensitivity profile (SSP) for spatial resolution evaluation. In addition, a protocol optimization module and a common phantom analysis module will be included in the future. The CTPro software allows users to upload data from a local device or query data from the CTPro database. The assessment results from the CTPro software can be exported locally and be selectively written into the CTPro database for future query by other users who would like to compare performance across sites or scanner models.
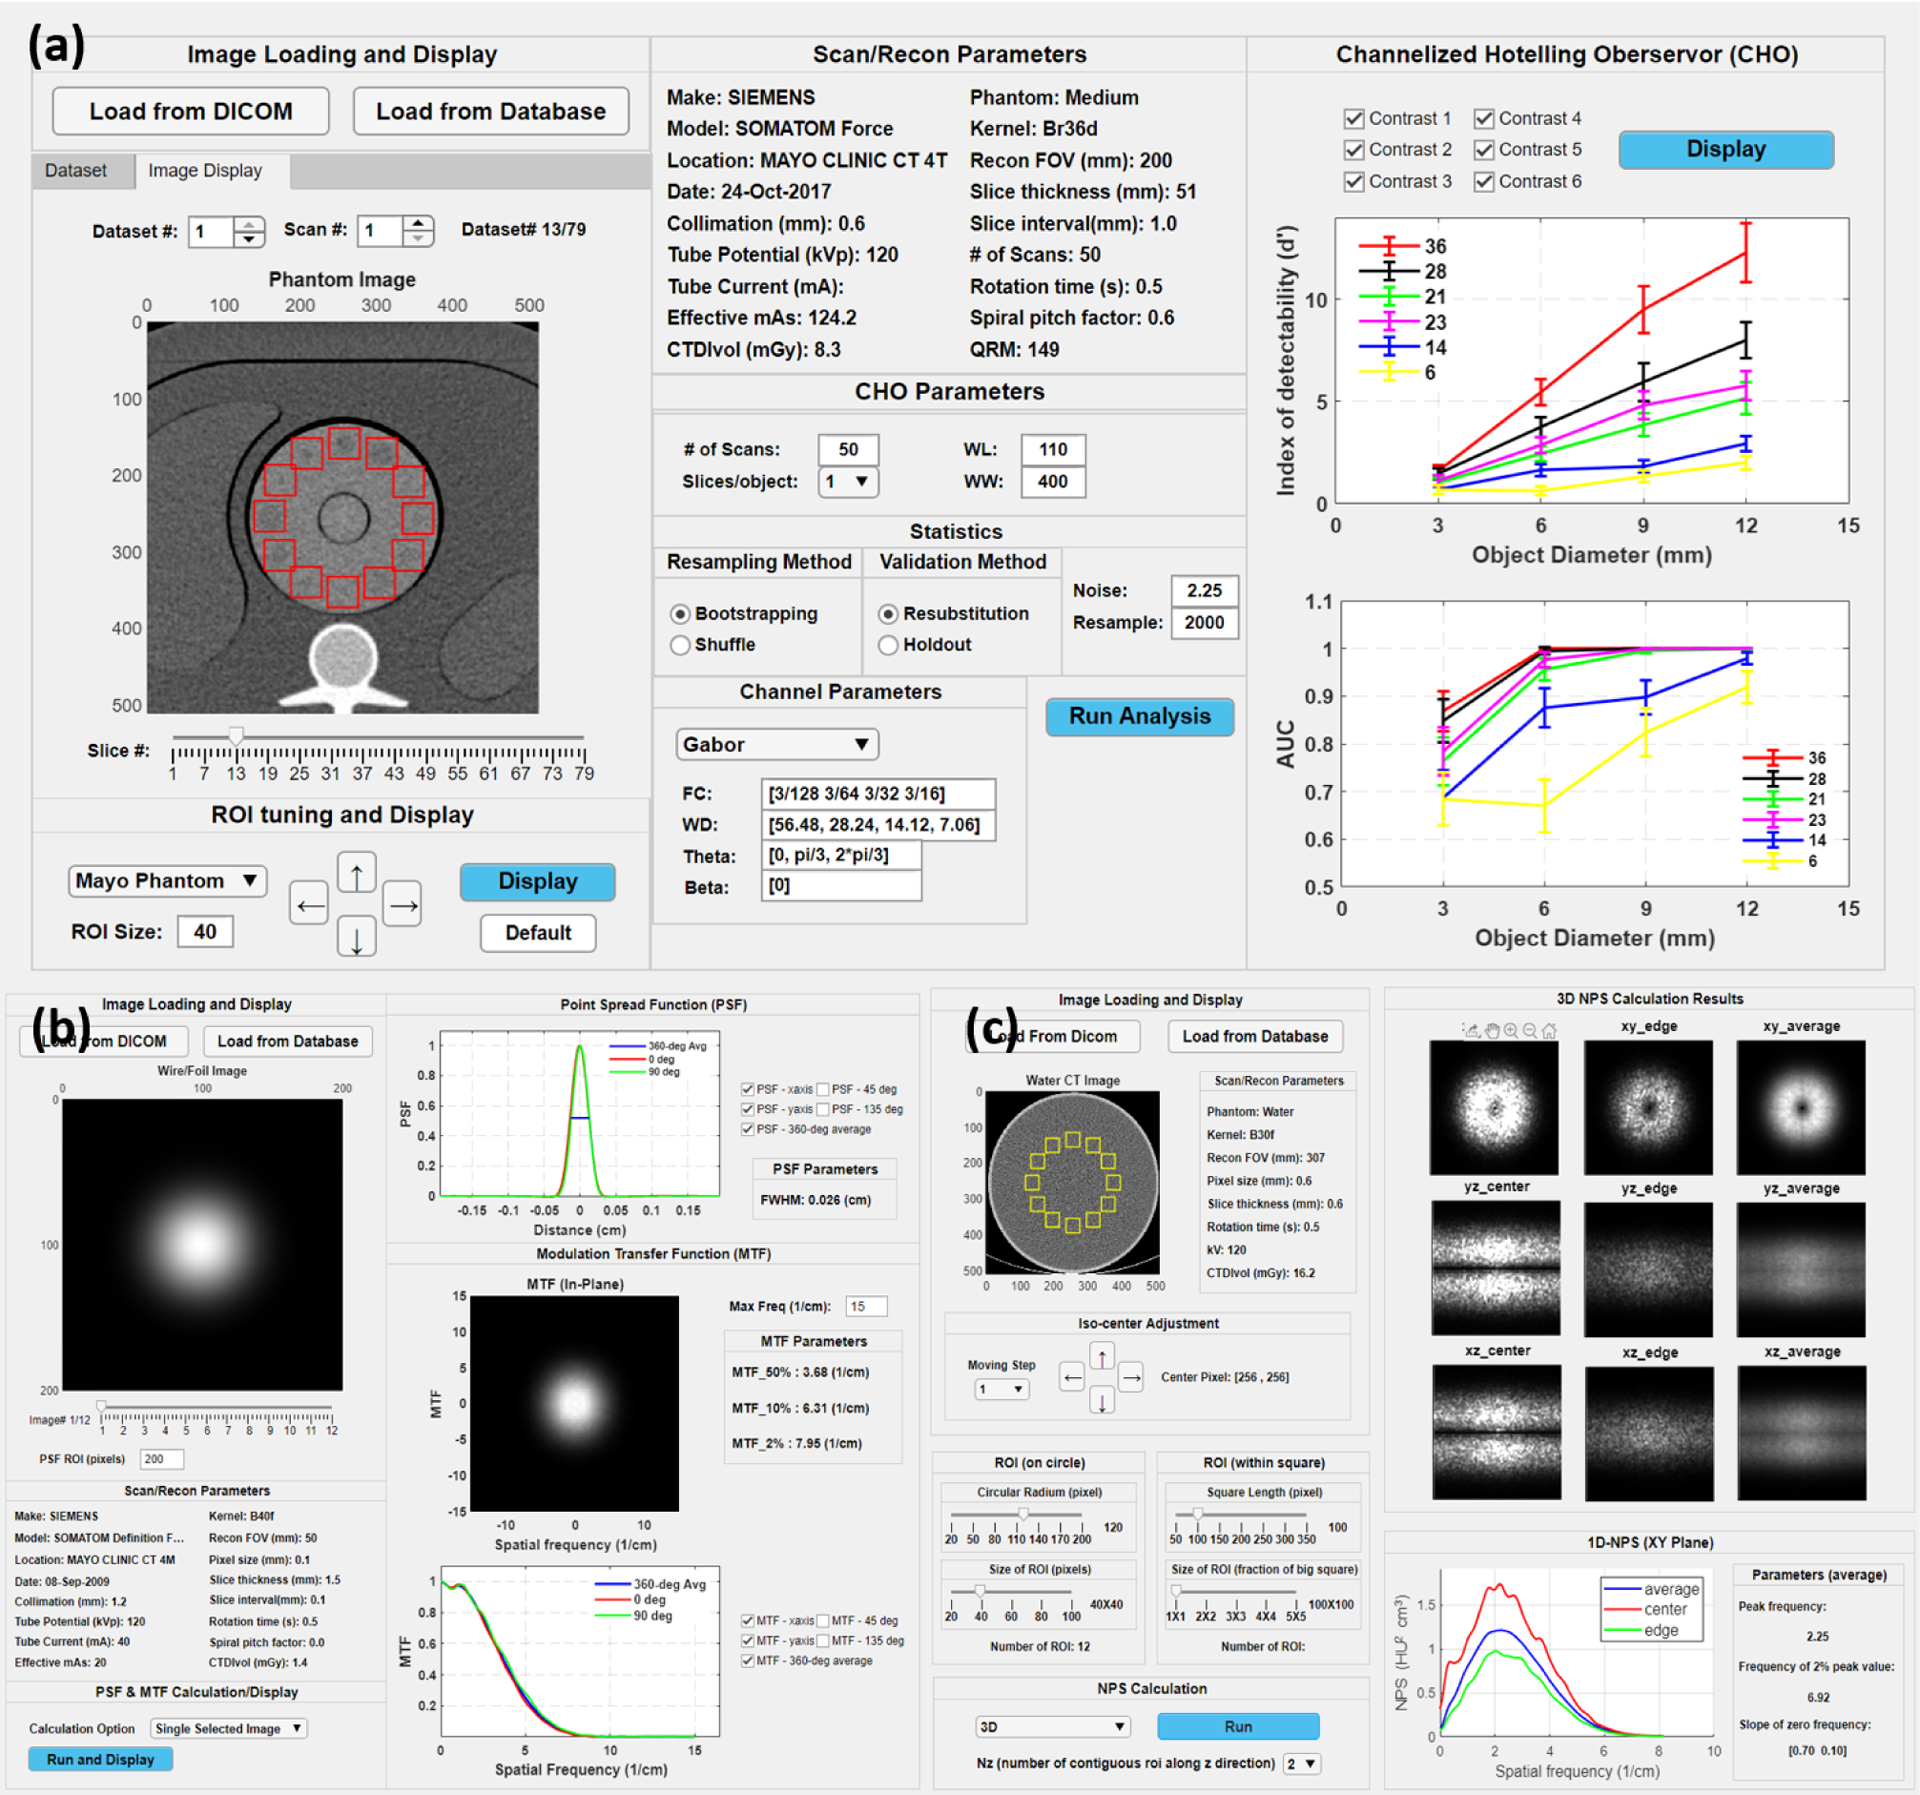
Figure 2 shows three use examples of the CTPro software. In the CHO module, after images are loaded the interactive user interface would display the images and selected information from the DICOM header. If more than one dataset is loaded, the spinner named ‘Dataset #’ would determine not only which dataset to display but also which ones to use in the CHO calculation. The default size and position of the ROI are pre-determined based on the selection of the phantom. Currently, the ACR phantom and a custom 3D printed phantom have been included, and other common low-contrast phantoms will be supported in the future. The ROI size and position can be adjusted. Users could configure numerous parameters for the CHO analysis, which includes number of repeated scans, number of slices per object, resampling method, validation method, internal noise level, number of resampling, and channel filter. Two channel filter options are currently provided, Gabor filter and Laguerre–Gauss filter [18]. The CHO module outputs two metrics, index of detectability (d’) and area under the ROC curve (AUC). The MTF module supports the use of common wire phantoms. The wire images are automatically centered and displayed after loading. The module can calculate the MTF from a single slice of the wire image as well as the average MTF from multi-slice images. The 1D in-plane point spread function (PSF) curve and the 1D MTF curve are displayed at the polar angle of 0, 45, 90, 135 degrees along with a 360-degree average. Some additional metrics, such as the full width at half maximum (FWHM), tenth maximum and fiftieth maximum, are also calculated and shown. The NPS module’s interface is designed in a very similar fashion but presents some unique features. It offers more flexibility in the choices of shape and size of the ROIs. In addition to the in-plane NPS evaluation of a single slice image and an average NPS over multiple slices, 3D NPS can also be visualized in different profiles. Quantitative metrics, such as peak frequency, frequency of the 2% peak value, and slope of the zero frequency, are shown alongside the 1D-NPS curve.
Figure 2.

Three CTPro software modules: (a) CHO, (b) MTF, and (c) NPS.
2.3. CTPro database
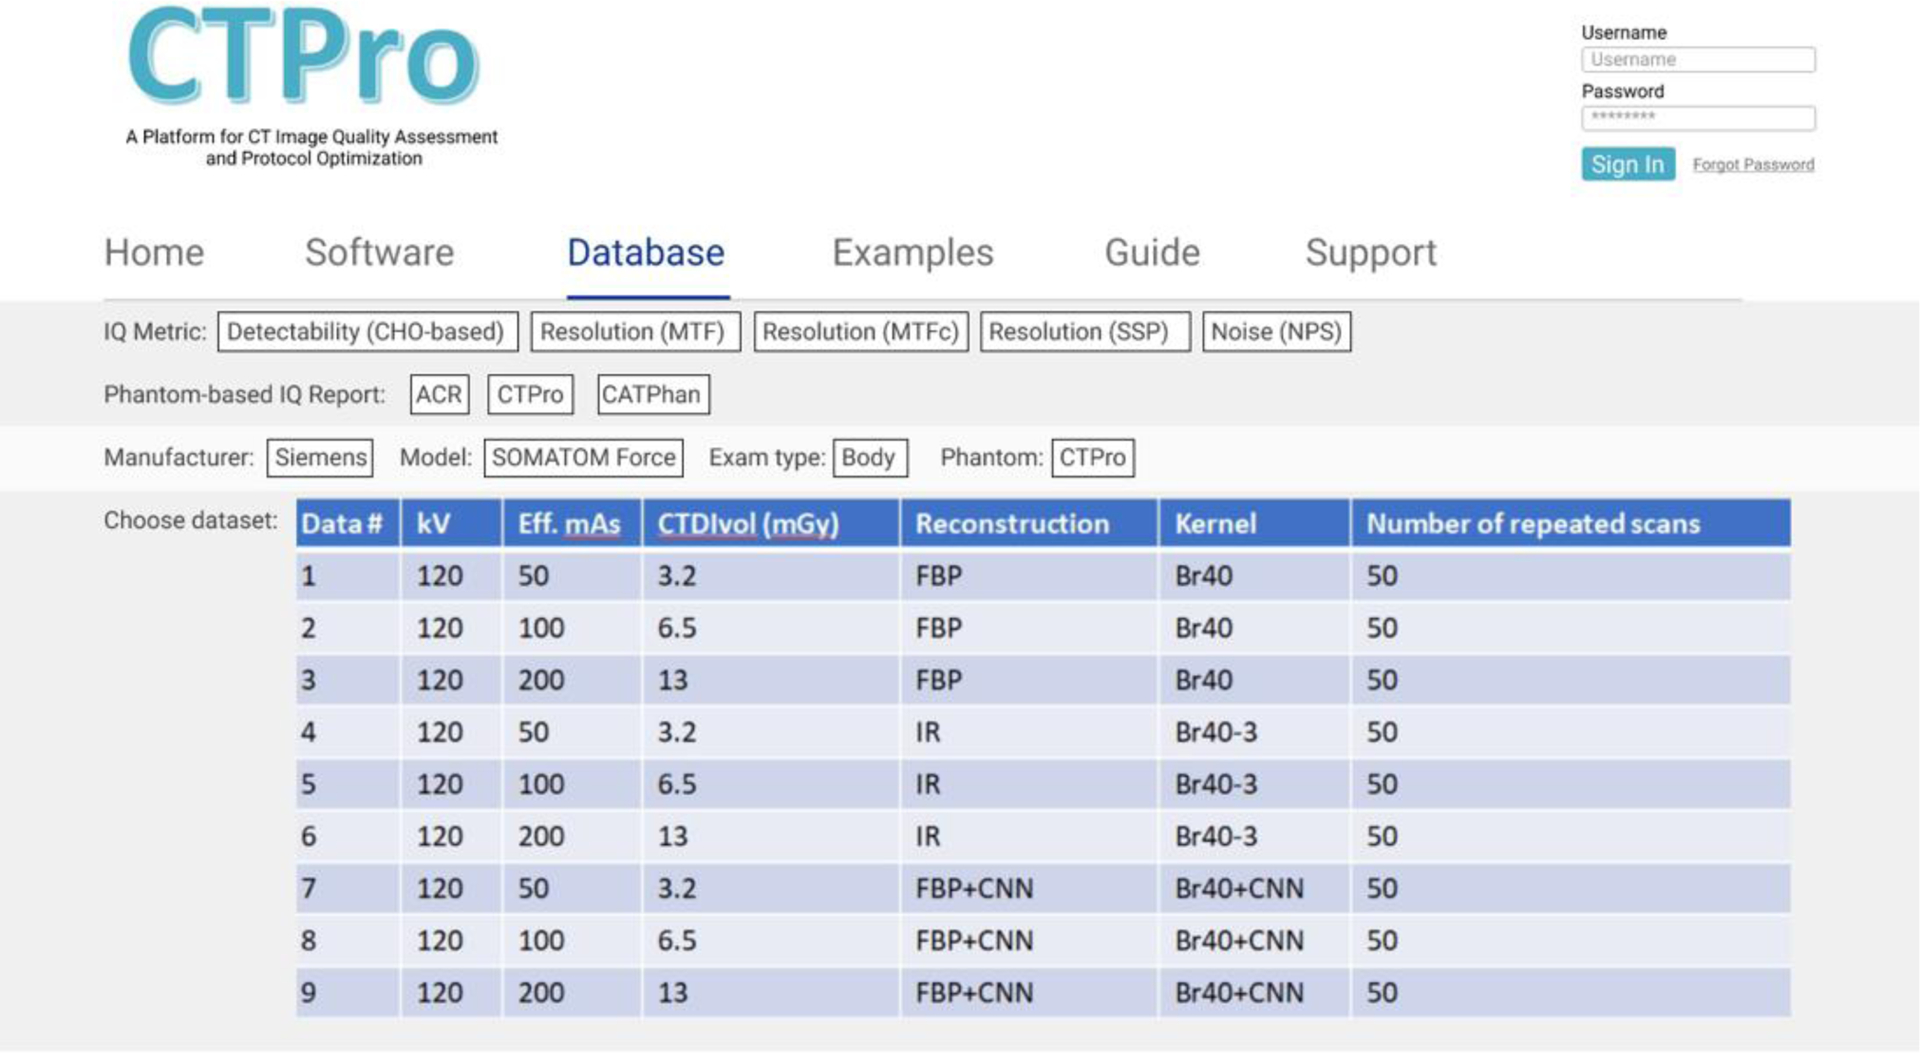
CTPro comprises two databases, one storing the image data and the other one the evaluation results calculated by the CTPro software for various scanner models, scanning protocols, reconstructions, and common phantoms. The data can be queried from the user interface on the CTPro website to visualize both the images and the evaluation results. The image database is composed of four tables, 1) scanner-test table, 2) scan parameter table, 3) reconstruction parameter table, and 4) the image filepath table. The scanner-test table contains information such as scanner model, phantom, and software module that the data are linked to. The scan parameter table stores the study date, scan protocol, collimation, pitch, kVp, effective mAs, CTDIvol, etc. The reconstruction parameter table contains parameters such as reconstruction method, reconstruction kernel, slice thickness and slice increment. The image filepath table saves the directories where the images are stored. The evaluation results database is composed of three tables, 1) image-dataset table, 2) configuration parameter table, and 3) result table. The image-dataset table links the results with the corresponding images by saving the primary keys of the reconstruction parameter table. The second table stores all the user-configured parameters, such as CHO validation method, channel filter selection, and MTF calculation option. The result table stores the output of the software modules, such as index of detectability, AUC, and FWHM. The databases do not accept duplicate entries in all tables and thus can help the users efficiently query the data/dataset by selecting parameters in each table. An example interface for data query on the CTPro website is shown in Figure 3, where the users could select the image data based on the evaluation metric, the scanner model, example type, phantom, etc.
Figure 3.

An example user interface for data query on the CTPro website. The website allows the users to choose image data based on the evaluation metric, phantom, scanner model, exam type, etc.
2.4. An example application of the CHO module
We applied the CHO module to evaluate the image quality of a recently developed deep-learning-based denoising method [19]. A 3D-printed phantom containing small cylindrical objects of various contrast levels and sizes was scanned at 4 radiation dose levels using quality reference mAs (QRM) values of 50, 100, 200 and 400. For each dose, 50 scans were acquired and reconstructed using filtered back-projection (FBP) and iterative reconstruction (IR) at two strength settings. A deep CNN was trained with high dose (HD: 400 QRM) FBP images and low-dose (LD: 50 QRM) FBP images; LD projection data were simulated from HD projection data via noise insertion. The trained network was applied to FBP images acquired at 50, 100, and 200 QRM to generate CNN denoised images, which were also blended with the FBP images to achieve noise levels similar to those in the IR images. d’ and AUC values were automatically calculated for all low-contrast objects, reconstruction/denoising methods, and dose levels using the software platform. An overall d’ (weighted average for all objects) was used as a single image quality metric to compare CNN-based method with IR.
3. RESULTS
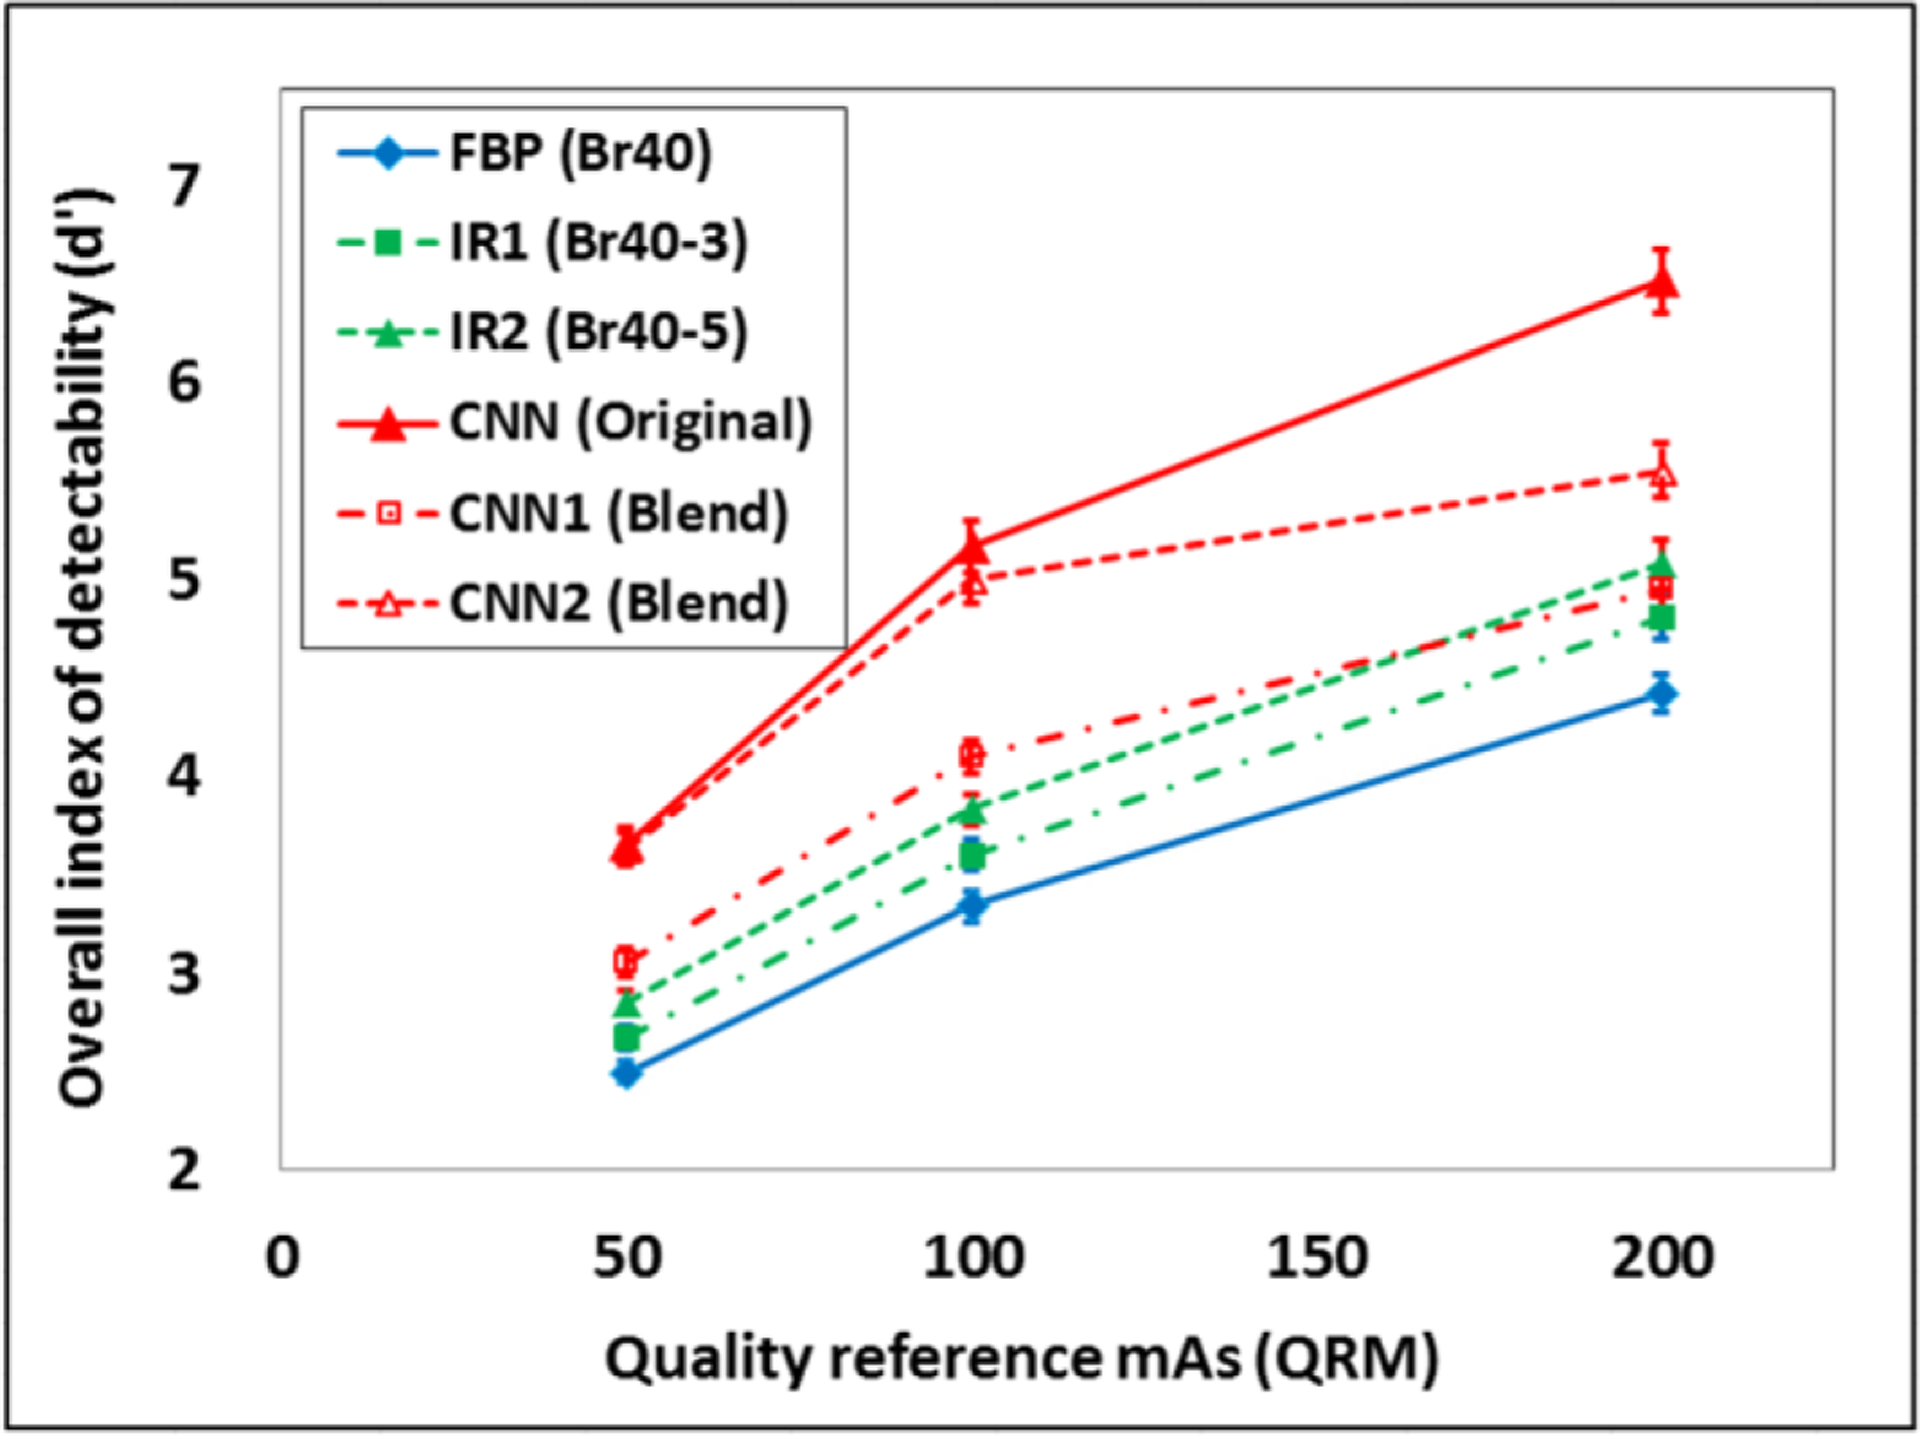
Eighteen datasets were queried from the CTPro database, containing six different reconstruction/denoising methods: (1) FBP; (2) IR1 (strength setting of 3); (3) IR2 (strength setting of 5); (4) CNN; (5) CNN blended with 30% of FBP; (6) CNN blended with 50% of FBP, each at 3 dose settings: 50, 100, and 200 QRM. The user could use the slide bar to choose a single dataset, visualize the phantom images and the DICOM information, and fine-tune the CHO parameters before running the calculation. For each of the 18 conditions (3 dose levels × 6 reconstruction conditions), the index of detectability (d’) and the area under the ROC curve (AUC) were calculated for each of 24 low-contrast objects (6 contrast levels × 4 object sizes). The weighted average of all 24 low-contrast objects are displayed in Figure 3 to show the overall d’ against dose levels for the 6 conditions. For all dose levels, the CNN-based method achieved better low-contrast detectability than IR methods.
4. CONCLUSION
This work introduces a web-based software platform CTPro, where various image quality assessment tools as well as the database that stores the image data and evaluation results data can be made easily accessible for clinical users and researchers without the need of installing additional software. The platform is currently under active development. Its application to the evaluation of CNN denoising was demonstrated, which showed improved low-contrast detectability in a CNN denoising method over IR.
Figure 4.

Comparison of the overall CHO-based index of detectability (d’) for all low-contrast objects across various reconstruction/denoising methods (CNN1 and CNN2 had similar noise levels as IR1 and IR2, respectively) and dose levels using the software platform.
5. ACKNOWLEDGEMENT
Research reported in this work was supported by the National Institutes of Health under award number U24EB028936. The content is solely the responsibility of the authors and does not necessarily represent the official views of the National Institute of Health.
REFERENCES
- 1.Mileto A, et al. , State of the Art in Abdominal CT: The Limits of Iterative Reconstruction Algorithms. Radiology, 2019. 293(3): p. 491–503. [DOI] [PubMed] [Google Scholar]
- 2.McCollough CH, et al. , Degradation of CT Low-Contrast Spatial Resolution Due to the Use of Iterative Reconstruction and Reduced Dose Levels. Radiology, 2015. 276(2): p. 499–506. [DOI] [PMC free article] [PubMed] [Google Scholar]
- 3.Solomon J, et al. , Effect of Radiation Dose Reduction and Reconstruction Algorithm on Image Noise, Contrast, Resolution, and Detectability of Subtle Hypoattenuating Liver Lesions at Multidetector CT: Filtered Back Projection versus a Commercial Model-based Iterative Reconstruction Algorithm. Radiology, 2017. 284(3): p. 777–787. [DOI] [PMC free article] [PubMed] [Google Scholar]
- 4.Ba A, et al. , Anthropomorphic model observer performance in three-dimensional detection task for low-contrast computed tomography. Journal of Medical Imaging, 2016. 3(1). [DOI] [PMC free article] [PubMed] [Google Scholar]
- 5.Popescu LM and Myers KJ, CT image assessment by low contrast signal detectability evaluation with unknown signal location. Medical Physics, 2013. 40(11). [DOI] [PubMed] [Google Scholar]
- 6.Tseng HW, Fan JH, and Kupinski MA, Assessing computed tomography image quality for combined detection and estimation tasks. Journal of Medical Imaging, 2017. 4(4). [DOI] [PMC free article] [PubMed] [Google Scholar]
- 7.Wunderlich A and Noo F, Image covariance and lesion detectability in direct fan-beam x-ray computed tomography. Physics in Medicine and Biology, 2008. 53(10): p. 2471–2493. [DOI] [PMC free article] [PubMed] [Google Scholar]
- 8.Yu LF, et al. , Prediction of human observer performance in a 2-alternative forced choice low-contrast detection task using channelized Hotelling observer: Impact of radiation dose and reconstruction algorithms. Medical Physics, 2013. 40(4). [DOI] [PMC free article] [PubMed] [Google Scholar]
- 9.Dilger SKN, et al. , Localization of liver lesions in abdominal CT imaging: II. Mathematical model observer performance correlates with human observer performance for localization of liver lesions in abdominal CT imaging. Physics in Medicine and Biology, 2019. 64(10). [DOI] [PMC free article] [PubMed] [Google Scholar]
- 10.Dilger SKN, et al. , Localization of liver lesions in abdominal CT imaging: I. Correlation of human observer performance between anatomical and uniform backgrounds. Physics in Medicine and Biology, 2019. 64(10). [DOI] [PMC free article] [PubMed] [Google Scholar]
- 11.Leng S, et al. , Correlation between model observer and human observer performance in CT imaging when lesion location is uncertain. Medical Physics, 2013. 40(8). [DOI] [PMC free article] [PubMed] [Google Scholar]
- 12.Yu LF, et al. , Correlation between a 2D channelized Hotelling observer and human observers in a low-contrast detection task with multislice reading in CT. Medical Physics, 2017. 44(8): p. 3990–3999. [DOI] [PMC free article] [PubMed] [Google Scholar]
- 13.Zhang Y, et al. , Correlation between human and model observer performance for discrimination task in CT. Physics in Medicine and Biology, 2014. 59(13): p. 3389–3404. [DOI] [PMC free article] [PubMed] [Google Scholar]
- 14.Ba A, et al. , Inter-laboratory comparison of channelized hotelling observer computation. Medical Physics, 2018. 45(7): p. 3019–3030. [DOI] [PMC free article] [PubMed] [Google Scholar]
- 15.Ma C, et al. , Impact of number of repeated scans on model observer performance for a low-contrast detection task in computed tomography. Journal of Medical Imaging, 2016. 3(2). [DOI] [PMC free article] [PubMed] [Google Scholar]
- 16.Favazza CP, et al. , Use of a channelized Hotelling observer to assess CT image quality and optimize dose reduction for iteratively reconstructed images. Journal of Medical Imaging, 2017. 4(3). [DOI] [PMC free article] [PubMed] [Google Scholar]
- 17.Yu LF, et al. Efficient and Quantitative CT Protocol Optimization using Channelized Hotelling Observer. in Radiological Society of North America (RSNA) Annual Meeting. 2017. Chicago. [Google Scholar]
- 18.Eckstein MP and Whiting JS, Lesion detection in structured noise. Academic Radiology, 1995. 2(3): p. 249–253. [DOI] [PubMed] [Google Scholar]
- 19.Missert AD, et al. , Synthesizing images from multiple kernels using a deep convolutional neural network. Medical Physics, 2020. 47(2): p. 422–430. [DOI] [PubMed] [Google Scholar]


