In the article “The Hippocampal Film Editor: Sensitivity and Specificity to Event Boundaries in Continuous Experience,” by Aya Ben-Yakov and Richard N. Henson, which appeared on pages 10057–10068 of the November 21, 2018 issue, there was an error in the code used for analysis. Ben-Yakov notes, “There was a mistake in the code that aggregates boundaries over subjects. The aggregation is done in two iterations: the first iteration results in sets of boundaries, identified by different participants, that are up to 1 TR (time unit) from one another; and the second iteration calculates the average time of each set and combines sets up to 2 TRs from one another. The code mistakenly took the first boundary of the set and not the average when determining whether to combine sets. In the Cam-CAN dataset, this resulted in a shift of one boundary (of 19) by 300 ms. In the studyforrest dataset, this resulted in 7 of 161 boundaries shifting around 1–1.5 s in time, one boundary that existed in the original calculation no longer existing, and two boundaries being split into two.
“This change had very little impact on the results, except from one result that changed meaningfully: The hippocampus is no longer significantly modulated by nObservers when accounting for all perceptual factors (p = 0.1). However, because the modulation by boundary salience remains, this does not affect the conclusions of the paper.”
As a result of this change, Results have been updated in the Cam-CAN, studyforrest, Both hippocampal activity and AG patterns are driven by event boundaries, and Specificity of hippocampal response to event boundaries sections. On page 10063, in the Selectivity of hippocampal modulation by boundary salience section, the text beginning with “Of the 55 homologous regions in the atlas…” has been updated to read “Of the 55 homologous regions in the atlas, four showed a significant modulation by boundary salience (when correcting for multiple comparisons using Holm–Bonferroni) in both experiments (Table 2)—the hippocampus, posterior cingulate cortex (PCC), posterior parahippocampal cortex and lingual gyrus. Of these, the effect remained significant only in the hippocampus and PCC when adding the perceptual and objective-shift predictors in studyforrest.” Additionally, Tables 1 and 2, and Figures 1–4 have been adjusted to reflect the corrected values. The online version has been updated.
Table 2.
Regions demonstrating a significant modulation by boundary salience
| Regions modulated by salience | Cam-CAN |
studyforrest |
studyforrest (with covariates) |
|||||
|---|---|---|---|---|---|---|---|---|
| F(1,17) | p value | R2 | F(1,145) | p value | R2 | F(1,126) | p value | |
| Hippocampus | 18 | 0.0006 | 0.04 | 18.4 | 3.3 × 10⁻⁵ | 0.01 | 9.1 5.5 | 0.02 |
| Cingulate gyrus, posterior division | 30.4 | 3.8 × 10⁻⁵ | 0.1 | 18.2 | 3.5 × 10⁻⁵ | 0.01 | 5 | 0.03 |
| Parahippocampal gyrus, posterior division | 15.9 | 0.001 | 0.09 | 12.9 | 0.0005 | 0.01 | 0.8 | 0.4 |
| Lingual gyrus | 16.9 | 0.0007 | 0.15 | 12.5 | 0.0005 | 0.02 | 0.2 | 0.7 |
Table 1.
Significance of mixed-effects models when separately accounting for each covariate
| Predictor | Salience |
nObservers |
||
|---|---|---|---|---|
| F(1,16) | p value | F(1,16) | p value | |
| isLocTemp | 4.6 | 0.05 | 5.3 | 0.04 |
| visDist | 13.6 | 0.002 | 17.9 | 0.0006 |
| visCorr | 17.2 | 0.0008 | 20.1 | 0.0004 |
| visHistDist | 15.6 | 0.001 | 18.6 | 0.0005 |
| lumDiff | 16.6 | 0.0009 | 21 | 0.0003 |
| DCNN[1…6] | minF = 14 | maxP = 0.002 | minF = 16.2 | maxP = 0.0009 |
| psdCorr | 14.7 | 0.001 | 17.4 | 0.0007 |
| psdDist | 17.6 | 0.0007 | 21.1 | 0.0003 |
| absVolDiff | 17.7 | 0.0007 | 20.7 | 0.0003 |
| V1Betas | 9.3 | 0.008 | 11.3 | 0.004 |
| A1Betas | 16.1 | 0.001 | 18.7 | 0.0005 |
| isAG | 16.6 | 0.0009 | 16.8 | 0.0008 |
Figure 1.
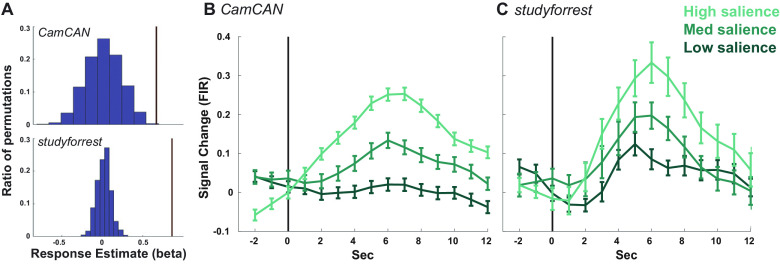
Hippocampal response to event boundaries. A, The average amplitude of the canonical response to an event boundary (brown lines) relative to the distribution of responses when randomly shuffling event order. Shown for Cam-CAN (top) and studyforrest (bottom). B, C, Average response, across participants, to event boundaries, binned by boundary salience, in Cam-CAN (B) and studyforrest (C). The per-participant time course was calculated using an FIR, and error bars reflect the SEM at each time point. The vertical black line represents the event boundary.
Figure 4.
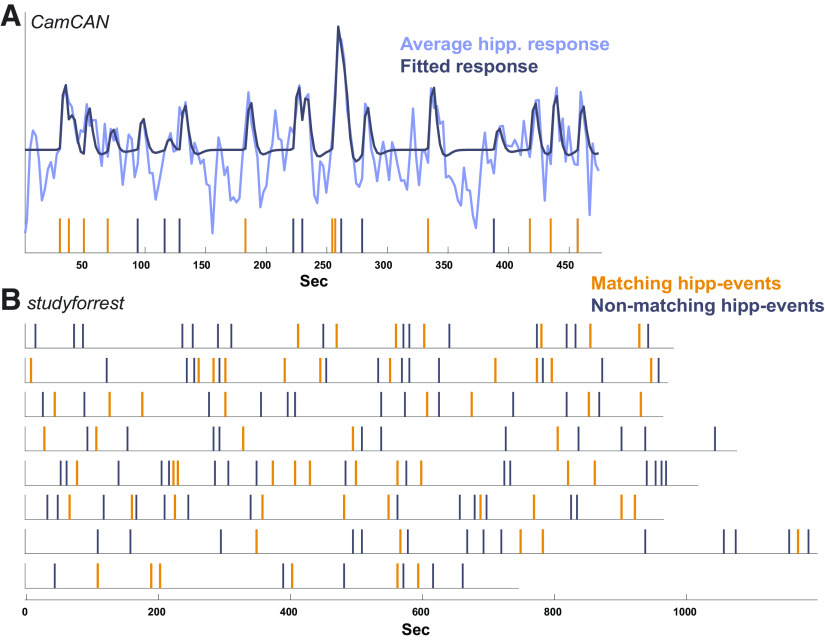
Specificity of hippocampal events (data-driven) to predefined event boundaries. A, The average hippocampal time course in Cam-CAN plotted together with the fitted model. The vertical lines indicate the hippocampal events estimated from the data–the set of events that minimized the residual error of the model when fitting to the hippocampal time course. The model was created by convolving each of these events with an HRF as a separate predictor, yielding the fitted model plotted. The hippocampal events were then divided into those matching a predefined boundary (up to 1 TR from a boundary, in orange, 58% of hippocampal events) and nonmatching ones (gray). B, The hippocampal events in each of the 8 runs of studyforrest, divided into matching (38%) and nonmatching events.
Figure 2.
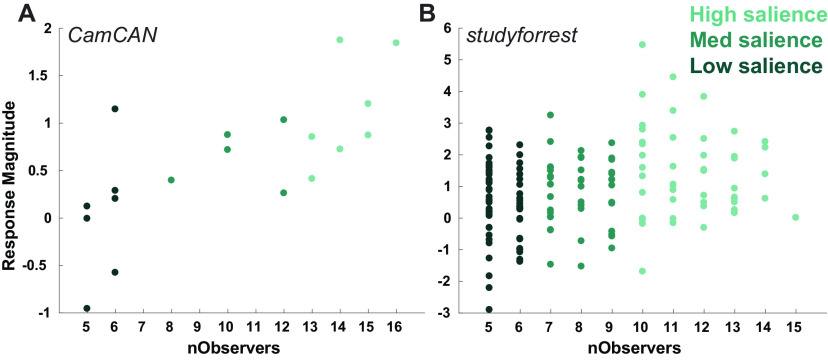
Sensitivity of hippocampal response 909 to boundary salience. The average magnitude of the canonical response to event boundaries (averaged over participants), by the number of observers that marked them (nObservers). Each dot represents the average response to a single boundary, while its color reflects its salience level. A, B, Results are presented for Cam-CAN (A) and studyforrest (B).
Figure 3.
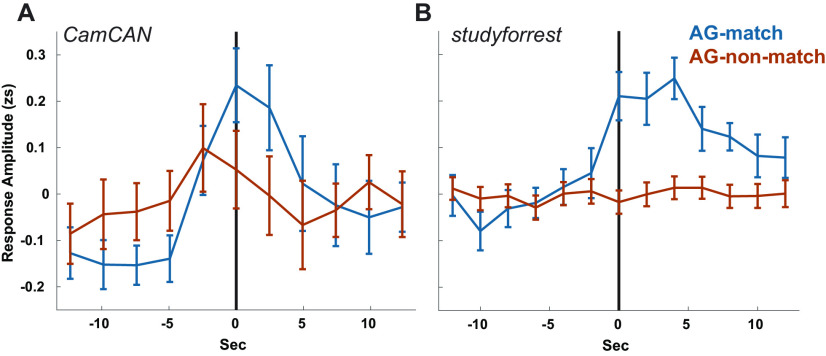
Hippocampal response to AG pattern shifts. The average zscored (zs) hippocampal response at AG pattern shifts that match/do not match annotated event boundaries. Time zero (vertical lines) represent the time of the pattern shift, uncorrected for hemodynamic delay. Error bars represent standard error of the mean (across pattern shifts). A, B, Results are shown for Cam-CAN (A) and studyforrest (B).


