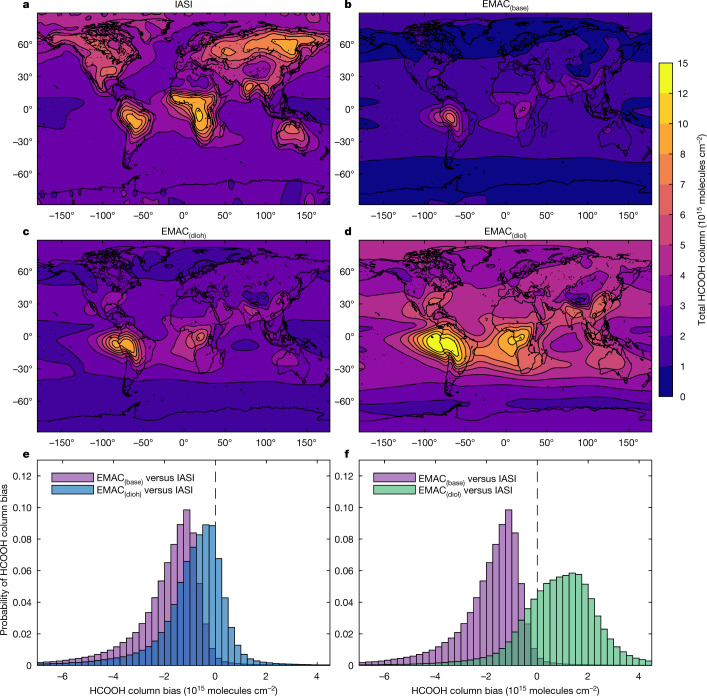
Fig. 1. Formic acid abundance from satellite and model.
a–d, Total formic acid (HCOOH) column (colour scale) derived from IASI satellite observations (a), or simulated by the base version of the model (EMAC(base); b) or by the model that implements the multiphase production of HCOOH (c, EMAC(dioh); d, EMAC(diol)). The HCOOH columns are means over 2010–2012. e, f, Probability histograms of the HCOOH column bias between EMAC simulations and satellite data. For EMAC(base) versus IASI (purple; e, f), the mean column bias over 2010–2012 is −1.97 × 10¹⁵ molecules cm−2, the median is −1.59 × 10¹⁵ molecules cm−2 and the 1σ standard deviation is 1.64 × 10¹⁵ molecules cm−2. For EMAC(dioh) versus IASI (blue; e), the mean is −0.88 × 10¹⁵ molecules cm−2, the median is −0.66 × 10¹⁵ molecules cm−2 and the 1σ standard deviation is 1.62 × 10¹⁵ molecules cm−2. For EMAC(diol) versus IASI (green; f), the mean is 0.99 × 10¹⁵ molecules cm−2, the median is 0.97 × 10¹⁵ molecules cm−2 and the 1σ standard deviation is 2.16 × 10¹⁵ molecules cm−2. A seasonal comparison is provided in Extended Data Figs. 3, 4.

