Abstract
Purpose:
Recent innovations in mobile technology for the measurement of vision present a valuable opportunity to measure visual function in non-clinical settings, such as in the home and in field-based surveys. This study evaluated agreement between a tablet-based measurement of distance and near acuity, and contrast sensitivity as compared to gold-standard clinical tests.
Methods:
Participants aged ≥55 years recruited from a tertiary eye clinic underwent testing with three tablet-based and corresponding gold-standard clinical measures (ETDRS distance acuity, Pelli-Robson contrast sensitivity, and MNRead near acuity). Correlation and agreement between tablet-based and clinical tests were assessed.
Results:
A total of 82 participants with a mean age of 69.1 (SD=7.6) years, and majority female (67.1%) and white (64.6%), were enrolled in this study. The mean (SD) difference between the tests (gold-standard – tablet) was −0.04 (0.08) logMAR for distance acuity, −0.11 (0.13) log units for contrast sensitivity, and −0.09 (0.12) logMAR for near acuity. 95% limits of agreement for distance acuity (−0.21, 0.12 logMAR), near acuity (−0.34, 0.14 logMAR), and contrast sensitivity (−0.36, 0.14 logCS) were also determined. The correlation between tablet-based and gold-standard tests was strongest for distance acuity (r=0.78), followed by contrast sensitivity (r=0.75), and near acuity (r=0.67). The agreement between the standard and tablet-based methods did not appear to be dependent on the level of vision.
Conclusions:
This study demonstrates the agreement of tablet-based and gold-standard tests of visual function in older adults. These findings have important implications for future population vision health surveillance and research.
Keywords: Tablet-based vision tests, iPad-based vision tests, near acuity, distance visual acuity, contrast sensitivity
INTRODUCTION
Vision impairment is common in late life1 and can have an adverse impact on older adults’ physical,2 emotional,3 and cognitive health4. Despite the high prevalence of vision impairment in aging populations1 and its wide-ranging impact on health and quality of life,2–4 there are currently no contemporary nationally representative data on objectively measured visual function in older Americans. Recent innovations in mobile technology for the measurement of vision5–8 present a valuable opportunity to detect vision impairment in non-clinical settings, including incorporation into aging cohort studies and home testing.
Previous work has evaluated multiple mobile technology-based approaches as an alternative to traditional chart-based methods for measuring vision.8–10 While chart-based methods remain the gold-standard, mobile and tablet devices may offer some advantages over printed tests in field settings, particularly due to portability, less susceptibility to letter fading, superior resolution, and the potential for automatic scoring and storing of data, as well as containing multiple visual function tests in a single device.11 In addition, these devices generally support software that allows one to: (1) choose population-appropriate charts (e.g. tumbling E, Lea symbols, etc.); (2) randomize letters to prevent learning/memorization of optotypes; (3) optimize screen brightness and luminance; and (4) customize stimulus size based on viewing distance restrictions in a field setting.
One example of a smartphone-based vision test, the PEEK android application, was shown to be comparable in accuracy to the Early Treatment Diabetic Retinopathy Study (ETDRS) chart in measuring distance visual acuity and to a ‘tumbling E’ Pelli-Robson chart (available for use in low-literacy settings) for measuring contrast sensitivity.6,10 Multiple applications have also been developed specifically for the iPad (Apple, Inc., Cupertino, CA).12–14 In a clinic sample of participants with normal and low vision, Ridgevue Vision’s (Ridgevue Vision LLC, Boulder, CO) iPad-based contrast sensitivity test showed similar repeatability to the standard Freiburg and Pelli-Robson tests, although measuring somewhat higher (e.g. better) contrast values compared to the latter.15 Ridgevue’s iPad-based distance visual acuity test also showed good agreement with the standard Sloan acuity testing in a small sample of participants with multiple sclerosis.5
This study aims to build on the existing literature by expanding the comparison between tablet-based and gold-standard tests to include a sample of older adults and tests of near visual acuity, a visual function that has been shown to have as great an adverse impact as distance visual acuity on quality of life and functioning in older adults.16–18 This investigation evaluates Ridgevue’s tablet-based measures of distance and near visual acuity and contrast sensitivity as compared to gold-standard clinical tests among an older population in a tertiary eye clinic. The validation of these tablet-based tests may provide valuable data to advance the informed use of tablet technology-based eye tests for older adult populations.
MATERIALS AND METHODS
Informed written consent was obtained from participants after explanation of the nature and possible consequences of the study. The research was conducted in compliance with the Johns Hopkins Medicine Institutional Review Board and followed the tenets of the Declaration of Helsinki.
Study Population
The study participants were patients from the Comprehensive Eye Care, Glaucoma, and Retina clinics of the Wilmer Eye Institute at the Johns Hopkins University Hospital recruited between August 2019 and March 2020. All patients who were: (1) 55 years and older; (2) with a clinic-based presenting visual acuity measurement of 20/200 or better in both eyes; (3) able to provide informed consent; and (4) could speak and read in English, were eligible for study participation.
Study Procedures
All study participants underwent testing in the following order (1 to 6 listed below). All tests were administered binocularly while wearing any habitual correction, if available. This approach was chosen in order to best simulate day-to-day visual function.19 Two trained research personnel administered all tests and all testing (standard and tablet-based) for any given study participant was completed by a single research person. Room lighting was provided by overhead fluorescent lamps and the illuminance at the page (MNRead near chart) level was measured using a lux meter (Dr. Meter model LX1330B) for each participant, ensuring that it was between 160 and 600 lux. The iPad 3 with Retina display (Apple, Inc., Cupertino, CA) was used to administer all tablet-based tests, and the vision applications were commercially available from Ridgevue Vision (Boulder, CO) as iBooks through the iTunes Store. For all the tablet-based tests, the brightness was set at 50%, per the test manufacturer’s recommendation, as previously done.15
Standard Clinic Tests
ETDRS Distance Acuity: Distance visual acuity was measured using ETDRS charts at a 3-meter distance and backlit at 130 lux (or candelas/m2). The total number of letters read correctly for each trial was summarized as the negative logarithm of the minimum angle of resolution (logMAR). Each letter has a score value of 0.02 log units, and with 5 letters per line, the total score for a line on the LogMAR chart represents a change of 0.1 log units. The test was stopped when the participant read less than 3 of the 5 letters on a line correctly.
Pelli-Robson Contrast Sensitivity: Contrast sensitivity was measured using the Pelli-Robson chart at a 1-meter distance. This chart presents letters arranged in triplets of equal contrast, and contrast changes by 0.15 log units per triplet. The test was stopped when the participant was unable to correctly read two or more letters on a row. The total number of letters read correctly was converted to a log scale.
MNRead Near Acuity: Near acuity was measured using the MNRead near acuity chart held at a distance that the participant deemed comfortable (the reading distance was documented). This chart presents a series of sentences decreasing in size, and each sentence represents a change of 0.1 log units. Reading acuity was calculated based on the smallest print read accounting for reading distance and summarized as logMAR.
Tablet-Based Tests
Tablet Distance Acuity: The tablet logMAR visual acuity charts are based on and use the same 10-letter set as the Bailey-Lovie Visual Acuity Chart. The chart has ten pages of letters (appearing in a random order), with 5 letters on each page. This test was administered at a 1.5-meter distance with an iPad tablet mounted on a stand. The test was stopped when the participant read less than 3 of the 5 letters on a page correctly.
Tablet Contrast Sensitivity: The tablet-based contrast sensitivity test is similar in principle to the Pelli-Robson test. This test was administered at a 1.5-meter distance with an iPad tablet mounted on a stand. The test presents two letters per page and in 0.1 log unit steps. The test was stopped when the participant was unable to read any letter on a page correctly.
Tablet Near Acuity: The tablet-based near acuity test has ten pages of lowercase letters (appearing in a random order), with 5 letters on each page. The iPad tablet was held at a distance that the participant deemed comfortable (the reading distance was documented). The test was stopped when the participant read less than 3 of the 5 letters on a page correctly. It was scored in the same way as the tablet-based distance acuity test, with the number of correct letters counted and a logMAR score derived from the combination of letters read correctly and accounting for reading distance.
Statistical analysis
Study data were collected in clinic rooms on paper examination forms, and entered into RedCap (Version 6.5.14, Vanderbilt University) data management software. Socio-demographic information was summarized using means and standard deviations (SD) for continuous variables and expressed as frequencies and percentages (%) for categorical variables. The Pearson’s coefficient (r) and scatter plots, and 95% limits of agreement and Bland-Altman plots20 were used to examine the correlation and agreement, respectively between each pair of standard and tablet-based tests.
All analyses were performed using Stata Statistical Software, release 14.1 (StataCorp LP, College Station, TX).
RESULTS
A total of 82 participants were enrolled in this study from the Glaucoma (n=50; 61%), Comprehensive Eye Care (n=31; 38%), and Retina (n=1; 1%) clinics. Participants had a mean age of 69.1 (SD=7.6) years, and the majority were female (67.1%), white (64.6 %), and had more than a high school education (73.2%) (Table 1).
Table 1.
Participants Characteristics
| Characteristics | N=82 |
|---|---|
| Age in years, mean (SD) | 69.1 (7.6) |
| Sex, n (%) | |
| Male | 27 (32.9) |
| Female | 55 (67.1) |
| Race, n (%) | |
| White | 53 (64.6) |
| African American | 21 (25.6) |
| Asian or Pacific Islander | 3 (3.7) |
| Other/Refused | 5 (6.1) |
| Hispanic, n (%) | 3 (3.7) |
| Education, n (%) | |
| High school or less | 22 (26.8) |
| College | 33 (40.2) |
| Graduate degree | 27 (32.9) |
| Clinic recruited from, n (%) | |
| Glaucoma | 50 (60.9) |
| Comprehensive Eye Care | 31 (37.8) |
| Retina | 1 (1.3) |
Distance visual acuity, contrast sensitivity, and near acuity measurements obtained from standard and tablet-based tests are summarized in Table 2. Participants had better binocular distance and near acuity on the standard tests than on the respective tablet-based tests, but performed better on the tablet-based contrast sensitivity test than the standard Pelli-Robson test. The mean (SD) difference between the tests (standard – tablet) was −0.04 (0.08) logMAR for distance acuity, −0.11 (0.13) log units for contrast sensitivity, and −0.09 (0.12) logMAR for near acuity. These log values correspond to a mean difference of 2 letters on the ETDRS Chart, less than 1 set of triplets on the Pelli-Robson chart, and less than 1 sentence on the MnRead chart, respectively.
Table 2.
Comparison of conventional and tablet-based test for each vision metric, (N=82)
| Vision Test Metric | Standard test, mean (SD) | Tablet test, mean (SD) | Differencea, mean (SD) | 95% LOA | rb |
|---|---|---|---|---|---|
| Distance visual acuity (ETDRS vs tablet), logMAR |
0.04 (0.12) | 0.08 (0.13) | −0.04 (0.08)c | −0.21, 0.12 | 0.78 |
| Contrast sensitivity (Pelli Robson vs tablet), log units |
1.58 (0.17) | 1.69 (0.18) | −0.11 (0.13)d | −0.36, 0.14 | 0.75 |
| Near acuity (MNRead vs. tablet), logMAR |
0.07 (0.16) | 0.16 (0.13) | −0.09 (0.12)e | −0.34, 0.14 | 0.67 |
Standard test – tablet test
Pearson’s Correlation
Corresponds to a mean difference of 2 letters on the ETDRS Chart.
Corresponds to a mean difference of less than 1 set of triplets on the Pelli-Robson chart.
Corresponds to a mean difference of less than 1 sentence on the MnRead chart.
Abbreviations: LOA=limits of agreement, ETDRS= Early Treatment Diabetic Retinopathy Study, logMAR= Logarithm of the Minimum Angle of Resolution
There was strong correlation between the standard and tablet-based tests for binocular distance acuity (r=0.78) and contrast sensitivity (r=0.75), and moderate correlation for near acuity (r=0.67), (Table 2, Figure 1). The Bland–Altman plots with the mean difference and limits of agreement are shown in Figure 2. The difference between the standard and tablet-based methods did not appear to change with an increase in the average for binocular distance visual acuity, contrast sensitivity, or near acuity (i.e. the agreement was not dependent on the level of vision). Additionally, the variability (scatter around the bias line) did not change with an increase in the average level of visual function for all three vision metrics.
Figure 1A. Scatter Plot for Distance Visual Acuity.
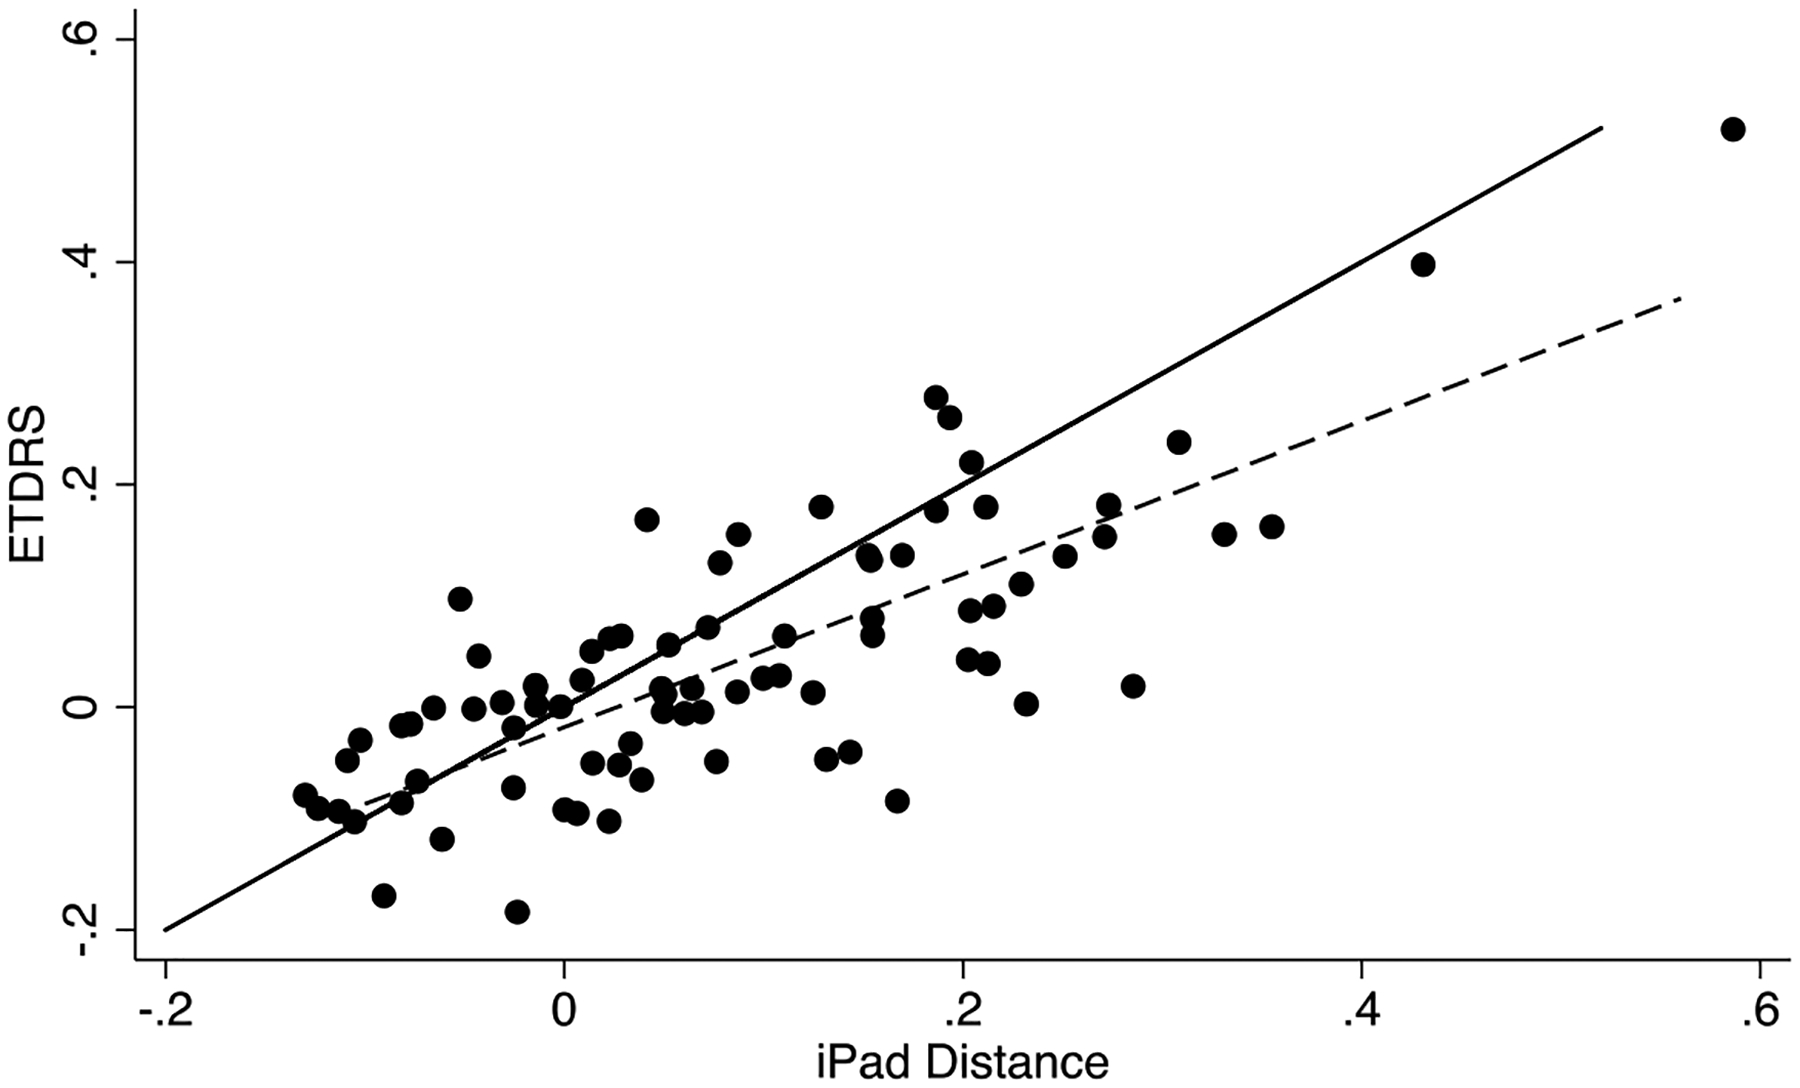
Note: Dashed line= fitted values; Solid line= true
Figure 2A. Bland Altman Plot for Distance Visual Acuity.
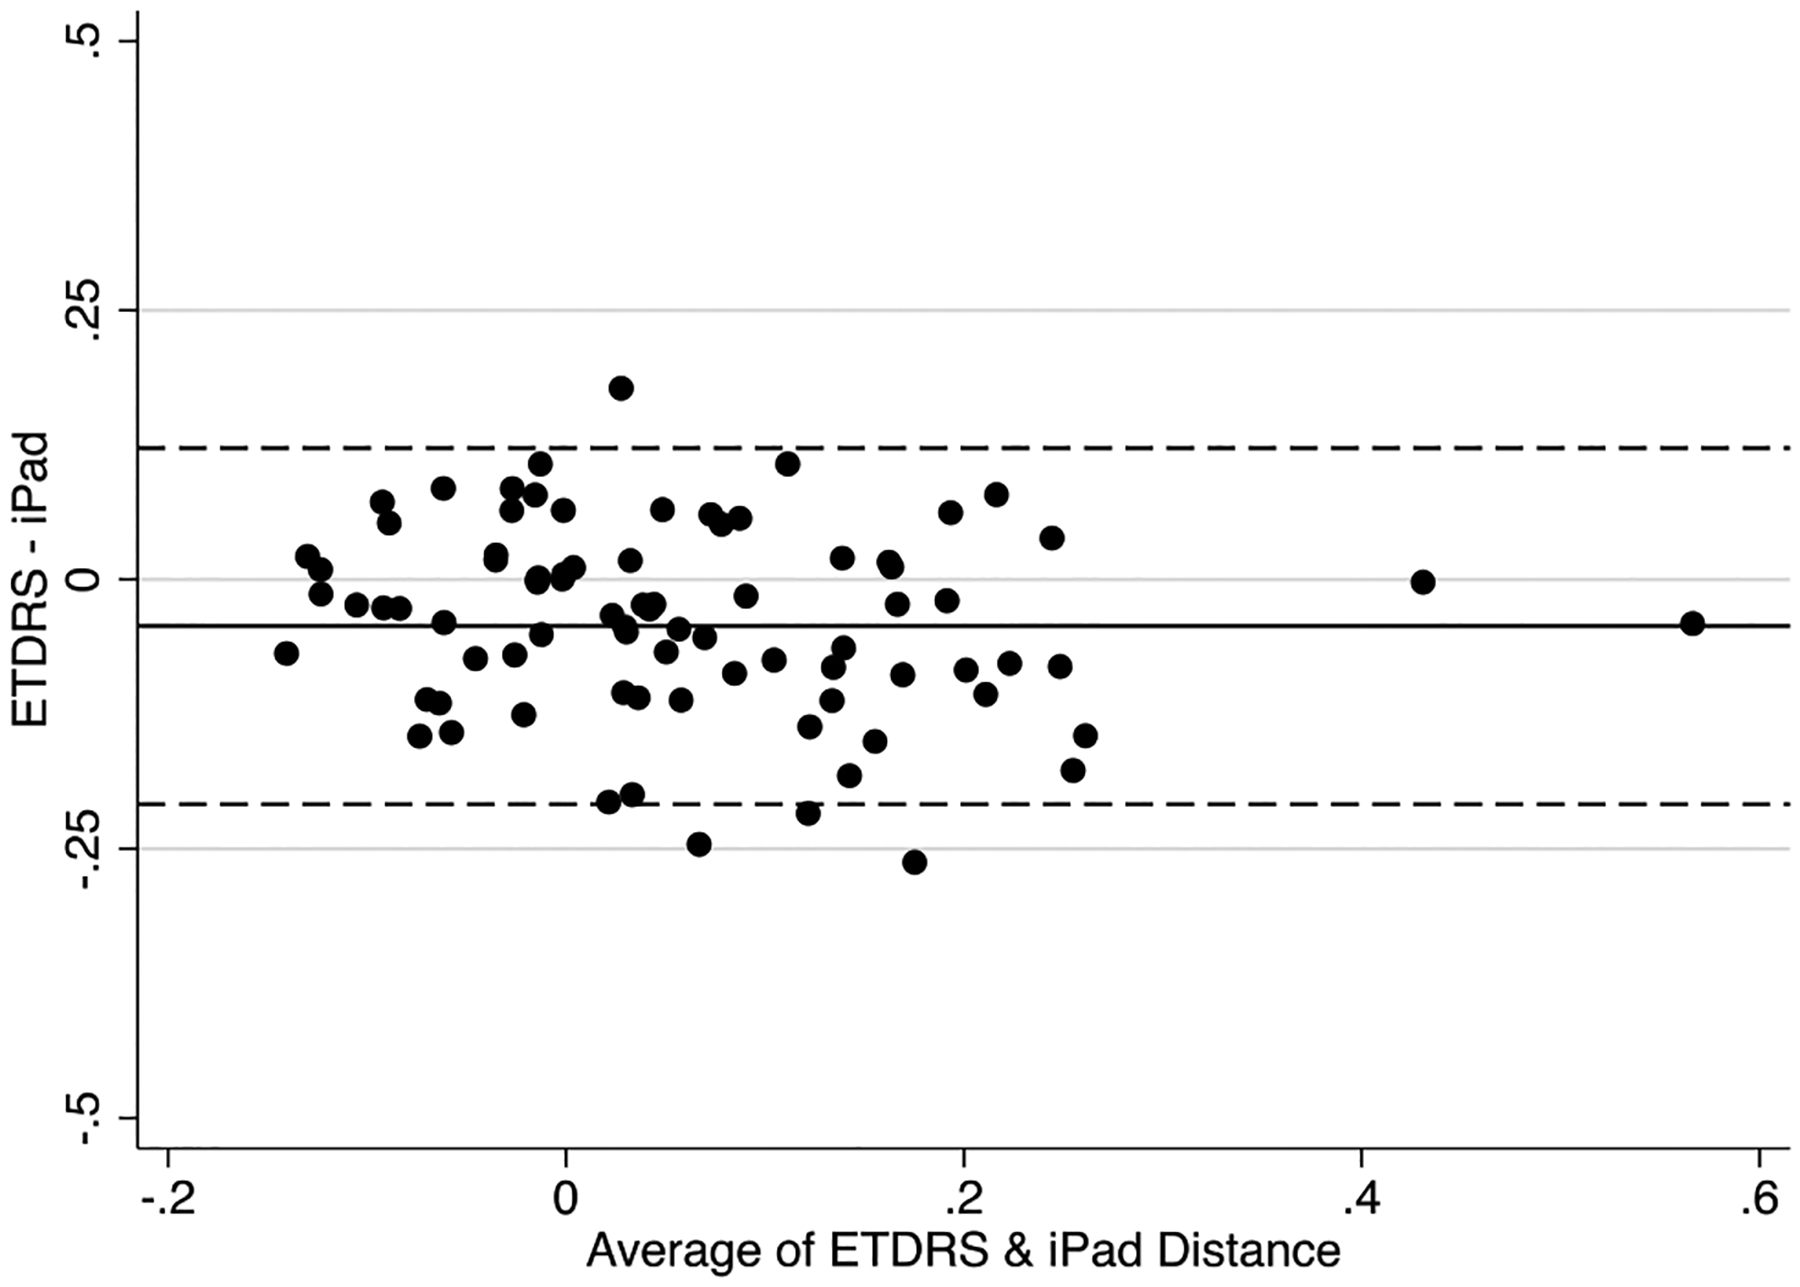
ETDRS= Early Treatment Diabetic Retinopathy Study
Note: Dashed line= 95% limits of agreement; Solid line= mean
The first 50 participants (recruited from the glaucoma clinic) were tested in a room with a mean lux meter reading of 175 (SD=5.8) while the next 32 participants (recruited from the comprehensive eye clinic and retina clinic) were tested in a different room with a mean lux meter reading of 487 (SD=87.7). In sensitivity analysis, data were separately analyzed from each of the two rooms. Limits of agreement and correlations between the tablet-based and gold-standard tests were similar to the full study sample.
DISCUSSION
In this clinic-based sample of older adults, we validated a tablet-based test for distance and near visual acuity, and contrast sensitivity. Overall, the Ridgevue Vision application’s performance was comparable to the corresponding gold-standard clinical ETDRS distance acuity, Pelli-Robson contrast sensitivity, and MNRead near acuity tests. Our findings also indicated that agreement between the tablet and standard tests was similar across a range of visual function and ambient light conditions. The ubiquity of tablet-based technology coupled with these findings has important implications for future population vision health surveillance and research.
Prior studies have examined tablet-based vision tests also developed by Ridgevue Vision in small clinic-based samples. Kolhaulm et al.15 and Sattarnezhad et al.5 validated tablet-based contrast sensitivity (n=40) and distance visual acuity tests (n=38), respectively, and reported good agreement with standard tests. Similar to our study where the tablet-based test measured higher (i.e. 0.11 log units better) contrast values as compared to the Pelli-Robson test, in Kolhaulm et al.’s study the tablet-based test measured 0.15 log contrast units higher.15 Black et al.9 evaluated a tablet-based distance visual acuity test, Visual Acuity XL (Kybervision, Montreal, Canada), in a sample of university staff and students and found that the tablet was susceptible to glare that resulted in about two lines (0.2 logMAR) poorer acuity compared to the ETDRS and Bailey-Lovie charts. However, when installed with an anti-glare screen and positioned to avoid reflections from overhead light sources, the tablet and standard ETDRS charts produced similar acuity measurements. In contrast to our study where the tablet measured only slightly worse distance visual acuity (0.04 logMAR) than the standard chart, prior studies conducted in substantially younger age groups reported better acuity (about 0.06 LogMAR) with a tablet compared to a standard test.14 This discrepancy may be attributable to differences in visual acuity instruments and/or protocols, as well as the differences in age of the study populations. Importantly, however, the current study documented overall high agreement between tablet-based and gold-standard tests that did not appear to vary systematically based on level of visual function or ambient light conditions.
There are comparatively fewer studies examining tablet-based near acuity measurement. A study comparing the performance of the MNRead tablet application with the standard MNRead acuity chart found that both yielded similar estimates of reading acuity among participants with normal and low vision.8 Aslam et al. examined a tablet-based method for self-testing of near visual acuity with The Mobile Assessment of Vision by intERactIve Computer (MAVERIC) system and reported good agreement with gold-standard near Landolt C or near ETDRS charts.21 Unlike distance visual acuity and contrast sensitivity, there is no one gold-standard near acuity test. The MNRead test requires participants to read phrases and sentences. In contrast, the Ridgevue tablet-based test contains only letters like the ETDRS distance acuity chart, though letters are lowercase and spaced close together to approximate reading conditions. Therefore, it is possible that the better near acuity in the MNRead test as compared to the iPad test in our study may in part be due to participants being able to “guess” some words on the MNRead chart based on the context a sentence provides.
The ubiquity of smartphones also provides a new opportunity to deliver vision testing. One such example of a smartphone-based vision test is the PEEK application that has been validated in low-resource community settings.6,10 The agreement between the PEEK acuity and standard ETDRS test evaluated in a clinic in Kenya (95% limits of agreement: −0.49 to 0.42; r=0.92) was somewhat lower than the agreement between the Ridgevue and ETDRS test in our study (95% limits of agreement: −0.21, 0.12; r=0.78), although the PEEK had a stronger correlation with the gold-standard test than the Ridgevue test.10 Likewise, for contrast sensitivity function, the agreement between the PEEK and standard Pelli-Robson tests (95% limits of agreement: −0.27 to 0.29, r=0.94), was similar to the agreement between the Ridgevue and Pelli Robson tests (95% limits of agreement: −0.36, 0.14, r=0.75).6
This study had several limitations. The study population was comprised of participants enrolled at a university clinic and may not reflect the demographics and vision characteristics of individuals in a field or community setting where tablet-based vision testing may be most applicable in the future. However, we attempted to capture participants with a range of visual function by recruiting from comprehensive, glaucoma, and retina clinics, and restricted to older adults who may be a key population for vision assessment in the home and in field-based community surveys. While we did not assess the test-retest reliability of the tablet-based vision measurements in our study, Kollbaum et al. determined that the Ridgevue tablet-based contrast sensitivity test showed good repeatability (95% limits of agreement: ±0.19) in a sample of normal-sighted subjects, and lower but similar repeatability to the standard Pelli-Robson test in a sample with low-vision (95% limits of agreement for tablet: ±0.24 vs. Pelli-Robson: ±0.23). Also, we chose to deliver all tests binocularly as opposed to uniocularly- (1) in the interest of time and participant burden, and (2) since patients’ binocular vision provides the most information on their day-to-day visual functioning. So, while we may be losing some granularity in the data by not also including uniocular vision measures, a recent study reported that uniocular visual acuity actually underestimates the impact of visual acuity on vision-related quality of life, thereby suggesting that binocular measures of visual acuity may be preferred when aiming to measure the functional day-to-day impact of vision loss.19
Trained clinical research personnel performed all testing in this study; further investigation of the usability of tablet-based vision tests by non-healthcare workers is needed. However, given the ubiquitous availability of, familiarity with, and use of smartphones and tablets, we would not anticipate that lay persons would encounter difficulty in administering these tests after a brief training session. The same research personnel administered the standard and tablet-based tests. Since research personnel were not masked to which test they were administering, this may have introduced bias, possibly influencing the measurements obtained from the traditional and/or tablet-based tests. In addition, we did not examine inter-tester agreement for the two personnel who conducted the studies, although they received similar prior training. Furthermore, since the order of the standard and tablet-based tests was not randomized, there may have been a learning and/or fatigue effect among participants that may have contributed to the slightly worse distance and near acuity on the tablet-based tests than the respective standard tests. However, as noted, participants actually performed slightly better on the tablet-based contrast test (administered fifth) than on the Pelli-Robson test (administered second). We did not obtain feedback from study participants that indicated any difficulty testing with the tablet, although some prior studies have documented difficulty with glare. However, if glare from ambient light sources causes a problem, anti-glare screens and optimal positioning of the tablet to avoid glare from light sources appears to be an effective solution.9 Finally, since fluency and comfort are important components of useful near vision, one could argue that the use of letters/optotypes in the tablet-based test, as opposed to sentences like in the MNRead chart, may not be ideal to measure near acuity. However, in adopting the tablet-based near test described in this study, we followed the methodology used in many prior population-based studies that have aimed to detect uncorrected presbyopia and near vision impairment independent of factors like fluency and comfort.22 Therefore, the tablet-based near vision test in this study may in fact be comparable with instruments used in epidemiologic studies in other settings.
In conclusion, recent advances in technology present a valuable opportunity to allow researchers to measure visual function using an accessible, portable, and easy-to-use platform that contains multiple tests of visual function in a single device. The tablet-based tests for distance acuity, contrast sensitivity, and near acuity showed good agreement with gold-standard tests, and offer a platform for predictable and convenient testing in a field-based setting. In addition, the high-quality backlit tablet screen does not require external lighting, as compared to many traditional charts. This is an added convenience in field settings with variable ambient lighting conditions. Therefore, these findings have significant ramifications for population vision health surveillance and research. Objective vision information would be a critical addition to national aging datasets given the high prevalence of vision impairment in older adults and its substantial adverse impact on health, functioning, and quality of life.
Figure 1B. Scatter Plot for Contrast Sensitivity.
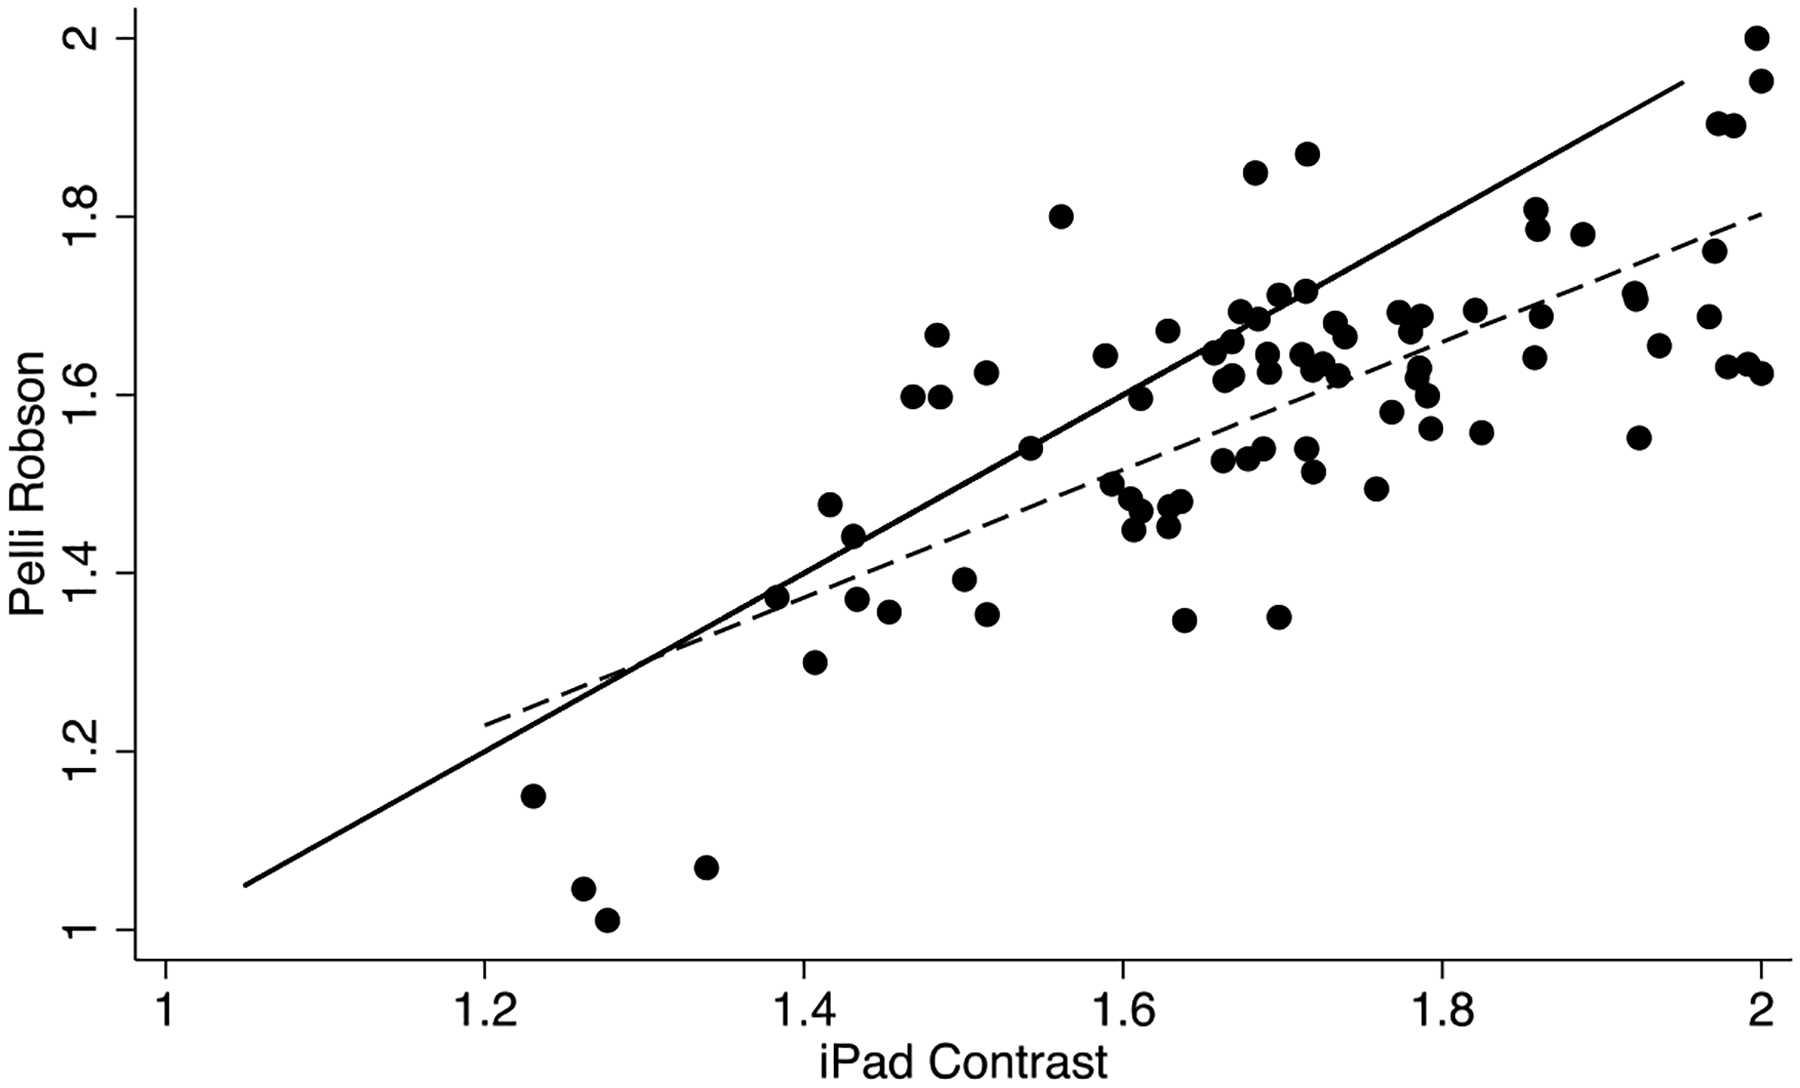
Note: Dashed line= fitted values; Solid line= true
Figure 1C. Scatter Plot for Near Acuity.
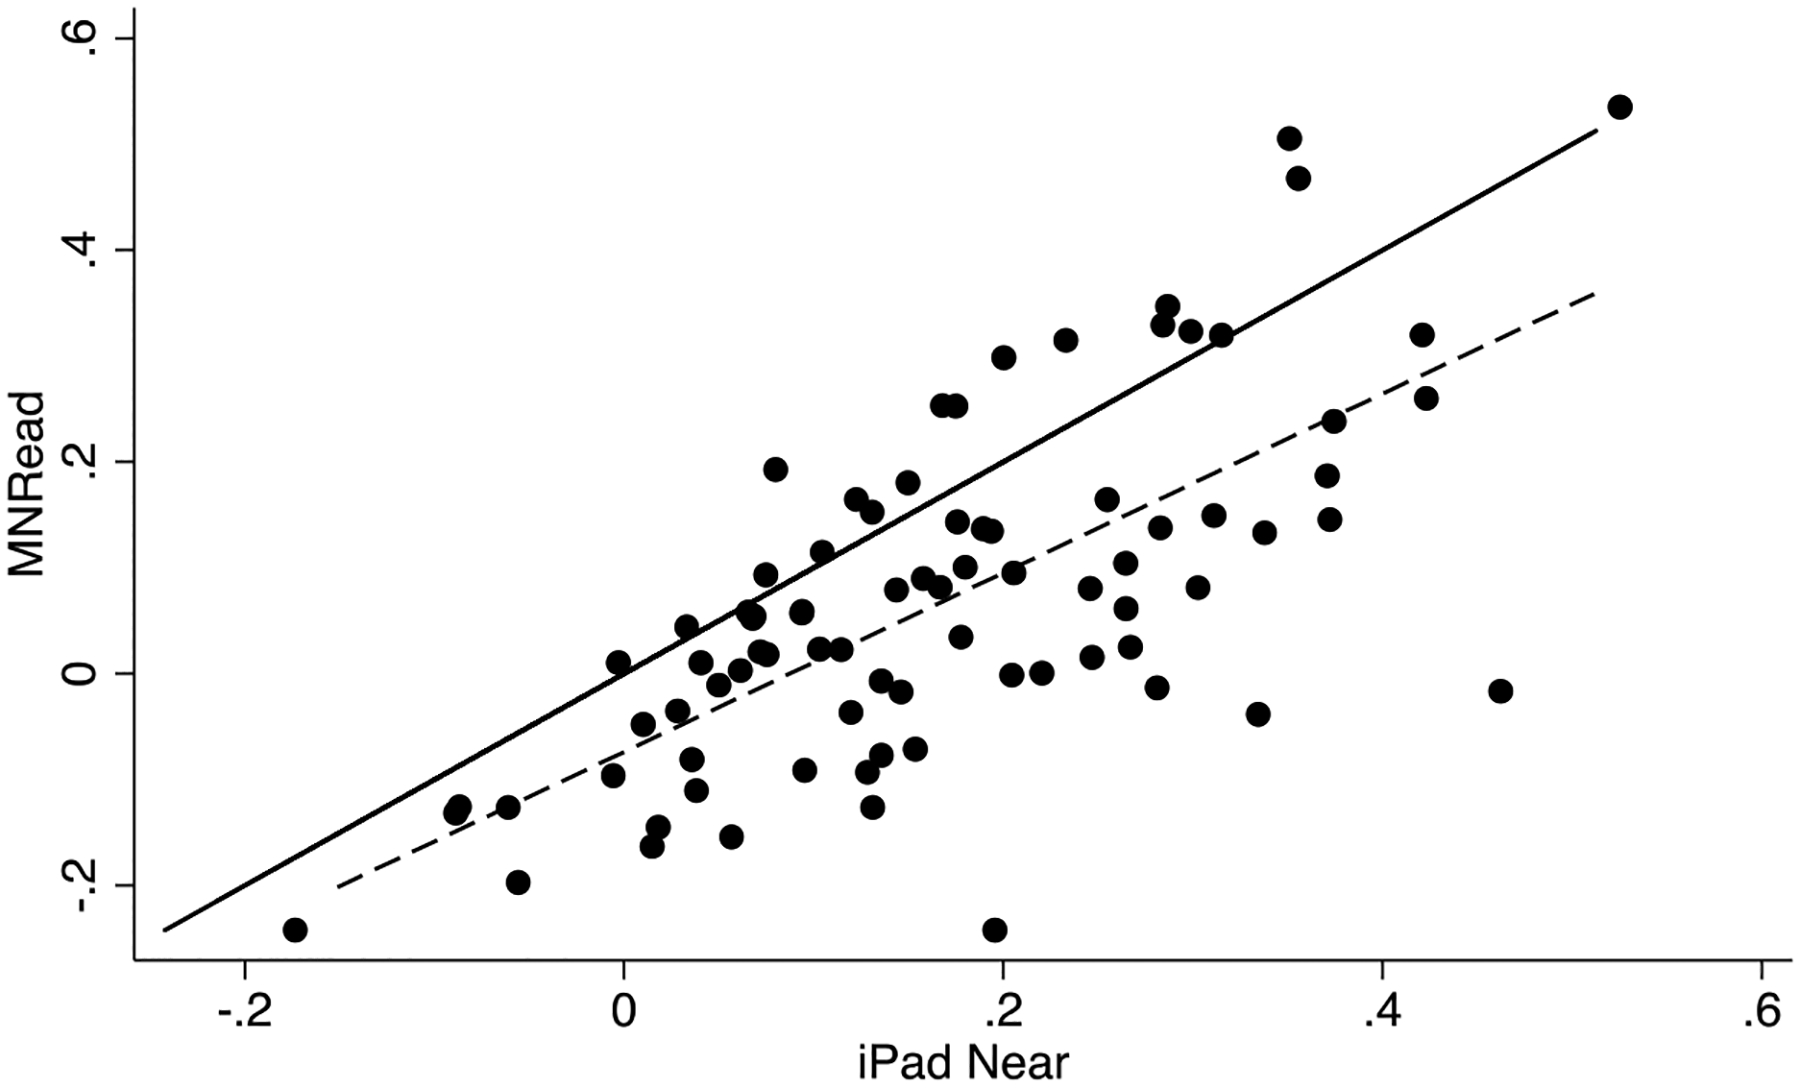
Note: Dashed line= fitted values; Solid line= true
Figure 2B. Bland Altman Plot for Contrast Sensitivity.
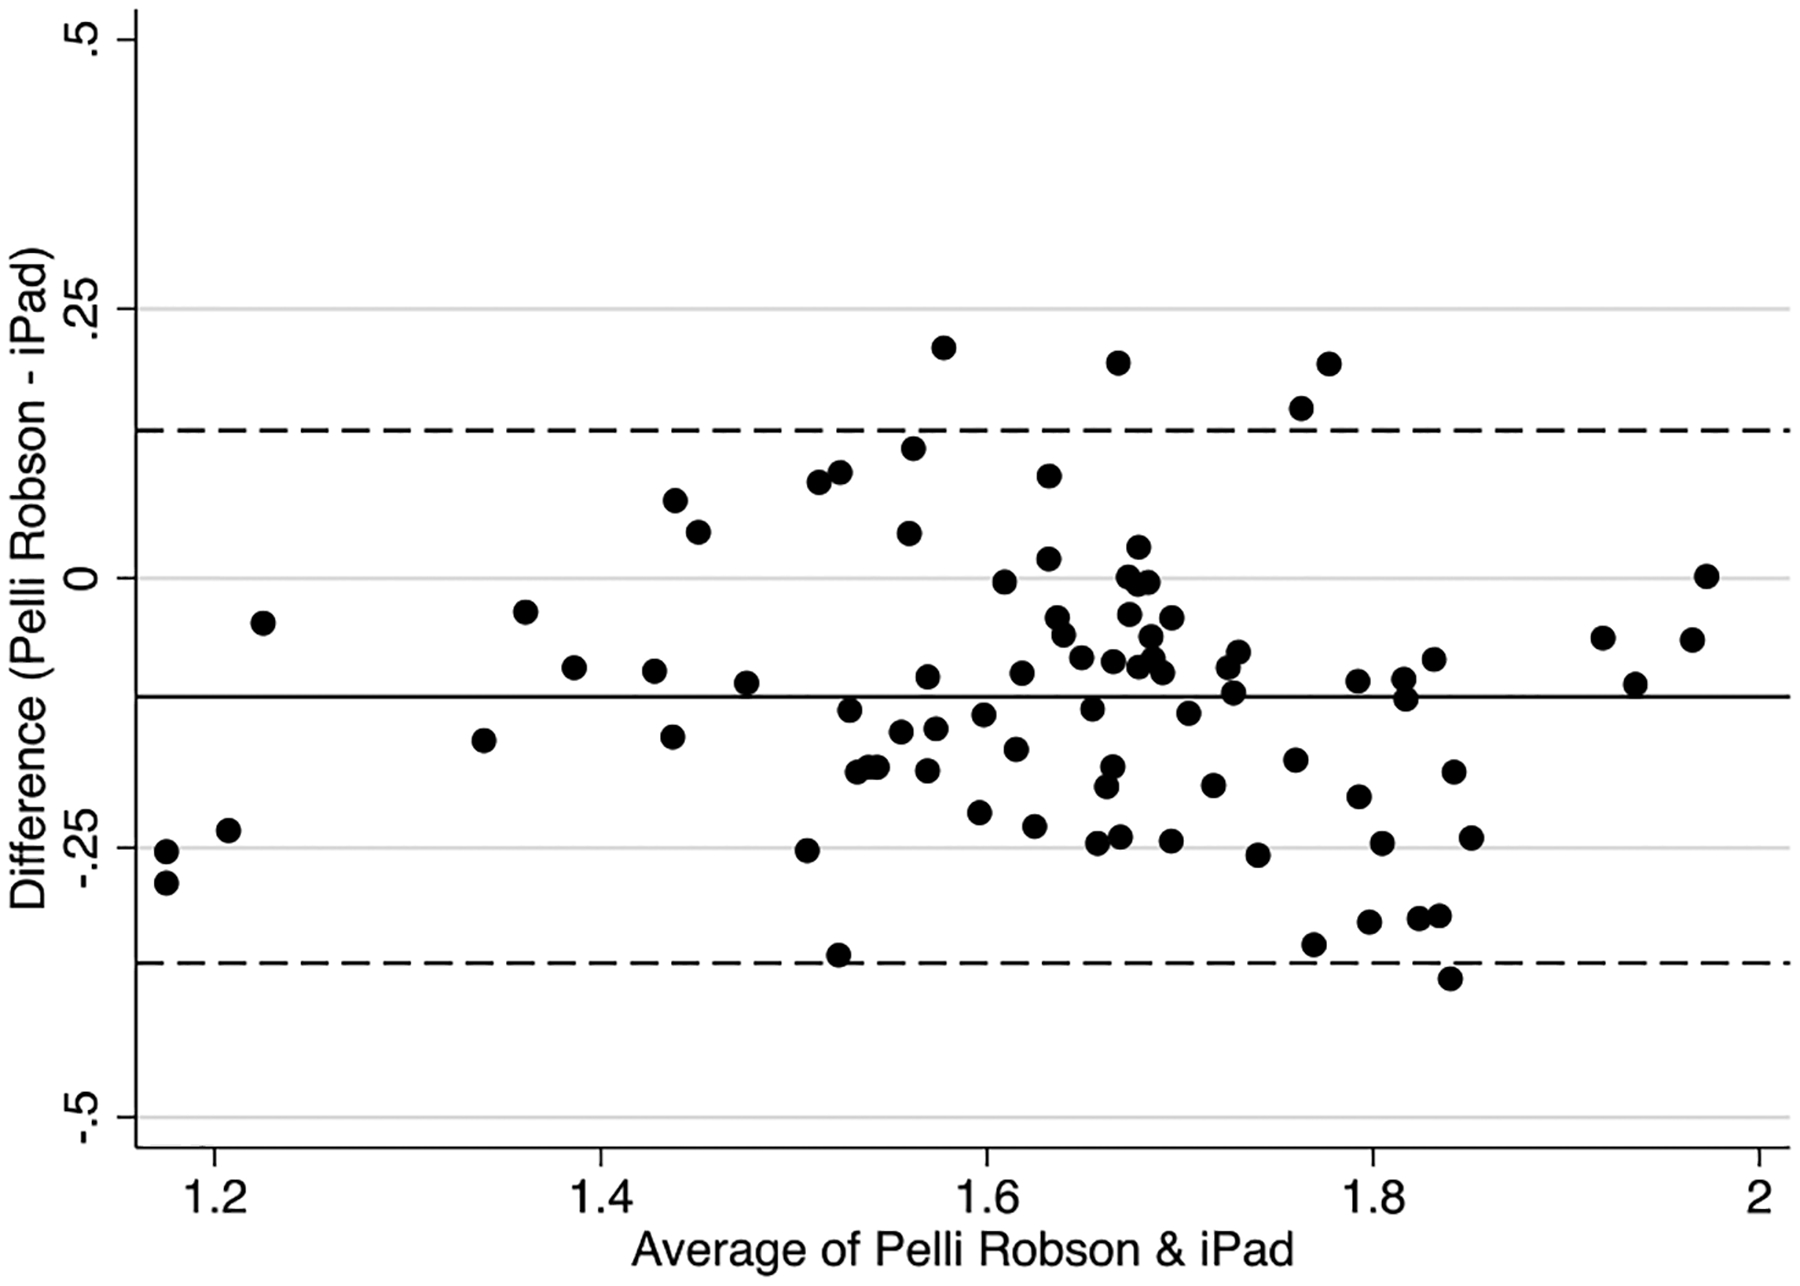
Note: Dashed line= 95% limits of agreement; Solid line= mean
Figure 2C. Bland Altman Plot for Near acuity.
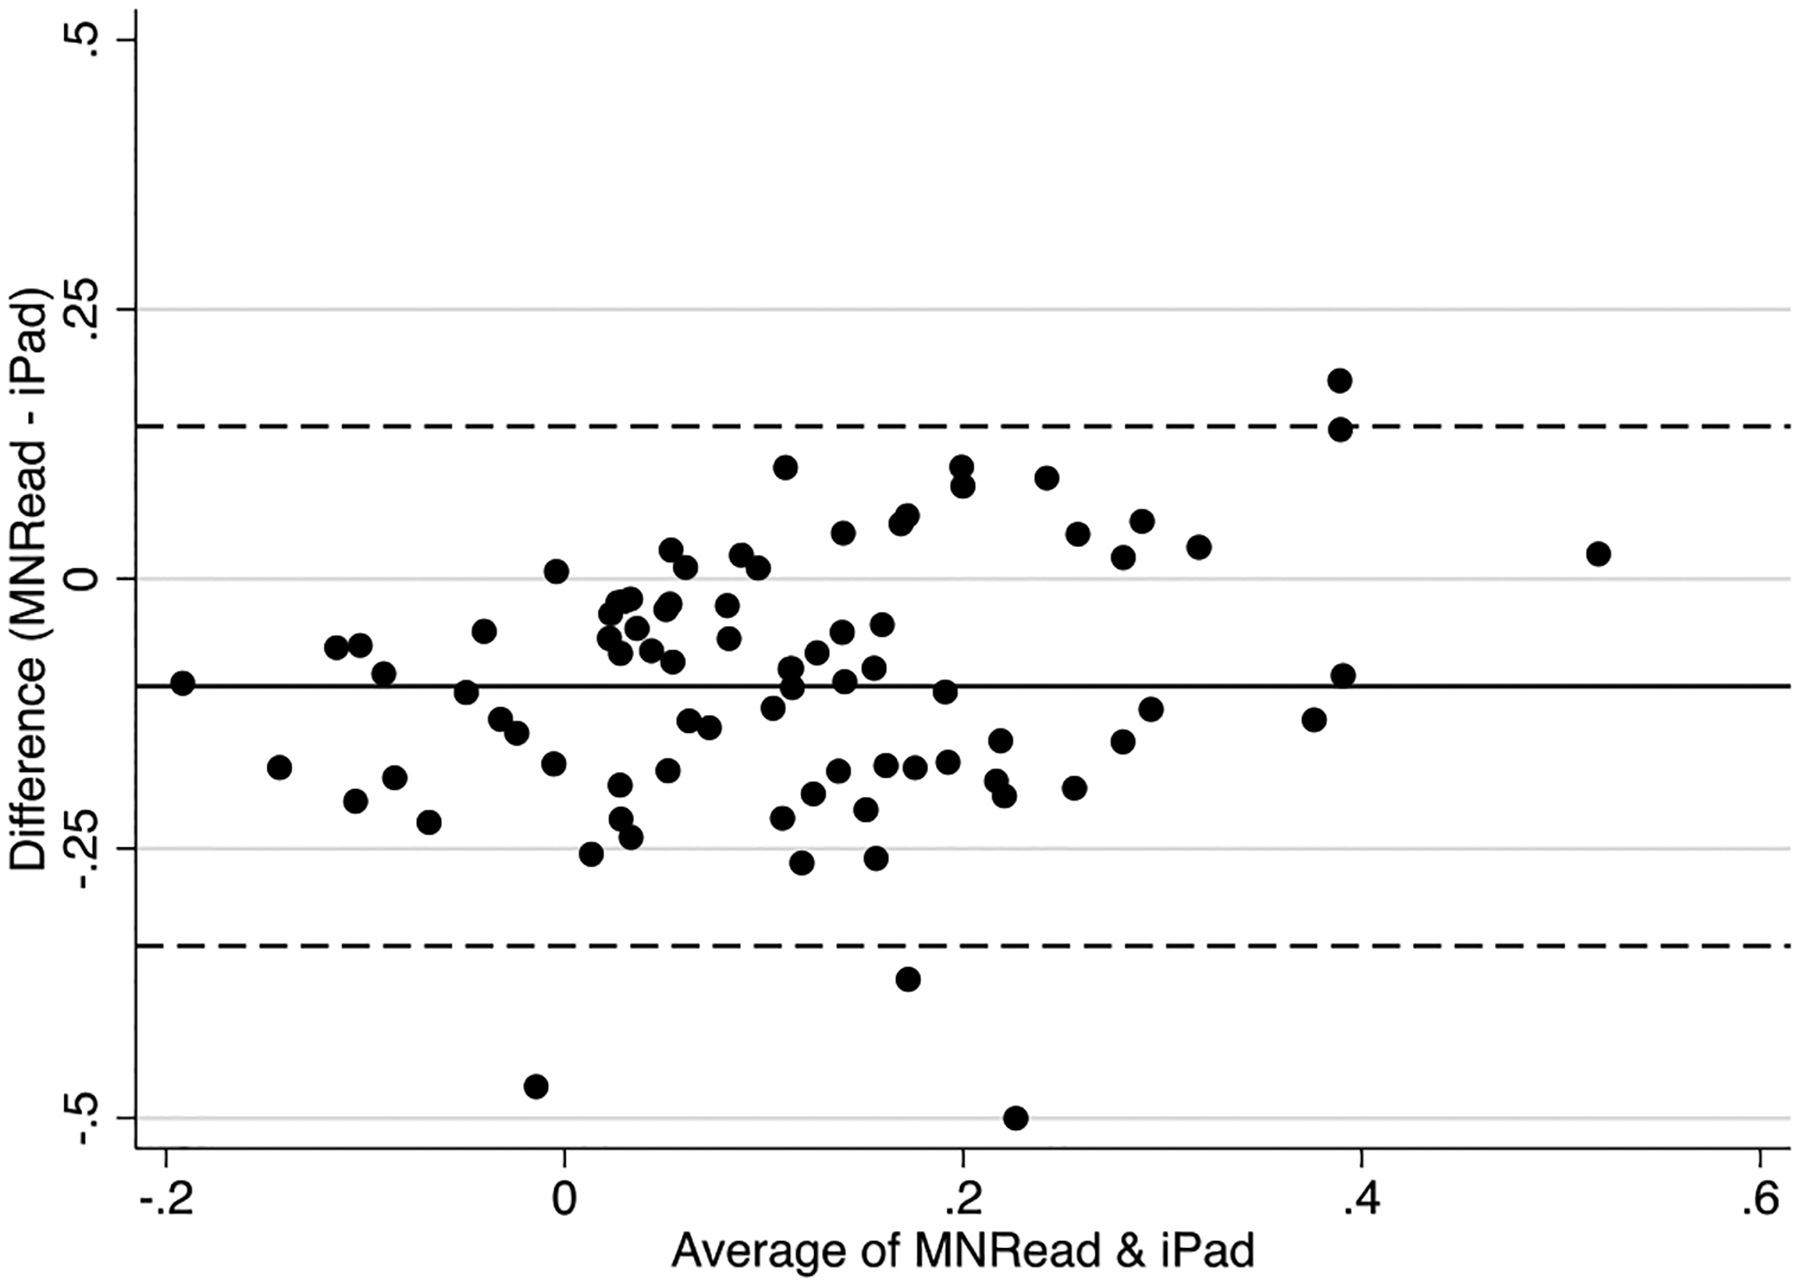
Note: Dashed line= 95% limits of agreement; Solid line= mean
Funding:
This work was supported by the National Institutes of Health under grant K23EY027848 (to JRE) and grant K01AG052640 (to BKS).
Footnotes
Commercial Relationships Disclosures: JRE has worked with Ridgevue Vision on other projects but has not received any compensation from Ridgevue Vision at any time. Ridgevue Vision provided the iBook used in this study free of charge but had no role in the design or conduct of this study or the decision to publish its findings.
This submission has not been published anywhere previously and is not simultaneously being considered for any other publication. This paper was previously reviewed by Translational Vision Science & Technology and rejected since its population health focus was deemed to not align with the journal’s emphasis on translational research.
REFERENCES
- 1.Varma R, Vajaranant TS, Burkemper B, et al. Visual impairment and blindness in adults in the United States: demographic and geographic variations from 2015 to 2050. JAMA Ophthalmol. 2016;134:802–809. [DOI] [PMC free article] [PubMed] [Google Scholar]
- 2.West SK, Munoz B, Rubin GS, et al. Function and visual impairment in a population-based study of older adults. The SEE project. Salisbury Eye Evaluation. Invest Ophthalmol Vis Sci. 1997;38:72–82. [PubMed] [Google Scholar]
- 3.Eramudugolla R, Wood J, Anstey KJ. Co-morbidity of depression and anxiety in common age-related eye diseases: a population-based study of 662 adults. Front Aging Neurosci. 2013;5:56. [DOI] [PMC free article] [PubMed] [Google Scholar]
- 4.Swenor BK, Wang J, Varadaraj V, et al. Vision impairment and cognitive outcomes in older adults: the health ABC study. J Gerontol A Biol Sci Med Sci. 2019;74:1454–1460. [DOI] [PMC free article] [PubMed] [Google Scholar]
- 5.Sattarnezhad N, Farrow S, Kimbrough D, et al. Agreement analysis comparing iPad LCVA and Sloan testing in multiple sclerosis patients. Mult Scle J. 2018;24:1126–1130. [DOI] [PubMed] [Google Scholar]
- 6.Habtamu E, Bastawrous A, Bolster NM, et al. Development and Validation of a Smartphone-based Contrast Sensitivity Test. Transl Vis Sci Techn. 2019;8:13–13. [DOI] [PMC free article] [PubMed] [Google Scholar]
- 7.Rono H, Bastawrous A, Macleod D, et al. Peek Community Eye Health-mHealth system to increase access and efficiency of eye health services in Trans Nzoia County, Kenya: study protocol for a cluster randomised controlled trial. Trials. 2019;20:502. [DOI] [PMC free article] [PubMed] [Google Scholar]
- 8.Calabrèse A, To L, He Y, et al. Comparing performance on the MNREAD iPad application with the MNREAD acuity chart. J Vis. 2018;18:8–8. [DOI] [PMC free article] [PubMed] [Google Scholar]
- 9.Black J, Jacobs R, Phillips G, et al. An assessment of the iPad as a testing platform for distance visual acuity in adults. BMJ Open. 2013;3:e002730. [DOI] [PMC free article] [PubMed] [Google Scholar]
- 10.Bastawrous A, Rono HK, Livingstone IA, et al. Development and validation of a smartphone-based visual acuity test (peek acuity) for clinical practice and community-based fieldwork. JAMA Ophthalmol. 2015;133:930–937. [DOI] [PMC free article] [PubMed] [Google Scholar]
- 11.Berger E The iPad: gadget or medical godsend? Ann Emerg Med. 2010;56:A21–A22. [DOI] [PubMed] [Google Scholar]
- 12.Dorr M, Lesmes LA, Lu Z-L, et al. Rapid and reliable assessment of the contrast sensitivity function on an iPad. Invest Ophthalmol Vis Sci. 2013;54:7266–7273. [DOI] [PMC free article] [PubMed] [Google Scholar]
- 13.Johnson CA, Thapa S, Kong YXG, et al. Performance of an iPad application to detect moderate and advanced visual field loss in Nepal. Am J Ophthalmol. 2017;182:147–154. [DOI] [PubMed] [Google Scholar]
- 14.Rodríguez-Vallejo M, Llorens-Quintana C, Furlan WD, et al. Visual acuity and contrast sensitivity screening with a new iPad application. Displays. 2016;44:15–20. [Google Scholar]
- 15.Kollbaum PS, Jansen ME, Kollbaum EJ, et al. Validation of an iPad test of letter contrast sensitivity. Optom Vis Sci. 2014;91:291–296. [DOI] [PubMed] [Google Scholar]
- 16.Reyes-Ortiz CA, Kuo YF, DiNuzzo AR, et al. Near vision impairment predicts cognitive decline: data from the Hispanic Established Populations for Epidemiologic Studies of the Elderly. J Am Geriatr Soc. 2005;53:681–686. [DOI] [PubMed] [Google Scholar]
- 17.Keller BK, Morton JL, Thomas VS, et al. The effect of visual and hearing impairments on functional status. J Am Geriatr Soc. 1999;47:1319–1325. [DOI] [PubMed] [Google Scholar]
- 18.Klein BE, Moss SE, Klein R, et al. Associations of visual function with physical outcomes and limitations 5 years later in an older population: the Beaver Dam eye study. Ophthalmology. 2003;110:644–650. [DOI] [PubMed] [Google Scholar]
- 19.Man REK, Gan ATL, Fenwick EK, et al. Utilizing Uniocular Visual Acuity Substantially Underestimates the Impact of Visual Impairment on Quality of Life Compared to Binocular Visual Acuity. Ophthalmology. 2020. [DOI] [PubMed] [Google Scholar]
- 20.Giavarina D Understanding bland altman analysis. Biochemia medica: Biochemia medica. 2015;25:141–151. [DOI] [PMC free article] [PubMed] [Google Scholar]
- 21.Aslam TM, Parry NR, Murray IJ, et al. Development and testing of an automated computer tablet-based method for self-testing of high and low contrast near visual acuity in ophthalmic patients. Graefes Arch Clin Exp Ophthalmol. 2016;254:891–899. [DOI] [PubMed] [Google Scholar]
- 22.Fricke TR, Tahhan N, Resnikoff S, et al. Global prevalence of presbyopia and vision impairment from uncorrected presbyopia: systematic review, meta-analysis, and modelling. Ophthalmology. 2018;125:1492–1499. [DOI] [PubMed] [Google Scholar]


