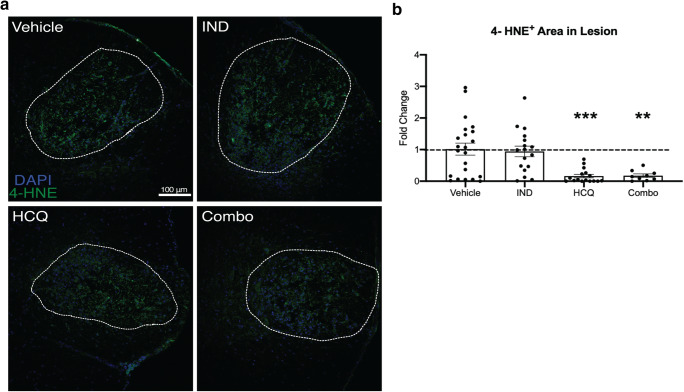
Fig. 8.
HCQ and combination treatment reduce lipid peroxidation in vivo. (A) Representative images of the day 3 lysolecithin lesion for all treatment groups. Images are overlays of 4-HNE (green) for lipid peroxidation and DAPI (blue) for nuclei; the DAPI signal has been reduced to illuminate the 4-HNE better. White dashed line depicts lesion area. (B) Percent of the lesion containing 4-HNE+ immunofluorescence. Graph represents the mean with error bars depicting SEM. Data were analyzed using a one-way ANOVA with Dunnett’s post hoc multiple comparison test, compared to vehicle treatment; **p < 0.01; ***p < 0.001. Each data point represents one animal, normalized and represented as fold change of the vehicle group. Horizontal dashed line represents fold change of 1 (the mean of vehicle group). IND: indapamide, HCQ: hydroxychloroquine

