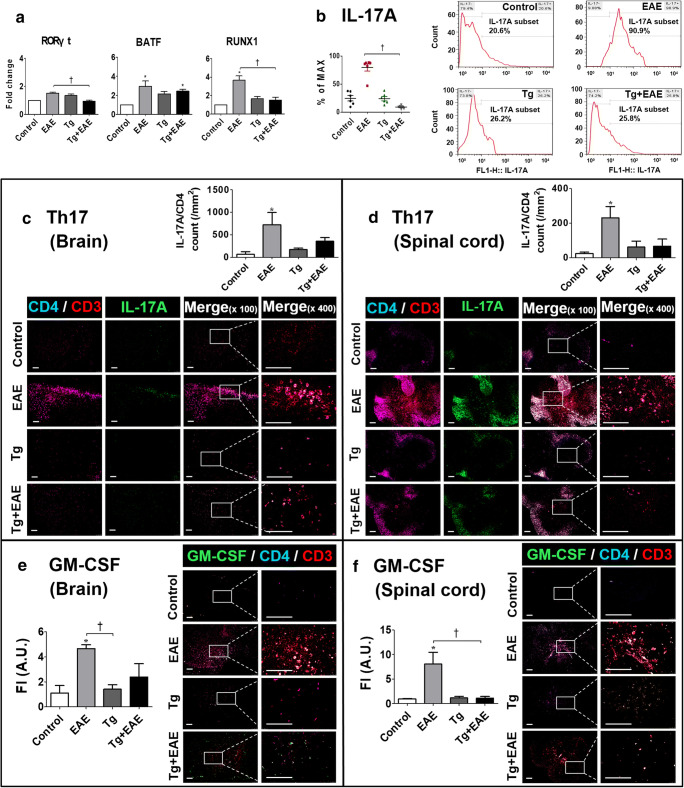
Fig. 9.
Changes in transcriptional regulators of IL-17A and protein expression of IL-17A. (a) Gene expression of RORγt/BATF/RUNX1. (b) FACS analysis of IL-17A–expressing brain cells. (c, d) Distribution of CD3+/CD4+/IL-17A triple-stained cells in the brain and spinal cord. Triple-stained cells were counted by particle analysis using ImageJ. (e, f) Distribution of CD3+/CD4+/GM-CSF triple-stained cells in the brain and spinal cord. The fluorescence intensity of GM-CSF–expressing Th cells in the brain and spinal cord was quantified using ImageJ software. Scale bar indicates 100 μm. Asterisk indicates significant difference compared to control levels (*p < 0.05). Dagger indicates significant difference between experimental groups (†p < 0.05).

