Abstract
In amyotrophic lateral sclerosis (ALS), motor neuron degeneration occurs simultaneously with systemic metabolic dysfunction and neuro-inflammation. The fibroblast growth factor 21 (FGF21) plays an important role in the regulation of both phenomena and is a major hormone of energetic homeostasis. In this study, we aimed to determine the relevance of FGF21 pathway stimulation in a male mouse model of ALS (mutated SOD1-G93A mice) by using a pharmacological agonist of FGF21, R1Mab1. Mice (SOD1-WT and mutant SOD1-G93A) were treated with R1Mab1 or vehicle. Longitudinal data about clinical status (motor function, body weight) and biological parameters (including hormonal, immunological, and metabolomics profiles) were collected from the first symptoms to euthanasia at week 20. Multivariate models were performed to identify the main parameters associated with R1Mab1 treatment and to link them with clinical status, and metabolic pathways involving the discriminant metabolites were also determined. A beneficial clinical effect of R1Mab1 was revealed on slow rotarod (p = 0.032), despite a significant decrease in body weight of ALS mice (p < 0.001). We observed a decrease in serum TNF-α, MCP-1, and insulin levels (p = 0.0059, p = 0.003, and p = 0.01, respectively). At 16 weeks, metabolomics analyses revealed a clear discrimination (CV-ANOVA = 0.0086) according to the treatment and the most discriminant pathways, including sphingolipid metabolism, butanoate metabolism, pantothenate and CoA biosynthesis, and the metabolism of amino acids like tyrosine, arginine, proline, glycine, serine, alanine, aspartate, and glutamate. Mice treated with R1Mab1 had mildly higher performance on slow rotarod despite a decrease on body weight and could be linked with the anti-inflammatory effect of R1Mab1. These results indicate that FGF21 pathway is an interesting target in ALS, with a slight improvement in motor function combined with metabolic and anti-inflammatory effects.
Electronic supplementary material
The online version of this article (10.1007/s13311-020-00933-3) contains supplementary material, which is available to authorized users.
Keywords: Amyotrophic lateral sclerosis, Metabolomics, FGF21, R1Mab1, Therapeutic antibody, SODG93A
Introduction
Amyotrophic lateral sclerosis (ALS) is a progressive neurodegenerative disorder characterized by the selective death of motor neurons, leading to the patient’s death 2 to 5 years after diagnosis [1]. Metabolic disturbances play an important role in different tissues, especially muscle and brain, in this disease [2]. Despite the progress made in the understanding of the pathophysiological mechanisms involved in ALS, the interactions among these pathways are not completely known. As no study has enabled the successful determination of a treatment, except for riluzole [3, 4] or edaravone [5], the research in drug development remains a priority for ALS.
Among the main pathophysiological mechanisms involved in ALS, neuro-inflammation and metabolic alterations have been thoroughly described, and several studies show a link between both mechanisms. Indeed, the signaling cascades activated by inflammatory cytokines can modulate insulin signaling, particularly in adipose tissue, liver, skeletal muscle, and the central nervous system [6, 7]. The fibroblast growth factor 21 (FGF21) plays a key role in energy metabolism and inflammatory response. FGF21 may act as an autocrine, paracrine, or endocrine molecule in the insulin-sensitizing effects. In this context and motivated by the necessity of targeting multiple mechanisms at once, we hypothesized that modulation of the FGF21 pathway could represent an interesting strategy for ALS management. We used R1Mab1 (Genentech USA, San Francisco, CA), an IgG humanized agonistic antibody directed to the D3 domain of the FGF receptor 1 (FGFR1), to induce attenuation of the metabolic disturbance and the pro-inflammatory effects observed in ALS.
Accordingly, we aimed to clarify whether activation of FGFR1 may be beneficial to ALS patients, especially via inflammatory and metabolic protective mechanisms. Thus, the effects of the FGF21 pathway were determined by its stimulation in an ALS mouse model (SOD1-G93A transgenic mice mSOD1) using a FGFR1 antibody (R1Mab1). Metabolomics and hormonal and immunological findings as well as evolution of motor symptoms in mSOD1 mice treated with R1Mab1 were analyzed. Beyond the determination of the putative protective effect of R1Mab1, we thoroughly assessed the mechanism of action of a therapeutic agent targeting two mechanisms of utmost importance in the context of ALS.
Materials and Methods
Animals
Twenty-four SOD1-G93A (mSOD1) male mice, on a C57Bl/6J genetic background, and 24 male SOD1-wild-type C57Bl/6J (WT) controls were acquired from Charles Rivers Laboratory (Burlington, CA; strains #004435 and #000664, respectively). They were housed in groups of 3–5 per cage in a virus-free barrier facility under a 12-h light/dark cycle, with ad libitum access to food and water.
All animal experiments followed current European Union regulations (Directive 2010/63/EU), as recommended by the regional ethics committee for animal experimentation (CEEA Val de Loire decision #19).
R1Mab1 Treatment
R1Mab1, IgG humanized monoclonal antibody with agonistic activity on the fibroblast growth factor receptor 1 (FGFR1), was graciously provided by Genentech (San Francisco, CA) under a Material Transfer Agreement. A loading dose of 3 mg/kg of body weight was first injected intraperitoneally (i.p.) into 12 mSOD1 and 14 WT mice 12 weeks after birth, followed by 1 injection of 0.5 mg/kg at 16 weeks after birth. 12 mSOD1 and 10 WT control mice received phosphate buffer saline (PBS) following the same schedule of treatment. The administration and sample collection protocol are shown on Fig. 1.
Fig. 1.
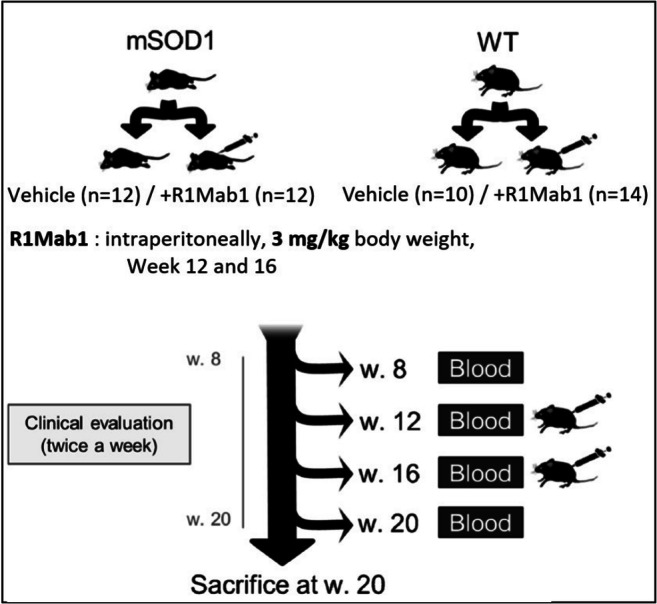
Flowchart for sample collection design, 3 mg/kg of body weight were first injected intraperitoneally into 12 mSOD1 and 14 WT mice 12 weeks after birth, followed by 1 injection of 0.5 mg/kg at 16 weeks after birth. 12 mSOD1 and 10 WT control mice received phosphate buffer saline following the same schedule. Submandibular collection of blood was performed at 8, 12, 16, and 20 weeks. Mice were euthanized 20 weeks
Sample Collection
Submandibular collection of blood (150-275 μL or 11 mL/kg body mass) was performed 8, 12, 16, and 20 weeks after birth, without the use of anesthesia. Mice were euthanized 20 weeks after birth by cervical dislocation.
Evaluation of Symptom Progression
Disease progression was assessed by monitoring body weight and locomotor performance. From the age of 7 weeks to the time of euthanasia, each animal in all experimental groups was weighed twice per week. The rotarod test was used to assess mouse locomotor performance once per week from 8 weeks of age to 13 weeks and twice per week from 13 weeks of age until week 20. Testing began by placing the mice on a rod (diameter = 3.5 cm) rotating at a constant speed of 25 rpm (fast rotarod). The time taken before the mice fell off the rod was recorded and used as a measure of motor function (test limited to 5 min maximum). Three trials were performed, and the longest time spent on the rod was recorded. From the 18th week on, another attempt was made at a speed of 15 rpm for 3 min (slow rotarod). The age of the mice at the first failure in this last attempt was also recorded and used as another locomotor performance outcome.
Hormone and Cytokine Assessment
Serum samples (10 μL) collected from mice at 8, 12, 16, and 20 weeks of age were collected to measure IL-6, insulin, leptin, MCP-1, resistin, and TNF-α using a Milliplex MAP magnetic bead assay (Millipore, Billerica, MA) and Milliplex Analyzer (Luminex, Austin, TX). The detection limit was 3.2 pg/mL for each analyte after application of the manufacturer’s protocol. Data were analyzed using Milliplex Analyst 5.1 software.
Metabolomics Analysis
LC-HRMS analysis was performed as previously described [8, 9] after an extraction with 100 μL of methanol and using a UPLC Ultimate WPS-3000 system (Dionex, Germany) coupled to a Q-Exactive mass spectrometer (Thermo Fisher Scientific, Bremen, Germany) and operated in positive (ESI+) and negative (ESI−) electrospray ionization modes (analysis for each ionization mode). Liquid chromatography was performed using a Phenomenex Kinetex 1.7 μm XB – C18 column (100 mm × 2.10 mm) maintained at 40 °C. Two mobile phase gradients (preceded by an equilibrium time of 3 min) were used. The gradient operated at a flow rate of 0.4 mL/min over a runtime of 26.5 min. Analyses were also performed on a hydrophilic interaction liquid chromatography (HILIC) column (100 mm × 2.10 mm, 100 Å). During the full-scan acquisition, which ranged from 58 to 870 m/z, the instrument operated at 70,000 resolution (m/z = 200). To validate the preanalytical and analytical steps of the experiment, quality control (QC) samples (mix of 15 samples analyzed) were analyzed as follows: coefficients of variation [CV% = (the standard deviation/mean) × 100] were calculated from all metabolites data. Metabolites having a CV in QCs > 30% were excluded from the final dataset. QCs were analyzed at the beginning of the run, every 10 samples and at the end of the run.
Accordingly, the final dataset contained only metabolites presenting low preanalytical and analytical variabilities.
For this targeted analysis, a library of standard compounds (Mass Spectroscopy Metabolite Library (MSML®) of standards, IROA Technologies™) was analyzed. The identity of each metabolite was characterized according to several criteria: 1) the retention time of the detected metabolite must be within ± 20 s of the standard reference, (2) the exact measured of molecular mass of the metabolite must be within a range of 10 ppm around the known molecular mass of the reference compound, and (3) the isotopic ratios of the metabolite must correspond to the standard reference. The signal value was calculated using Xcalibur® software (Thermo Fisher Scientific, San Jose, CA) by integrating the chromatographic peak area corresponding to the selected metabolite.
Gene Expression Analysis
Total RNA was extracted using Trizol from muscle samples (R1Mab1 mSOD1 n = 5; vehicle-treated mSOD1 n = 5) obtained at week 20 and then purified with DirectZol kit (Takara, reference R2052). One microgram of RNA was used to generate cDNA using a PrimeScript RT reagent kit (Takara, reference RR037A). β-Actin gene was used as reference gene. PCR amplifications were done in duplicates using a Sybrgreen Takion kit (Eurogentec reference UE-NSMT-B0701) and a LightCycler480 (Roche). Primers used for quantitative real-time PCR of genes including uncoupling protein 1 (UCP-1), peroxisome proliferator activated receptor α (PPARα), and PPARγ were based on that previously described [10] and are listed in Table S1. Data were normalized to the reference gene and to the control according to the 2−∆∆Ct method with Excel (Microsoft, Redmond, WA). Reverse transcriptase control, complementary DNA control, and positive PCR control were within the accepted range.
Statistical Analysis
Clinical and Biological Data
Body weight data were analyzed as the relative variation in body weight at each time and using the weight at the beginning of treatment (week 12) as the reference.
For each continuous variable (clinical, cytokine, and hormone findings), comparisons between subgroups were performed by Wilcoxon signed-rank test when the Student’s t test was not applicable.
The effect of time on continuous variable was analyzed using Friedman test when ANOVA was not applicable and was also evaluated between subgroups using 2-way ANOVA.
The significance threshold (p value) was set at 0.05 and was corrected for multiple tests when necessary with the Benjamini–Hochberg procedure.
Metabolomics Data
Metabolomics data were analyzed using multivariate analysis by Principal Component Analysis (PCA) and Orthogonal Partial Last Square Discriminant Analysis (OPLS-DA), with Simca P+ version 13.0 (Umetrics, Umea, Sweden) to 1) evaluate metabolic modification in mSOD1 mice treated with R1Mab1 versus placebo; 2) identify the metabolic modifications associated with R1Mab1 and specific to ALS conditions (after comparison with WT mice); and 3) determine the metabolites linked to the clinical outcome of treated mSOD1 mice.
PCA and OPLS-DA were performed for each time point (weeks 12, 16, and 20). The significance of the OPLS-DA model was evaluated by the CV-ANOVA test (based on F test to determine whether the variance of cross-validated residuals is significantly smaller than the variation of each Yi near the mean value of Y [11], with a significant threshold set at 0.05. The Q2Ycum and the R2Ycum values correspond to the goodness of prediction and the goodness of fit, respectively. We considered a model with Q2Y cum > 0.4 to be a sufficiently predictive model. The models were cross-validated by withholding one-seventh of the samples in seven simulations. The most relevant variables were determined from the variable importance for the projection (VIP) and loading values scaled as correlation coefficients (pcorr). VIP values represent the importance of the variable for the OPLS-DA models, and loadings characterize the relation between Y and X variables; they were considered relevant if VIP > 1 and pcorr > 0.4.
Venn diagrams were generated to highlight common and distinct metabolites identified from the multivariate models (including comparisons between mice groups).
Pathway Analysis
Pathway impact represents a combination of the centrality and pathway enrichment results; higher impact values represent the relative importance of the pathway, relative to all pathways included in the analysis. Metabolic pathways are represented as a network of chemical compounds with metabolites as nodes and reactions as edges. Major criteria are used to perform an informative analysis regarding the quality of pathway data. These data were downloaded from the KEGG database [12]. Chemical compounds and pathway topology information were obtained from the KEGG graph package [13], and the current library contains 874 metabolic pathways from mice.
The KEGG pathway database (http://www.genome.jp/kegg/pathway.html) was used with the Metaboanalyst tool to explore the highlighted metabolic pathways [14]. To focus on the most relevant data, we highlighted only the pathways that had significant Holm p value < 0.05 and a pathway impact > 0.05. The pathway impact value was calculated as the sum of importance measures of the metabolites, normalized by the sum of importance measures of all metabolites in each pathway [13].
Results
Clinical Data
Important Weight Loss in Mice Treated with R1Mab1
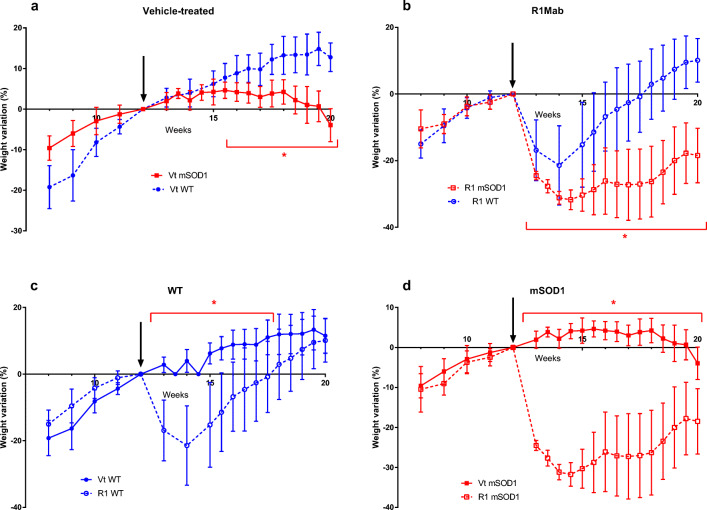
We observed a global trend of weight loss in R1Mab1- and vehicle-treated mSOD1 mice over the course of the disease (Fig. 2a–d). Vehicle-treated WT mice had a higher weight gain than vehicle-treated mSOD1 from week 16 (+ 7.74% vs + 4.64%; p = 0.017) until week 20 (+ 12.77% vs − 3.95%; p < 0.001) (Fig. 2a). R1Mab1 mSOD1 mice had a higher decrease in body weight than R1Mab1 WT from the week after the injection, week 13 (− 24.51% vs − 16.89%; p = 0.0086) to the sacrifice at week 20 (− 18.47% vs + 10.1%; p < 0.0001) (Fig. 2b). R1Mab1 WT mice also had a significant higher weight loss versus vehicle-treated WT from week 13 (− 16.89% vs + 2.83%); p < 0.0001) to week 17 (+ 2.94% vs + 10.31%; p = 0.0121) (Fig. 2c). mSOD1 mice treated with R1Mab1 had a significant weight loss compared to vehicle-treated mSOD1 after week 13 (− 24.51% vs + 1.95%; p < 0.0001) until week 20 (− 18.47% vs − 3.95%; p < 0.0001) (Fig. 2d).
Fig. 2.
Body weight data were analyzed as the relative change in body weight using the weight at the beginning of the treatment (week 12) as the reference. The change in body weight was compared at each time point. Error bars represent standard error of the mean. *p < 0.05
Better Performance in Slow Rotarod in R1Mab1-Treated mSOD1 Mice
We observed a progressive decrease in fast rotarod performance in mSOD1 mice from week 14 to the end of the study. There was no global difference between R1Mab1- and vehicle-treated mSOD1 mice in fast rotarod performance. We observed an improvement in R1Mab1 mSOD1 versus vehicle-treated mSOD1 for the performance of the slow rotarod from week 18 to the end of the study with significant difference at week 20 (p = 0.032) (Fig. 3).
Fig. 3.
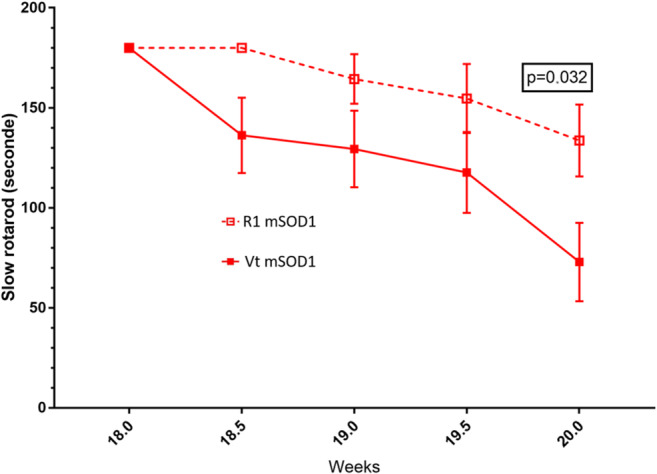
Slow rotarod performance between vehicle-treated and R1Mab1-treated mSOD1 mice. Lower performance of Vt mSOD1 versus R1 mSOD1 at week 20 (p = 0.032)
Hormone and Cytokine Assessment
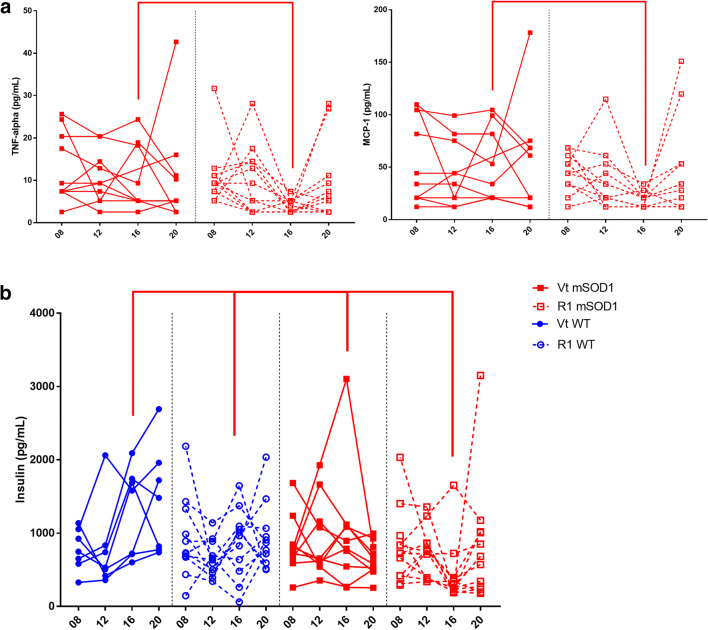
We observed a reduction in TNF-α and MCP-1 in R1Mab1 mSOD1 versus vehicle-treated mSOD1 at week 16 (p = 0.0068 and p = 0.0147, respectively) (Fig. 4a) and a reduction in insulin in R1Mab1 mSOD1 versus overall at week 16 (Fig. 4b) (R1Mab1 mSOD1 vs vehicle-treated mSOD1, p = 0.01; R1Mab1 mSOD1 vs vehicle-treated WT, p = 0.0181; and R1Mab1 mSOD1 vs vehicle-treated WT p = 0.001).
Fig. 4.
Longitudinal hormonal and cytokine result of interest at week 8, 12, 16, and 20 between vehicle-treated WT, R1mab1 WT, vehicle-treated mSOD1, and R1mab1 mSOD1. (a) Lower TNF-α and MCP-1 result between R1 mSOD1 versus Vt mSOD1 at week 16 (p = 0.0068; p = 0.0147, respectively). (b) Insulin result of R1 mSOD1 is lower versus Vt mSOD1 (p = 0.01), R1 WT (p = 0.0181), and Vt WT (p = 0.001)
One result from vehicle-treated mSOD1 at week 16 looked like an outlier for TNF-α, MCP-1, and was excluded. Statistical analysis performed before and after exclusion of this subject found similar results.
Metabolomics Analysis
After the exclusion of metabolites having a CV in QCs > 30%, a total of 192 metabolites were available for statistical analysis.
Performances of multivariate models between R1Mab1, vehicle-treated, mSOD1 or WT, were correct (Q2 > 0.50 and p < 0.05) in most cases (Table 1), thus confirming that the metabolome of mice is modified under R1Mab1 treatment.
Table 1.
Summary of the OPLSDA performance
| R2X(cum) | R2Y(cum) | Q2(cum) | CV ANOVA | |
|---|---|---|---|---|
| W12 WT versus mSOD1 | 0.695 | 1 | 0.738 | 0.0068 |
| W16 VtWT versus R1WT | 0.529 | 1 | 0.652 | 0.0706 |
| W16 VtmSOD1 versus R1mSOD1 | 0.553 | 1 | 0.774 | 0.0086 |
| W16 VtTW versus VtmSOD1 | 0.435 | 1 | 0.751 | 0.0226 |
| W16 R1WT versus R1mSOD1 | 0.262 | 1 | 0.534 | 0.0005 |
| W20 VtTW versus R1WT | 0.693 | 1 | 0.875 | 0.0016 |
| W20 VtmSOD1 versus R1mSOD1 | 0.384 | 1 | 0.401 | 0.1396 |
| W20 VtTW versus R1mSOD1 | 0.725 | 1 | 0.782 | 0.0589 |
| W20 R1WT versus R1mSOD1 | 0.576 | 1 | 0.703 | 0.0136 |
CV ANOVA in italics are significant
W12 week 12, W16 week 16, W20 week 20, Vt WT vehicle-treated wild type, VtmSOD1 vehicle-treated mSOD1, R1WT R1Mab1 wild type, R1mSOD1 R1Mab1 mSOD1
Early Metabolic Disturbance in mSOD1 Versus Wild-Type Mice Before Treatment
The first multivariate model discriminating mSOD1 and WT at week 12 (Table 2) revealed 14 discriminant metabolites (Table 2), among which 4 metabolites were identified with Wilcoxon univariate test after Benjamini–Hodchberg correction for multiple tests (1-oleyl-rac-glycerol, p = 0.0009; 3-methylhistidine, p = 0.0019; glucose 1-phosphate, p = 0.0017; and nicotine, p = 0.0007).
Table 2.
Summary of the variable of importance (VIP[1] > 1; p(corr)[1] > 0.4) highlighted by the multivariate model (mSOD1 vs WT before treatment at week 12)
| Multivariate model week 12 | |
| 1-OLEOYL-RAC-GLYCEROL | |
| 3-METHYLHISTIDINE | |
| 5′-METHYLTHIOADENOSINE | |
| CINNAMATE | |
| CITRULLINE | |
| FORMYL-L-METHIONYL PEPTIDE | |
| GLUCOSE 1-PHOSPHATE | |
| L-KYNURENINE | |
| LUMICHROME | |
| METHYL INDOLE-3-ACETATE | |
| N-AMIDINO-L-ASPARTATE | |
| NICOTINAMIDE | |
| NICOTINE | |
| RIBOSE |
Variables with significant univariate test are in italics
Modification of the Metabolome at Week 16 in Mice Treated by R1Mab1
The global OPLS-DA showed a clear separation of the different groups involving different metabolic pathways at week 16 (Fig. 5).
Fig. 5.
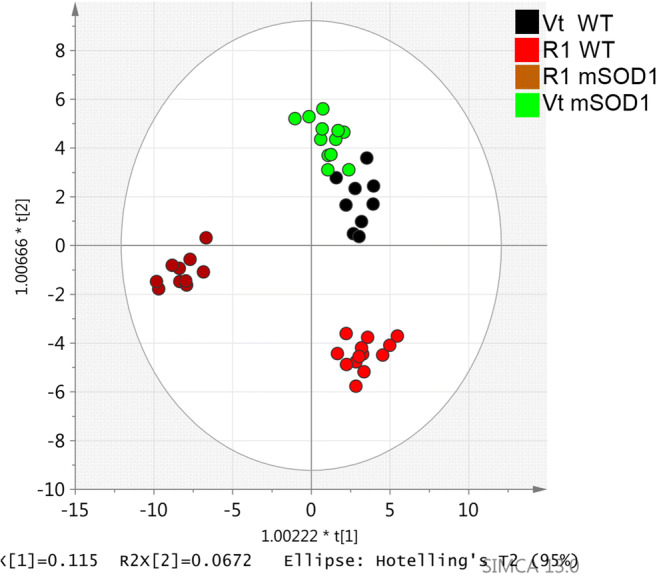
Orthogonal partial least squares discriminant analysis (OPLS-DA) scatter plot for serum metabolome, at 16 weeks, obtained from mutant superoxide dismutase 1 (mSOD1) mice (n = 22), treated with R1Mab1 (n = 10), in brown, or vehicle treated (n = 12), in light green; wild-type (WT) mice (n = 22), treated with R1Mab1 (n = 13), in red, or vehicle treated (n = 9), in black. This plot is representative of the metabolic effect of the R1Mab1 between WT and mSOD1 mice
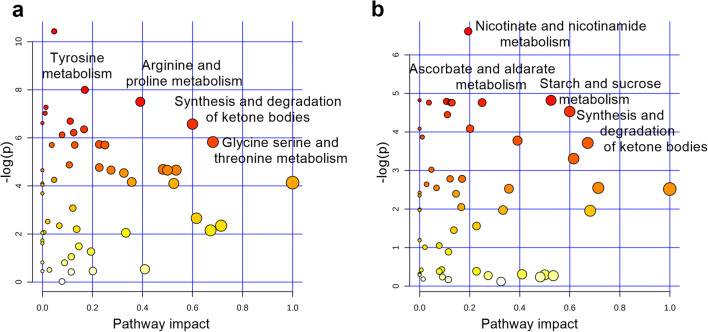
Between R1Mab1- and vehicle-treated mSOD1 mice, 60 major discriminating metabolites were identified, including 50 (83%) that were not discriminant in WT mice. Importantly, blood serine concentrations were increased in R1Mab1- versus vehicle-treated mSOD1 mice over time (p < 0.0001). The most involved pathways in the discrimination of specifically R1Mab1- and vehicle-treated mSOD1 mice (Fig. 6a) were the following: tyrosine metabolism (l-tyrosine, epinephrine); arginine and proline metabolism (4-acetaminobutanoate, l-proline, guanidinoacetate); butanoate metabolism (acetoacetate, succinate); synthesis and degradation of ketone bodies (acetoacetate); pentose and glucuronate interconversions (l-arabitol, d-glucuronate); pantothenate and CoA biosynthesis (panthotenate, l-aspartate, 5,6-dihydrouracil, uracil); glycine, serine, and threonine metabolism (l-cystathione, l-serine, betaïne); and alanine, aspartate, and glutamate metabolism (l-aspartate, l-alanine, l-glutamine, l-asparagine).
Fig. 6.
(a) Summarizes the main highlighted pathways involved in the discrimination of specifically R1Mab1 and vehicle-treated mSOD1 mice, including tyrosine metabolism, arginine and proline metabolism, synthesis and degradation of ketone bodies, and glycine, serine, and threonine metabolism. (b) Summarizes the main highlighted pathways involved in the discrimination of specifically R1Mab1 and vehicle-treated WT mice, including nicotinate and nicotinamide metabolism, starch and glucose metabolism, ascorbate and aldarate metabolism (myo-inositol, d-glucuronate), synthesis and degradation of ketone bodies
Thirty-three metabolites were relevant for the discrimination of R1Mab1- versus vehicle-treated WT mice, including 23 (70%) that were not discriminant in mSOD1 mice. These metabolites highlighted pathways (Fig. 6b) including nicotinate and nicotinamide metabolism (nicotinamide), starch and glucose metabolism (d-glucose), galactose metabolism (d-glucose, myo-inositol, galactilol), pentose and glucuronate interconversions (l-arabitol, l-arabinose, d-glucuronate), ascorbate and aldarate metabolism (myo-inositol, d-glucuronate), synthesis and degradation of ketone bodies (acetoacetate), and glycerophospholipid metabolism (sn-glycerol-3-phosphate, ethanolamine phosphate).
Modification of the Metabolome at Week 20 in Mice Treated by R1Mab1
At week 20, between mSOD1 mice, 19 metabolites were discriminant but no pathway was clearly identified (holm p > 0.05).
Twenty-five metabolites were discriminant between R1Mab1- and vehicle-treated WT mice, and they are mainly involved in the degradation of lysine (amino-adipate, 4-guanidinobutanoate, and l-hydroxylysine).
Specificity of Metabolome in ALS Mice Treated by R1Mab1
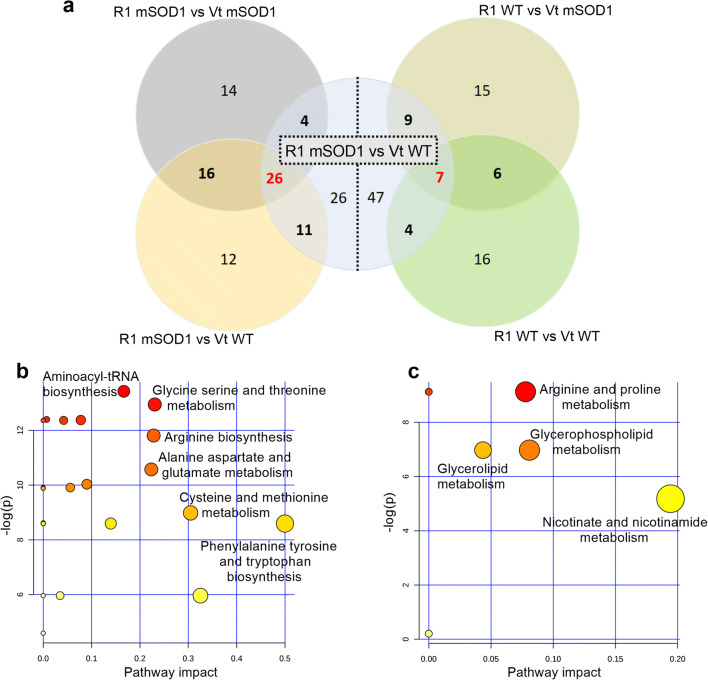
At week 16, the cross laps of the multivariate model of the R1Mab1 mSOD1 mice versus R1Mab1 WT, vehicle-treated mSOD1 and WT found 26 highly specific metabolites (Fig. 7) and highlighted the following metabolic pathways: aminoacyl-tRNA biosynthesis (Holm p < 0.0001), glycine serine and threonine metabolism (Holm p < 0.0001), arginine and proline metabolism (Holm p < 0.0001), arginine biosynthesis (Holm p = 0.0001), alanine aspartate and glutamate metabolism (Holm p = 0.0004), cysteine and methionine metabolism (holm p = 0.0012), and phenylalanine tyrosine and tryptophan biosynthesis (Holm p = 0.0016) (Fig. 7b).
Fig. 7.
(a) The left side shows the metabolite redundancy involved in discrimination of R1Mab1 mSOD1 mice; the right side shows this for the R1Mab1 wild-type mice, at week 16. (b) Summarizes the main highlighted pathways by the most redundant metabolites of the R1Mab1 mSOD1 mice. (c) Summarizes the main highlighted pathways by the most redundant metabolites of the R1Mab1 WT mice
At week 20, the cross laps of the multivariate model of the R1Mab1 mSOD1 mice versus R1Mab1 WT, vehicle-treated mSOD1 and WT failed to identify any specific metabolites.
Relationship Between the Metabolome and Clinical Outcome in Treated mSOD1 Mice
Univariate analysis showed no significant correlation between metabolite concentrations and decrease in rotarod performance.
Multivariate analysis to explain the positive results of the slow rotarod test at week 20 in mSOD1 mice found the involvement of the β-alanine pathway (β-alanine, l-anserine). But the performance of these models revealed a promising Q2 > 0.8 but a poor value of the CV-ANOVA (p > 0.05).
Gene Expression Analysis
We observed UCP-1 mRNA was significantly upregulated in the quadriceps muscle at week 20 in R1Mab1 mSOD1 (n = 5) versus vehicle-treated mSOD1 mice (n = 5) (p = 0.032) (Fig. 8).
Fig. 8.
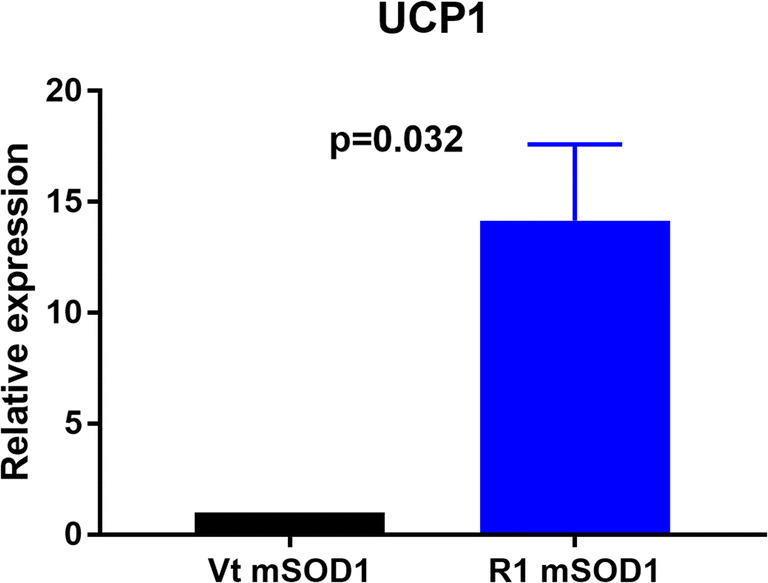
Gene expression of UCP in the quadriceps muscle. mRNA was isolated from quadriceps muscle of mSOD1 mice treated with PBS (Vt mSOD1) or R1Mab1 (R1 mSOD1) and subjected to qPCR analysis. Data represent means ± sem (n = 5): Relative expression values were evaluated with the 2−ΔΔCt method using actin as housekeeping gene
Moreover, we observed a trend to an upregulation of PPARγ in mSOD1 treated with R1Mab1 (n = 5) versus vehicle-treated mSOD1 mice (n = 5) (p = 0.052) (Fig. 9).
Fig. 9.
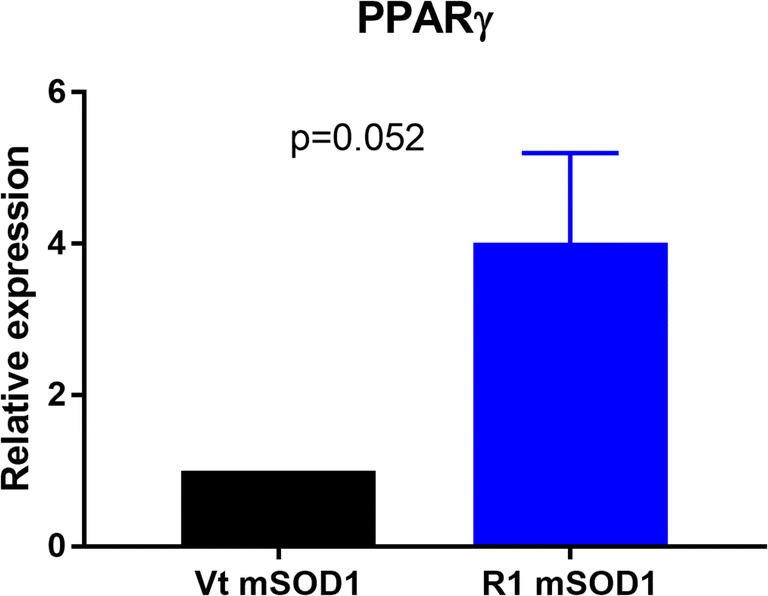
Gene expression of PPARγ in the quadriceps muscle. mRNA was isolated from quadriceps muscle of mSOD1 mice treated with PBS (Vt mSOD1) or R1Mab1 (R1 mSOD1) and subjected to qPCR analysis. Data represent means ± sem (n = 5). Relative expression values were evaluated with the 2−ΔΔCt method using actin as housekeeping gene
No difference was found for PPARα mRNA between both groups.
Discussion
The major findings of this study are 1) the mild beneficial effect of the R1Mab1 on motor performance, despite the weight loss of mSOD1 mice treated with R1Mab1; 2) the potential anti-inflammatory effect of this therapy; and 3) the characterization of some metabolic changes due to FGF21 agonist treatment specifically in ALS.
Deleterious Effect of R1Mab1 on Body Weight but Mild Beneficial Effect of R1Mab1 on Motor Performance
The choice of starting the treatment at 12 weeks is based on the age of disease onset [15], and the initial dose was based on the protocol described in previous studies [16, 17]. As for many therapeutic antibodies, we used a loading dose then a maintenance dose to respect the pharmacokinetics parameters. The delay of 4 weeks to repeat the administration was determined from the experimental results published in the study of Wu et al., 2013 [17]. The onset of weight loss occurred immediately in all treated mice after the administration of R1Mab1 and was higher in mSOD1 mice. Previous studies targeting obesity and insulin resistance reported a similar effect of FGF21 therapy on body weight [18], and this weight loss was expected. However, we decided to lower the maintenance dose to avoid the fast deterioration of the clinical status, which could be harmful in this mouse model already characterized by weight loss. One of the major findings of this study is the slight deceleration in the decline of motor performance despite significant weight loss, which is usually reported as a marker of poor prognosis [19]. This discrepancy could be explained in part by the consumption of fat mass with a preservation of muscle mass.
FGF21 is expressed in brown adipose tissue and has a significant positive correlation with uncoupling protein 1 (UCP-1) expression [20]. As a result, this elicits thermogenic activation and stimulates browning of white adipose tissue by inducing the expression of UCP-1 leading to an increase of energy expenditure [21]. This upregulation of UCP-1 should be protective against oxidative stress but could also induce deleterious muscle and metabolic effects [22, 23], as illustrated by a deleterious effect on body weight in our work.
Multiple mechanisms have been implicated in the degeneration of skeletal muscle in ALS [24], including lipid homeostasis such as peroxisome proliferator activated receptor (PPAR) signaling [25]. The mild beneficial effect on motor performance may be the enhancement of mitochondrial oxidative capacity and PPARγ activity by the FGF21 [26], combined with the fact that FGF21 also has been proven as a myokine expressed and released by skeletal muscle cells to promote the formation of myofibers [27]. Taken together, these previous studies lead us to hypothesize that the deleterious effects of weight loss are offset by better energy production and preservation of muscle mass.
Beneficial Effect of R1Mab1 on Inflammatory State
R1Mab1 seems to have a significant effect on inflammation, which was noticeable via a reduction in TNF-α and MCP-1. TNF-α is a major proinflammatory cytokine. With regard to ALS, increased TNF-α levels have been found in CSF and blood from ALS patients [28], but these results were controversial [29].
MCP-1, which is also known as chemokine ligand 2 (CCL2), is considered to be a proinflammatory chemokine and believed to exert a detrimental effect by activating the C–C chemokine receptor type 2 (CCR2) in the inflammatory process. The agonist therapy of the FGF21 pathway is widely studied to treat non-alcoholic steatohepatitis (NASH) and dysmetabolic syndrome through enhancing Nrf2-mediated antioxidant capacity and suppressing the NF-κB signaling pathway [30].
Our results suggest that activation of the FGF21 pathway in this ALS mouse model is associated to an effective anti-inflammatory effect related to the decrease in inflammatory cytokines, such as TNF-α and MCP-1 in mice.
Effect on Metabolism
The use of mass spectrometry in this study extended the breadth of analyzed metabolites and strengthened the results by using longitudinal sampling. Here, we show that the FGF21 pathway does appear to play a different role in the perturbations of the metabolome that occur in mSOD1 or in wild-type mice.
R1Mab1-treated mice shared common highlighted pathways including the synthesis and degradation of ketone bodies (acetoacetate) and a decrease of the insulin concentration, consistent with the metabolic functions of the FGF 21 [31]. However, mSOD1 mice seem to be more sensitive to R1Mab1 with many highlighted pathways including sphingolipid metabolism, butanoate metabolism, pantothenate and CoA biosynthesis, and the metabolism of amino acids like tyrosine, arginine, proline, glycine, serine, alanine, aspartate, and glutamate.
In ALS, an impairment of energy metabolism is unanimously recognized [2], including defective energy production [32] and hypermetabolism that is a deleterious prognostic factor [33]. In our work, the use of R1Mab1, who activates the FGF21 pathway involving whole-body energy balance [34], highlighted a strong effect on ketone bodies (KBs), in accordance with a previous study using R1Mab1 [16]. Previous studies working on SOD-G93A showed improvements obtained by KB-based treatments [35, 36].
In this work, the effect on amino acid metabolism was especially noticeable on serine and glycine. Both are biosynthetically linked and are crucial to one-carbon replenishment metabolism and play an important role in the cellular redox balance in close connection with the folate and methionine cycles. These roles are important, and evidences exist between oxidative stress, mitochondrial damage, and ALS [37]. In anabolic pathways, the serine biosynthetic pathway represents a turning point in glucose conversion [38]. In mitochondria, glycine can support heme biosynthesis and sustains oxidative phosphorylation [39]. Unfortunately, branched-chain amino acids which have been widely described in ALS [40–42] could not be analyzed in this study, because of a CV in QCs > 30% and were excluded from the final dataset.
Despite a large number of available metabolites, we observed a lack of some compounds of interest including free fatty acids or cholesterol, to analyze lipid metabolism reported as deeply involved in ALS pathophysiology [43]. As the FGF21 pathway was described to act on lipid metabolism with an increase of lipolysis in adipose tissue [20] and fatty acid utilization in skeletal muscle [44], we suggest that lipid metabolism merits exploration by a specific lipidomics approach. To complete this work, a focus on mitochondrial activity and quantification of reactive oxygen species also should be planned [45], as both the FGF21 signaling may enhance mitochondrial oxidative capacity by the activation of AMPK-Sirt1-PGC-1α axis [46] and the alteration of PGC-1α in ALS [47] could to contribute to neuronal protection [48].
Despite weight loss, the moderate improvement in rotarod could be partly explained by the enhancement of the inflammatory and energy homeostatic state related to the FGF21 pathway, and taken together, these metabolomics strategies allow to suggest putative pathways that may explain a protective effect of this therapeutic for ALS [49].
Conclusion
To our knowledge, this study is the first in evaluating by omics approaches a therapeutic molecule targeting two different factors of pathophysiological pathways in ALS. This was characterized by a slight deceleration in disease progression with an improvement of motor performance, despite significant weight loss in treated male mice. This pharmacometabolomic approach showed that R1Mab1 treatment was associated to a significant anti-inflammatory and metabolic effect such as a modification of amino acid and energetic metabolism. The specific effect of metabolism modification on clinical evolution must be explored to plan nutritional management downstream of R1Mab1 therapy. This strategy could be promising by 1) increasing the benefit in metabolism modification and maintaining the observed protective effect on inflammation or 2) compensating for the deleterious effect of metabolism modification while sustaining the observed protective effect on inflammation.
Electronic Supplementary Material
(DOCX 13 kb)
(PDF 1224 kb)
Acknowledgments
The authors would especially like to thank Adrianna Delwail for her technical support and the Fondation Brou de Laurières for their support of this project. The authors also thank Genentech for providing graciously R1Mab1 antibody.
Footnotes
Publisher’s Note
Springer Nature remains neutral with regard to jurisdictional claims in published maps and institutional affiliations.
References
- 1.Chiò A, Logroscino G, Hardiman O, Swingler R, Mitchell D, Beghi E, et al. Prognostic factors in ALS: a critical review. Amyotroph Lateral Scler. 2009;10:310–323. doi: 10.3109/17482960802566824. [DOI] [PMC free article] [PubMed] [Google Scholar]
- 2.Dupuis L, Pradat P-F, Ludolph AC, Loeffler J-P. Energy metabolism in amyotrophic lateral sclerosis. Lancet Neurol. 2011;10:75–82. doi: 10.1016/S1474-4422(10)70224-6. [DOI] [PubMed] [Google Scholar]
- 3.Bensimon G, Lacomblez L, Meininger V. A controlled trial of riluzole in amyotrophic lateral sclerosis. ALS/Riluzole Study Group. N Engl J Med. 1994;330:585–591. doi: 10.1056/NEJM199403033300901. [DOI] [PubMed] [Google Scholar]
- 4.Lacomblez L, Bensimon G, Leigh PN, et al. Long-term safety of riluzole in amyotrophic lateral sclerosis. Amyotroph Lateral Scler Other Motor Neuron Disord. 2002;3:23–9. doi: 10.1080/146608202317576507. [DOI] [PubMed] [Google Scholar]
- 5.Writing Group, Edaravone (MCI-186) ALS 19 Study Group Safety and efficacy of edaravone in well defined patients with amyotrophic lateral sclerosis: a randomised, double-blind, placebo-controlled trial. Lancet Neurol. 2017;16:505–512. doi: 10.1016/S1474-4422(17)30115-1. [DOI] [PubMed] [Google Scholar]
- 6.Kano O, Beers DR, Henkel JS, Appel SH. Peripheral nerve inflammation in ALS mice: cause or consequence. Neurology. 2012;78:833–835. doi: 10.1212/WNL.0b013e318249f776. [DOI] [PMC free article] [PubMed] [Google Scholar]
- 7.Murdock BJ, Bender DE, Segal BM, Feldman EL. The dual roles of immunity in ALS: injury overrides protection. Neurobiol Dis. 2015;77:1–12. doi: 10.1016/j.nbd.2015.02.017. [DOI] [PubMed] [Google Scholar]
- 8.Diémé B, Mavel S, Blasco H, et al. Metabolomics study of urine in autism spectrum disorders using a multiplatform analytical methodology. J Proteome Res. 2015;14:5273–5282. doi: 10.1021/acs.jproteome.5b00699. [DOI] [PubMed] [Google Scholar]
- 9.Madji Hounoum B, Blasco H, Nadal-Desbarats L, et al. Analytical methodology for metabolomics study of adherent mammalian cells using NMR, GC-MS and LC-HRMS. Anal Bioanal Chem. 2015;407:8861–8872. doi: 10.1007/s00216-015-9047-x. [DOI] [PubMed] [Google Scholar]
- 10.Chen G, Li H, Zhao Y, et al. Saponins from stems and leaves of Panax ginseng prevent obesity via regulating thermogenesis, lipogenesis and lipolysis in high-fat diet-induced obese C57BL/6 mice. Food Chem Toxicol. 2017;106:393–403. doi: 10.1016/j.fct.2017.06.012. [DOI] [PubMed] [Google Scholar]
- 11.Eriksson L, Trygg J, Wold S. CV-ANOVA for significance testing of PLS and OPLS® models. J Chemometr. 2008;22:594–600. doi: 10.1002/cem.1187. [DOI] [Google Scholar]
- 12.Kanehisa M, Araki M, Goto S, Hattori M, Hirakawa M, Itoh M, et al. KEGG for linking genomes to life and the environment. Nucleic Acids Res. 2008;36:D480–D484. doi: 10.1093/nar/gkm882. [DOI] [PMC free article] [PubMed] [Google Scholar]
- 13.Assenov Y, Ramírez F, Schelhorn S-E, Lengauer T, Albrecht M. Computing topological parameters of biological networks. Bioinformatics. 2008;24:282–284. doi: 10.1093/bioinformatics/btm554. [DOI] [PubMed] [Google Scholar]
- 14.Xia J, Wishart DS. Using MetaboAnalyst 3.0 for comprehensive metabolomics data analysis. Curr Protoc Bioinformatics. 2016;55:14.10.1–14.10.91. doi: 10.1002/cpbi.11. [DOI] [PubMed] [Google Scholar]
- 15.Dal Canto MC, Gurney ME. Development of central nervous system pathology in a murine transgenic model of human amyotrophic lateral sclerosis. Am J Pathol. 1994;145:1271–1279. [PMC free article] [PubMed] [Google Scholar]
- 16.Wu A-L, Kolumam G, Stawicki S, et al. Amelioration of type 2 diabetes by antibody-mediated activation of fibroblast growth factor receptor 1. Sci Transl Med. 2011;3:113ra126. doi: 10.1126/scitranslmed.3002669. [DOI] [PubMed] [Google Scholar]
- 17.Wu A-L, Feng B, Chen MZ, et al. Antibody-mediated activation of FGFR1 induces FGF23 production and hypophosphatemia. PLoS One 2013;8. 10.1371/journal.pone.0057322. [DOI] [PMC free article] [PubMed]
- 18.Coskun T, Bina HA, Schneider MA, et al. Fibroblast growth factor 21 corrects obesity in mice. Endocrinology. 2008;149:6018–6027. doi: 10.1210/en.2008-0816. [DOI] [PubMed] [Google Scholar]
- 19.Shimizu T, Nagaoka U, Nakayama Y, et al. Reduction rate of body mass index predicts prognosis for survival in amyotrophic lateral sclerosis: a multicenter study in Japan. Amyotroph Lateral Scler. 2012;13:363–366. doi: 10.3109/17482968.2012.678366. [DOI] [PubMed] [Google Scholar]
- 20.Hondares E, Rosell M, Gonzalez FJ, Giralt M, Iglesias R, Villarroya F. Hepatic FGF21 expression is induced at birth via PPARalpha in response to milk intake and contributes to thermogenic activation of neonatal brown fat. Cell Metab. 2010;11:206–212. doi: 10.1016/j.cmet.2010.02.001. [DOI] [PMC free article] [PubMed] [Google Scholar]
- 21.Cuevas-Ramos D, Aguilar-Salinas CA. Modulation of energy balance by fibroblast growth factor 21. Horm Mol Biol Clin Invest 2017;30. 10.1515/hmbci-2016-0023. [DOI] [PubMed]
- 22.Peixoto PM, Kim H-J, Sider B, Starkov A, Horvath TL, Manfredi G. UCP2 overexpression worsens mitochondrial dysfunction and accelerates disease progression in a mouse model of amyotrophic lateral sclerosis. Mol Cell Neurosci. 2013;57:104. doi: 10.1016/j.mcn.2013.10.002. [DOI] [PMC free article] [PubMed] [Google Scholar]
- 23.Dupuis L, di Scala F, Rene F, et al. Up-regulation of mitochondrial uncoupling protein 3 reveals an early muscular metabolic defect in amyotrophic lateral sclerosis. FASEB J. 2003;17:2091–2093. doi: 10.1096/fj.02-1182fje. [DOI] [PubMed] [Google Scholar]
- 24.Loeffler J-P, Picchiarelli G, Dupuis L, Gonzalez de Aguilar J-L. The role of skeletal muscle in amyotrophic lateral sclerosis. Brain Pathol 2016. 10.1111/bpa.12350. [DOI] [PMC free article] [PubMed]
- 25.Dervishi I, Gozutok O, Murnan K, et al. Protein-protein interactions reveal key canonical pathways, upstream regulators, interactome domains, and novel targets in ALS. Sci Rep 2018;8. 10.1038/s41598-018-32902-4. [DOI] [PMC free article] [PubMed]
- 26.Dutchak PA, Katafuchi T, Bookout AL, et al. Fibroblast growth factor-21 regulates PPARγ activity and the antidiabetic actions of thiazolidinediones. Cell. 2012;148:556–67. doi: 10.1016/j.cell.2011.11.062. [DOI] [PMC free article] [PubMed] [Google Scholar]
- 27.Liu X, Wang Y, Hou L, Xiong Y, Zhao S. Fibroblast growth factor 21 (FGF21) promotes formation of aerobic myofibers via the FGF21-SIRT1-AMPK-PGC1α pathway. J Cell Physiol 2016. 10.1002/jcp.25735. [DOI] [PubMed]
- 28.Hu Y, Cao C, Qin X-Y, et al. Increased peripheral blood inflammatory cytokine levels in amyotrophic lateral sclerosis: a meta-analysis study. Sci Rep 2017;7. 10.1038/s41598-017-09097-1. [DOI] [PMC free article] [PubMed]
- 29.Vlam L, Piepers S, Sutedja NA, et al. Association of IgM monoclonal gammopathy with progressive muscular atrophy and multifocal motor neuropathy: a case-control study. J Neurol 2015. 10.1007/s00415-014-7612-4. [DOI] [PubMed]
- 30.Yu Y, He J, Li S, et al. Fibroblast growth factor 21 (FGF21) inhibits macrophage-mediated inflammation by activating Nrf2 and suppressing the NF-κB signaling pathway. Int Immunopharmacol. 2016;38:144–52. doi: 10.1016/j.intimp.2016.05.026. [DOI] [PubMed] [Google Scholar]
- 31.Grabacka M, Pierzchalska M, Dean M, Reiss K. Regulation of ketone body metabolism and the role of PPARα. Int J Mol Sci 2016;17. 10.3390/ijms17122093. [DOI] [PMC free article] [PubMed]
- 32.Dupuis L, Oudart H, René F, de Aguilar J-LG, Loeffler J-P. Evidence for defective energy homeostasis in amyotrophic lateral sclerosis: Benefit of a high-energy diet in a transgenic mouse model. Proc Natl Acad Sci U S A. 2004;101:11159–64. doi: 10.1073/pnas.0402026101. [DOI] [PMC free article] [PubMed] [Google Scholar]
- 33.Jésus P, Fayemendy P, Nicol M, et al. Hypermetabolism is a deleterious prognostic factor in patients with amyotrophic lateral sclerosis. Eur J Neurol. 2018;25:97–104. doi: 10.1111/ene.13468. [DOI] [PubMed] [Google Scholar]
- 34.Holland WL, Adams AC, Brozinick JT, et al. An FGF21-adiponectin-ceramide axis controls energy expenditure and insulin action in mice. Cell Metab. 2013;17:790–797. doi: 10.1016/j.cmet.2013.03.019. [DOI] [PMC free article] [PubMed] [Google Scholar]
- 35.Zhao Z, Lange DJ, Voustianiouk A, et al. A ketogenic diet as a potential novel therapeutic intervention in amyotrophic lateral sclerosis. BMC Neurosci 2006;7. [DOI] [PMC free article] [PubMed]
- 36.Tefera TW, Wong Y, Barkl-Luke ME, et al. Triheptanoin protects motor neurons and delays the onset of motor symptoms in a mouse model of amyotrophic lateral sclerosis. PLoS One 2016;11. 10.1371/journal.pone.0161816. [DOI] [PMC free article] [PubMed]
- 37.Greco V, Longone P, Spalloni A, Pieroni L, Urbani A. Crosstalk between oxidative stress and mitochondrial damage: focus on amyotrophic lateral sclerosis. Adv Exp Med Biol. 2019;1158:71–82. doi: 10.1007/978-981-13-8367-0_5. [DOI] [PubMed] [Google Scholar]
- 38.Kalhan SC, Hanson RW. Resurgence of serine: an often neglected but indispensable amino acid. J Biol Chem. 2012;287:19786–19791. doi: 10.1074/jbc.R112.357194. [DOI] [PMC free article] [PubMed] [Google Scholar]
- 39.di Salvo ML, Contestabile R, Paiardini A, Maras B. Glycine consumption and mitochondrial serine hydroxymethyltransferase in cancer cells: the heme connection. Med Hypotheses. 2013;80:633–636. doi: 10.1016/j.mehy.2013.02.008. [DOI] [PubMed] [Google Scholar]
- 40.Lynch CJ, Adams SH. Branched-chain amino acids in metabolic signalling and insulin resistance. Nat Rev Endocrinol. 2014;10:723–736. doi: 10.1038/nrendo.2014.171. [DOI] [PMC free article] [PubMed] [Google Scholar]
- 41.Batch BC, Hyland K, Svetkey LP. Branch chain amino acids: biomarkers of health and disease. Curr Opin Clin Nutr Metab Care. 2014;17:86–89. doi: 10.1097/MCO.0000000000000010. [DOI] [PubMed] [Google Scholar]
- 42.Blasco H, Patin F, Madji Hounoum B, et al. Metabolomics in amyotrophic lateral sclerosis: how far can it take us? Eur J Neurol 2016. 10.1111/ene.12956. [DOI] [PubMed]
- 43.Dupuis L, Corcia P, Fergani A, et al. Dyslipidemia is a protective factor in amyotrophic lateral sclerosis. Neurology. 2008;70:1004–1009. doi: 10.1212/01.wnl.0000285080.70324.27. [DOI] [PubMed] [Google Scholar]
- 44.Ji K, Zheng J, Lv J, Xu J, Ji X, Luo Y-B, et al. Skeletal muscle increases FGF21 expression in mitochondrial disorders to compensate for energy metabolic insufficiency by activating the mTOR–YY1–PGC1α pathway. Free Radic Biol Med. 2015;84:161–170. doi: 10.1016/j.freeradbiomed.2015.03.020. [DOI] [PubMed] [Google Scholar]
- 45.Magrané J, Cortez C, Gan W-B, Manfredi G. Abnormal mitochondrial transport and morphology are common pathological denominators in SOD1 and TDP43 ALS mouse models. Hum Mol Genet. 2014;23:1413–1424. doi: 10.1093/hmg/ddt528. [DOI] [PMC free article] [PubMed] [Google Scholar]
- 46.Chau MDL, Gao J, Yang Q, Wu Z, Gromada J. Fibroblast growth factor 21 regulates energy metabolism by activating the AMPK-SIRT1-PGC-1alpha pathway. Proc Natl Acad Sci U S A. 2010;107:12553–12558. doi: 10.1073/pnas.1006962107. [DOI] [PMC free article] [PubMed] [Google Scholar]
- 47.Bayer H, Lang K, Buck E, et al. ALS-causing mutations differentially affect PGC-1α expression and function in the brain vs. peripheral tissues. Neurobiol Dis. 2017;97:36–45. doi: 10.1016/j.nbd.2016.11.001. [DOI] [PubMed] [Google Scholar]
- 48.Liang H, Ward WF, Jang YC, et al. PGC-1alpha protects neurons and alters disease progression in an amyotrophic lateral sclerosis mouse model. Muscle Nerve. 2011;44:947–956. doi: 10.1002/mus.22217. [DOI] [PubMed] [Google Scholar]
- 49.Chen S, Chen S-T, Sun Y, et al. Fibroblast growth factor 21 ameliorates neurodegeneration in rat and cellular models of Alzheimer’s disease. Redox Biol 2019;22. 10.1016/j.redox.2019.101133. [DOI] [PMC free article] [PubMed]
Associated Data
This section collects any data citations, data availability statements, or supplementary materials included in this article.
Supplementary Materials
(DOCX 13 kb)
(PDF 1224 kb)


