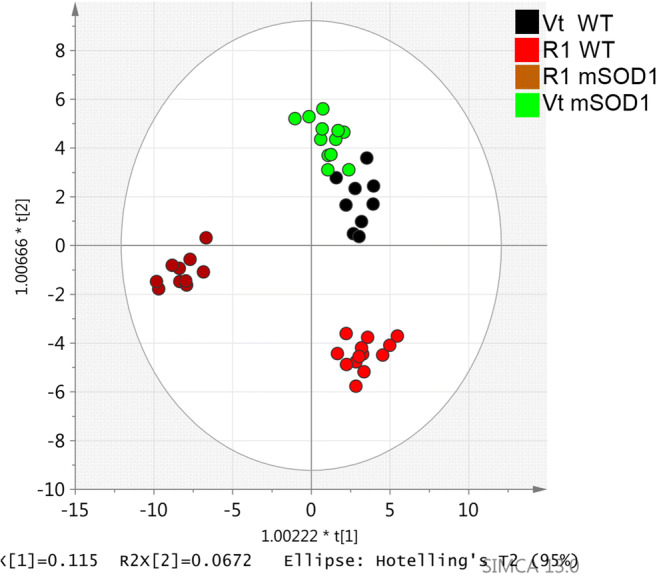
Fig. 5.

Orthogonal partial least squares discriminant analysis (OPLS-DA) scatter plot for serum metabolome, at 16 weeks, obtained from mutant superoxide dismutase 1 (mSOD1) mice (n = 22), treated with R1Mab1 (n = 10), in brown, or vehicle treated (n = 12), in light green; wild-type (WT) mice (n = 22), treated with R1Mab1 (n = 13), in red, or vehicle treated (n = 9), in black. This plot is representative of the metabolic effect of the R1Mab1 between WT and mSOD1 mice
