

Abstract
How are different object categories organized by the visual system? Current evidence indicates that monkeys and humans process object categories in fundamentally different ways. Functional magnetic resonance imaging (fMRI) studies suggest that humans have a ventral temporal face area, but such evidence is lacking in macaques. Instead, face-responsive neurons in macaques seem to be scattered throughout temporal cortex, with some relative concentration in the superior temporal sulcus (STS). Here, using fMRI in alert fixating macaque monkeys and humans, we found that macaques do have discrete face-selective patches, similar in relative size and number to face patches in humans. The face patches were embedded within a large swath of object-selective cortex extending from V4 to rostral TE. This large region responded better to pictures of intact objects compared to scrambled objects, with different object categories eliciting different patterns of activity, as in the human. Overall, our results suggest that humans and macaques share a similar brain architecture for visual object processing.
The ability to identify and categorize objects is crucial to an animal’s survival. In primates, object recognition is thought to be accomplished primarily in the ventral visual pathway, a chain of interconnected areas including areas TEO and TE of the inferior temporal lobe1,2. A central question regarding the mechanism of object recognition is whether the representation of different objects is distributed throughout the entire ventral stream or localized to distinct areas.
Much of the original data addressing this issue was based on lesions and single-unit recordings from macaque monkeys3–7,but new data has been obtained from fMRI experiments in humans8–10. Unfortunately, it is difficult to directly compare the data from these two realms because differences between species (humans versus macaques) are confounded with differences between techniques (fMRI versus single-unit recording).
Functional imaging results in humans indicate that object recognition is mediated by both distributed and localized representations. For example, objects such as scissors and chairs can be distinguished based on the distributed and overlapping brain activity they elicit, even though there is no ‘scissor area’ or ‘chair area’ in cortex9,10.There are, however, specialized regions of human cortex dedicated to processing categories of high biological relevance such as faces8, places11 and bodies12.
Single-unit and optical imaging experiments in the monkey provide evidence predominantly for distributed mechanisms7,13–15. Although face-selective cells have been reported throughout the macaque temporal lobe3–6,14,with some relative concentration in the STS6,there has never been a description of a face-selective area analogous to the human fusiform face area (FFA). However, single-unit and optical imaging techniques are not optimal for revealing large-scale/global functional architectures, especially within sulci. The advent of fMRI in macaque monkeys provides a solution to this technical problem16–20.
To image the global organization of visual object processing in macaques and compare it to that in humans, we used fMRI in awake behaving macaques and humans viewing the same stimuli. We found face-selective cortical patches within area TE of the macaque. These patches were embedded within a large region of object-selective cortex extending from V4 to rostral TE. Although faces and bodies were the only categories that activated specialized patches, other object categories elicited different distributed activity patterns across the temporal lobe, as in the human9,10.In addition, faces and bodies elicited unique distributed response patterns outside the specialized patches.
Results
Our first goal was to locate cortical regions important for object recognition in the macaque and compare these to analogous regions in the human. We obtained functional images of the brain at 1.25 mm isotropic resolution from three monkeys while they fixated grayscale images of objects and grid-scrambled counterparts in separate blocks. Within each block, the objects consisted of hands, bodies, fruits and technological objects (see Supplementary Fig. 1 online for examples of the stimuli). These provided four different categories of stimuli for the monkeys (three familiar biological forms, plus man-made objects such as clocks and cameras).
Consistent with data from other techniques1,2, the largest swath of activation to intact compared to scrambled objects occurred in the ventral stream of visual cortex, encompassing areas TEO and TE, as well as foveal, ventral V4. Figure 1a shows activation from the right hemisphere of one monkey, displayed on inflated and flattened views of the cortex. BOLD-based activation patterns were similar in three other hemispheres, as were activation patterns obtained with MION contrast agent18,20 (Supplementary Fig. 2 online). Areal boundaries were determined by registering a surface-based atlas21 onto the individual hemisphere. Importantly, the response in early visual areas such as V1 was even stronger to scrambled than to intact objects (Fig. 1b). This implies that the observed object-based activation was not due to an increase in the effectiveness of low-level features during object epochs.
Figure 1.
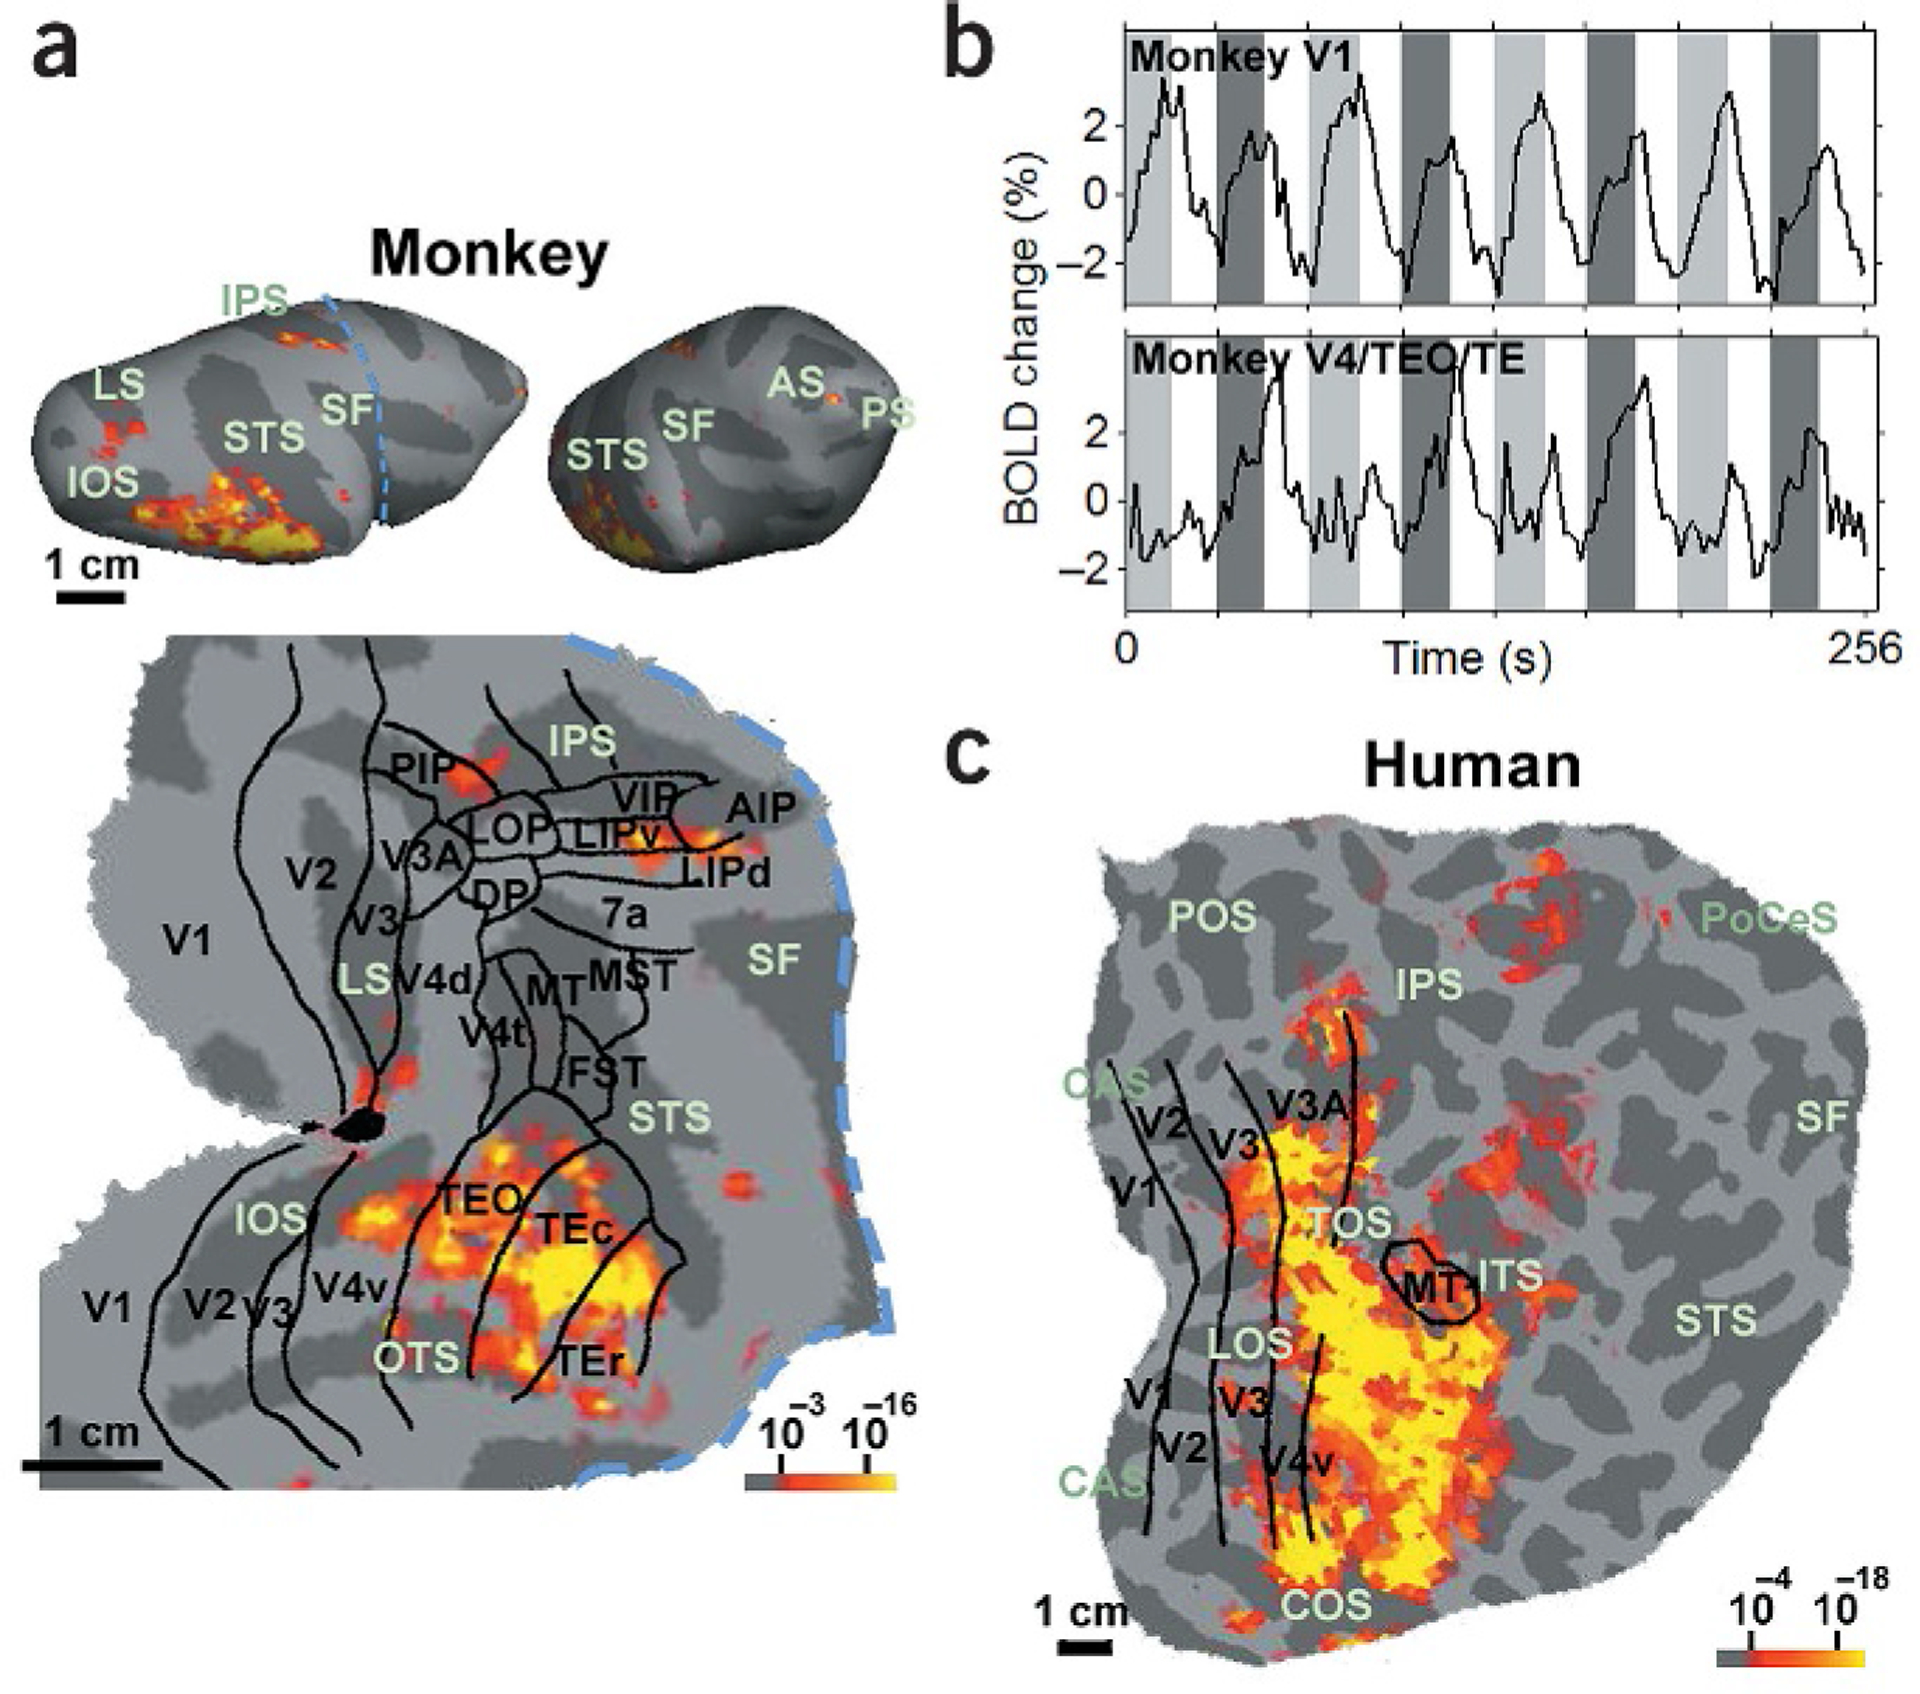
Object-selective areas in the macaque and human. (a) Areas in the macaque brain significantly (P < 10–3) more activated by intact objects than by grid-scrambled counterparts. The activation is rendered on two different lateral views of the inflated right hemisphere (top), as well as on a flat map of the right visual cortex (bottom). The blue dashed line indicates the cut used to construct the flat map. The borders of macaque visual areas, including the Ungerleider and Desimone partitioning scheme38 for temporal regions (ventral V4, TEO, TEr and Tec) and the Lewis and Van Essen scheme22 for all other regions, were derived by warping a macaque atlas21 to the individual hemisphere with surface-based registration, using major sulci and gyri as landmarks27. Significant activation occurred in ventral stream areas V4, TEO and TE, as well as in two additional foci—the lateral bank of the intraparietal sulcus and inferior prefrontal cortex. (b) Time courses from macaque V1 (top) and V4/TEO/TE (bottom) to alternating epochs of intact (dark gray) and scrambled (light gray) objects, separated by epochs of a blank screen (white). (c) Activity in the right hemisphere of a human subject to the same stimulus comparison. The borders of human visual areas were determined by retinotopic and functional mapping39. Sulcal abbreviations: LS, lunate; IOS, inferior occipital; OTS, occipito-temporal; IPS, intraparietal; STS, superior temporal; SF, Sylvian fissure; AS, arcuate; ITS, inferior temporal; POS, parieto-occipital; CAS, calcarine; COS, collateral; TOS, transoccipital; LOS, lateral occipital; PoCeS, postcentral.
Smaller but significant foci of activation appeared in areas LIP and AIP (lateral and anterior intraparietal areas, respectively), as well as in prefrontal cortex between the principle sulcus and the inferior arcuate sulcus, near the boundary between areas 45 and 8A22 (Fig. 1a,inflated views). Parietal cortex is considered to be important for planning actions and encoding eye and hand move-ments23,whereas prefrontal cortex is thought to be involved in the maintenance of short-term memories24. Our results indicate that these same areas of the macaque cortex can also be activated by the mere percept of objects, without the performance of any explicit saccade, grasping or memory task.
Only time points in which the monkey maintained fixation within a 2° window for the entire repetition time (TR = 2 s) were used to generate Fig. 1a.To further ensure that the activations in Fig. 1a were not due to increased eye movements during object epochs, we compared the variance in eye position during scrambled versus intact object epochs. We found that the variance was actually slightly smaller during the latter (F-test, horizontal eye position: standard deviation (s.d.)scrambled = 0.15°, s.d.intact = 0.12°, F960,960 = 1.57, P < 1.0 × 10⁻¹³; vertical eye position: s.d.scrambled = 0.16°, s.d.intact = 0.13°, F960,960 = 1.51, P < 1.3 × 10⁻¹²). Each epoch was 16 s long, and the eye position was sampled at 60 Hz (60 times/s), thus there were a total of 960 samples during each of the scrambled and the intact epochs.
The same stimulus comparison in a human subject (Fig. 1c) showed activation of the lateral occipital complex (LOC), a large region of non-retinotopic human ventral cortex that is significantly more responsive to intact than to scrambled objects25.It thus appears that human LOC includes homologs of macaque areas TEO and TE (compare Fig. 1a and c). Unlike in the macaque, human object-related activation extended prominently into area V3A. As in the macaque, there were several foci of object-selective activity in parietal cortex.
Within the macaque cortical territory that is object-selective (Fig. 1a), do different object categories activate unique, segregated regions of cortex (localized representation), or do they elicit different activity patterns within a common cortical region (distributed representation)? We initially tested this with the object class of faces, since faces are a behaviorally important natural category for monkeys26, and the strongest evidence for localized object representations comes from the response specificity of the human fusiform face area (FFA)8.
When tested with pictures of faces versus pictures of non-face objects (same objects as those used in Fig. 1), a human subject showed two face-specific patches in the left hemisphere (in the left posterior inferior temporal gyrus and in the fusiform gyrus) and two face-specific patches in the right hemisphere (in the anterior superior temporal sulcus and in the fusiform gyrus; Fig. 2a).
Figure 2.
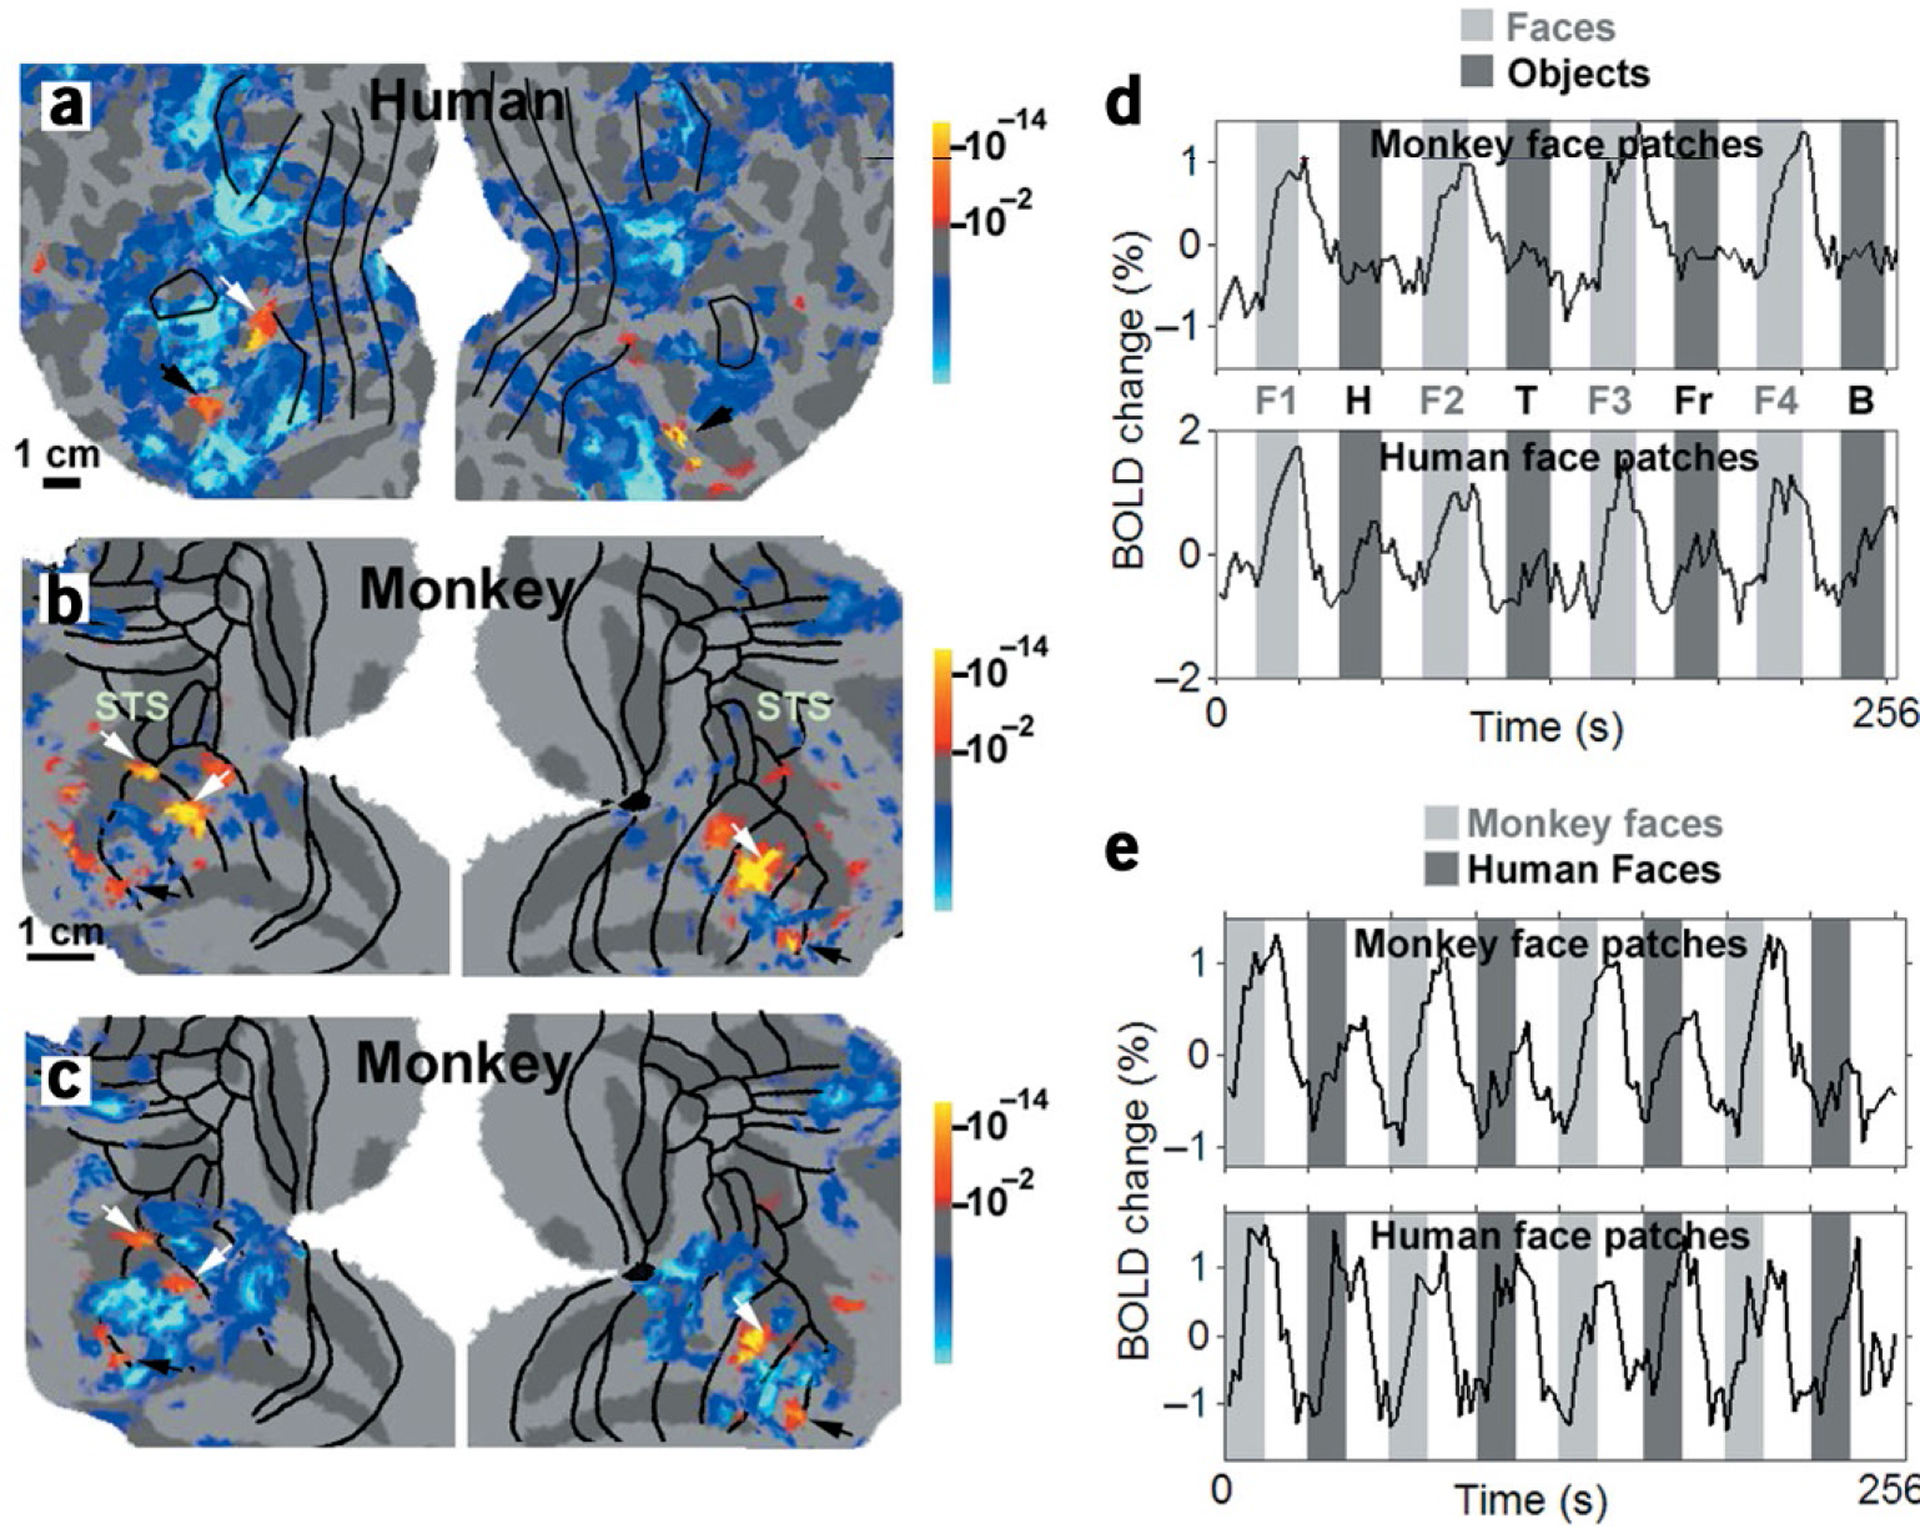
Face-selective patches in the human and macaque. (a) Patches in human visual cortex significantly (P < 10–2) more activated by faces than by non-face objects. Activation maps are rendered on flattened views of the left and right hemispheres (on left and right of panel, respectively). This subject showed FFA activity in each hemisphere (black arrows), as well as two additional face-selective patches: in the left posterior inferior temporal gyrus (white arrow) and in the right anterior superior temporal sulcus (region not covered by the right hemisphere flat map). (b) Face-selective patches in a macaque, derived using the same stimuli and analysis as for the human (see panel a in Supplementary Fig. 4 for same data in slice format). The three most significant face patches (two in the left hemisphere, one in the right hemisphere) were located in the fundus and lower bank of the STS (white arrows). Two additional face-selective patches were located bilaterally in rostral TE (black arrows). In addition, there was a bilateral patch in the STS in area TEO that was not as reliably imaged across different days and was not found for line drawings. (c) Face-selective patches in the macaque, derived using line drawings of faces and objects instead of grayscale photographs. Fiducial arrows mark the face patches in both b and c. (d) Time courses from the monkey and human face patches to face (light grey) versus non-face (dark grey) object stimuli; during white-coded epochs, the stimuli were Fourier-phase scrambled counterparts of images in the subsequent colored epoch. A different set of faces (F1–F4) and objects were presented during each of the purple- and blue-coded epochs. H, hands; T, technological objects; Fr, fruits; B, bodies. (e) Time courses from the monkey and human face patches (defined based on selectivity to human faces) to macaque (light grey) versus human (dark grey) face stimuli.
To test whether macaques have analogous face-selective region(s), we presented the identical stimuli to three monkeys. In one monkey, we found three face-specific patches located in the fundus and lower bank of the STS in caudal TE (Fig. 2b). In addition, we found two smaller face-specific patches located bilaterally in the upper bank of the anterior middle temporal sulcus (AMTS), in rostral TE. These five face patches were statistically robust and reliably imaged across ten experimental sessions spanning almost nine months (Supplementary Fig. 3 online). Indeed, these five face-selective patches were activated even when line drawings of faces and objects were presented instead of grayscale images (Fig. 2c). This strongly suggests that the macaque face patches are detecting a high-level gestalt of facial form, independent of low-level features. The overall topography of face-selective patches was consistent across all three monkeys (Supplementary Fig. 4 online).
Time courses from the face patches in the macaque and human showed clear face-selective responses (Fig. 2d). Again, exactly the same stimuli were used in the two species. The stimulus sequence alternated between faces and objects, interdigitated with Fourier-phase scrambled counterparts of each. The relative response to non-face objects was even smaller in the macaque than in the human, suggesting greater face selectivity.
In Figs. 2a–d, the face stimuli consisted of pictures of human faces. We also tested pictures of macaque faces (for example stimuli, see Supplementary Fig. 1 online), using the same object stimuli for comparison. In the human, patches selective for macaque faces were identical to those for human faces. In the macaque, however, patches selective for macaque faces were larger than those for human faces, and spread posteriorly into area TEO (Supplementary Fig. 3k online). Whereas the human face patches responded similarly to the presentation of both human and macaque faces, the macaque face patches responded more than twice as strongly to macaque faces compared to human faces (Fig. 2e).
Modular functional organization is usually described in terms of stereotypically spaced columns or larger, functionally distinct areas. However, the face-selective patches shown in Fig. 2b and c and Supplementary Fig. 4 online seem to represent a level of functional organization intermediate between these two extremes. Although the macaque face patches were larger and less numerous than classical columns (e.g.,ocular dominance columns), they were smaller and more numerous than typical visual areas. This may be the reason why their existence has so far eluded single-unit physiologists.
Face selectivity in humans is most consistently found in the FFA8.As we found the strongest face selectivity in the macaque in the lower bank of the STS in caudal TE, it is tempting to suggest a homology between this region and the human FFA. When the macaque face patches are computationally deformed onto a human flat map (using CARET27), they lie quite close to the human FFA (Supplementary Fig. 5 online). However, additional face patches also exist in ventral cortex of both species1,28 (Fig. 2a–c), thus further functional analysis will be necessary to fully elucidate the homologies. Furthermore, the finding that the human FFA does not differentiate between human and monkey faces, whereas the macaque face patches respond twice as strongly to monkey faces (Fig. 2e), raises the possibility that the macaque face patches may be more important for processing social/ emotional signals than the human FFA.
Are faces ‘special,’ or do other object categories activate unique patches of cortex as well? To address this question, we presented a stimulus sequence in which five categories (faces, hands, bodies, fruits and technological objects) and scrambled objects were presented with equal frequency during each scan, with each category in a different block. In addition to face-selective patches, we found a specialized patch for bodies, which intriguingly was located adjacent to a face patch (Fig. 3a,b).
Figure 3.
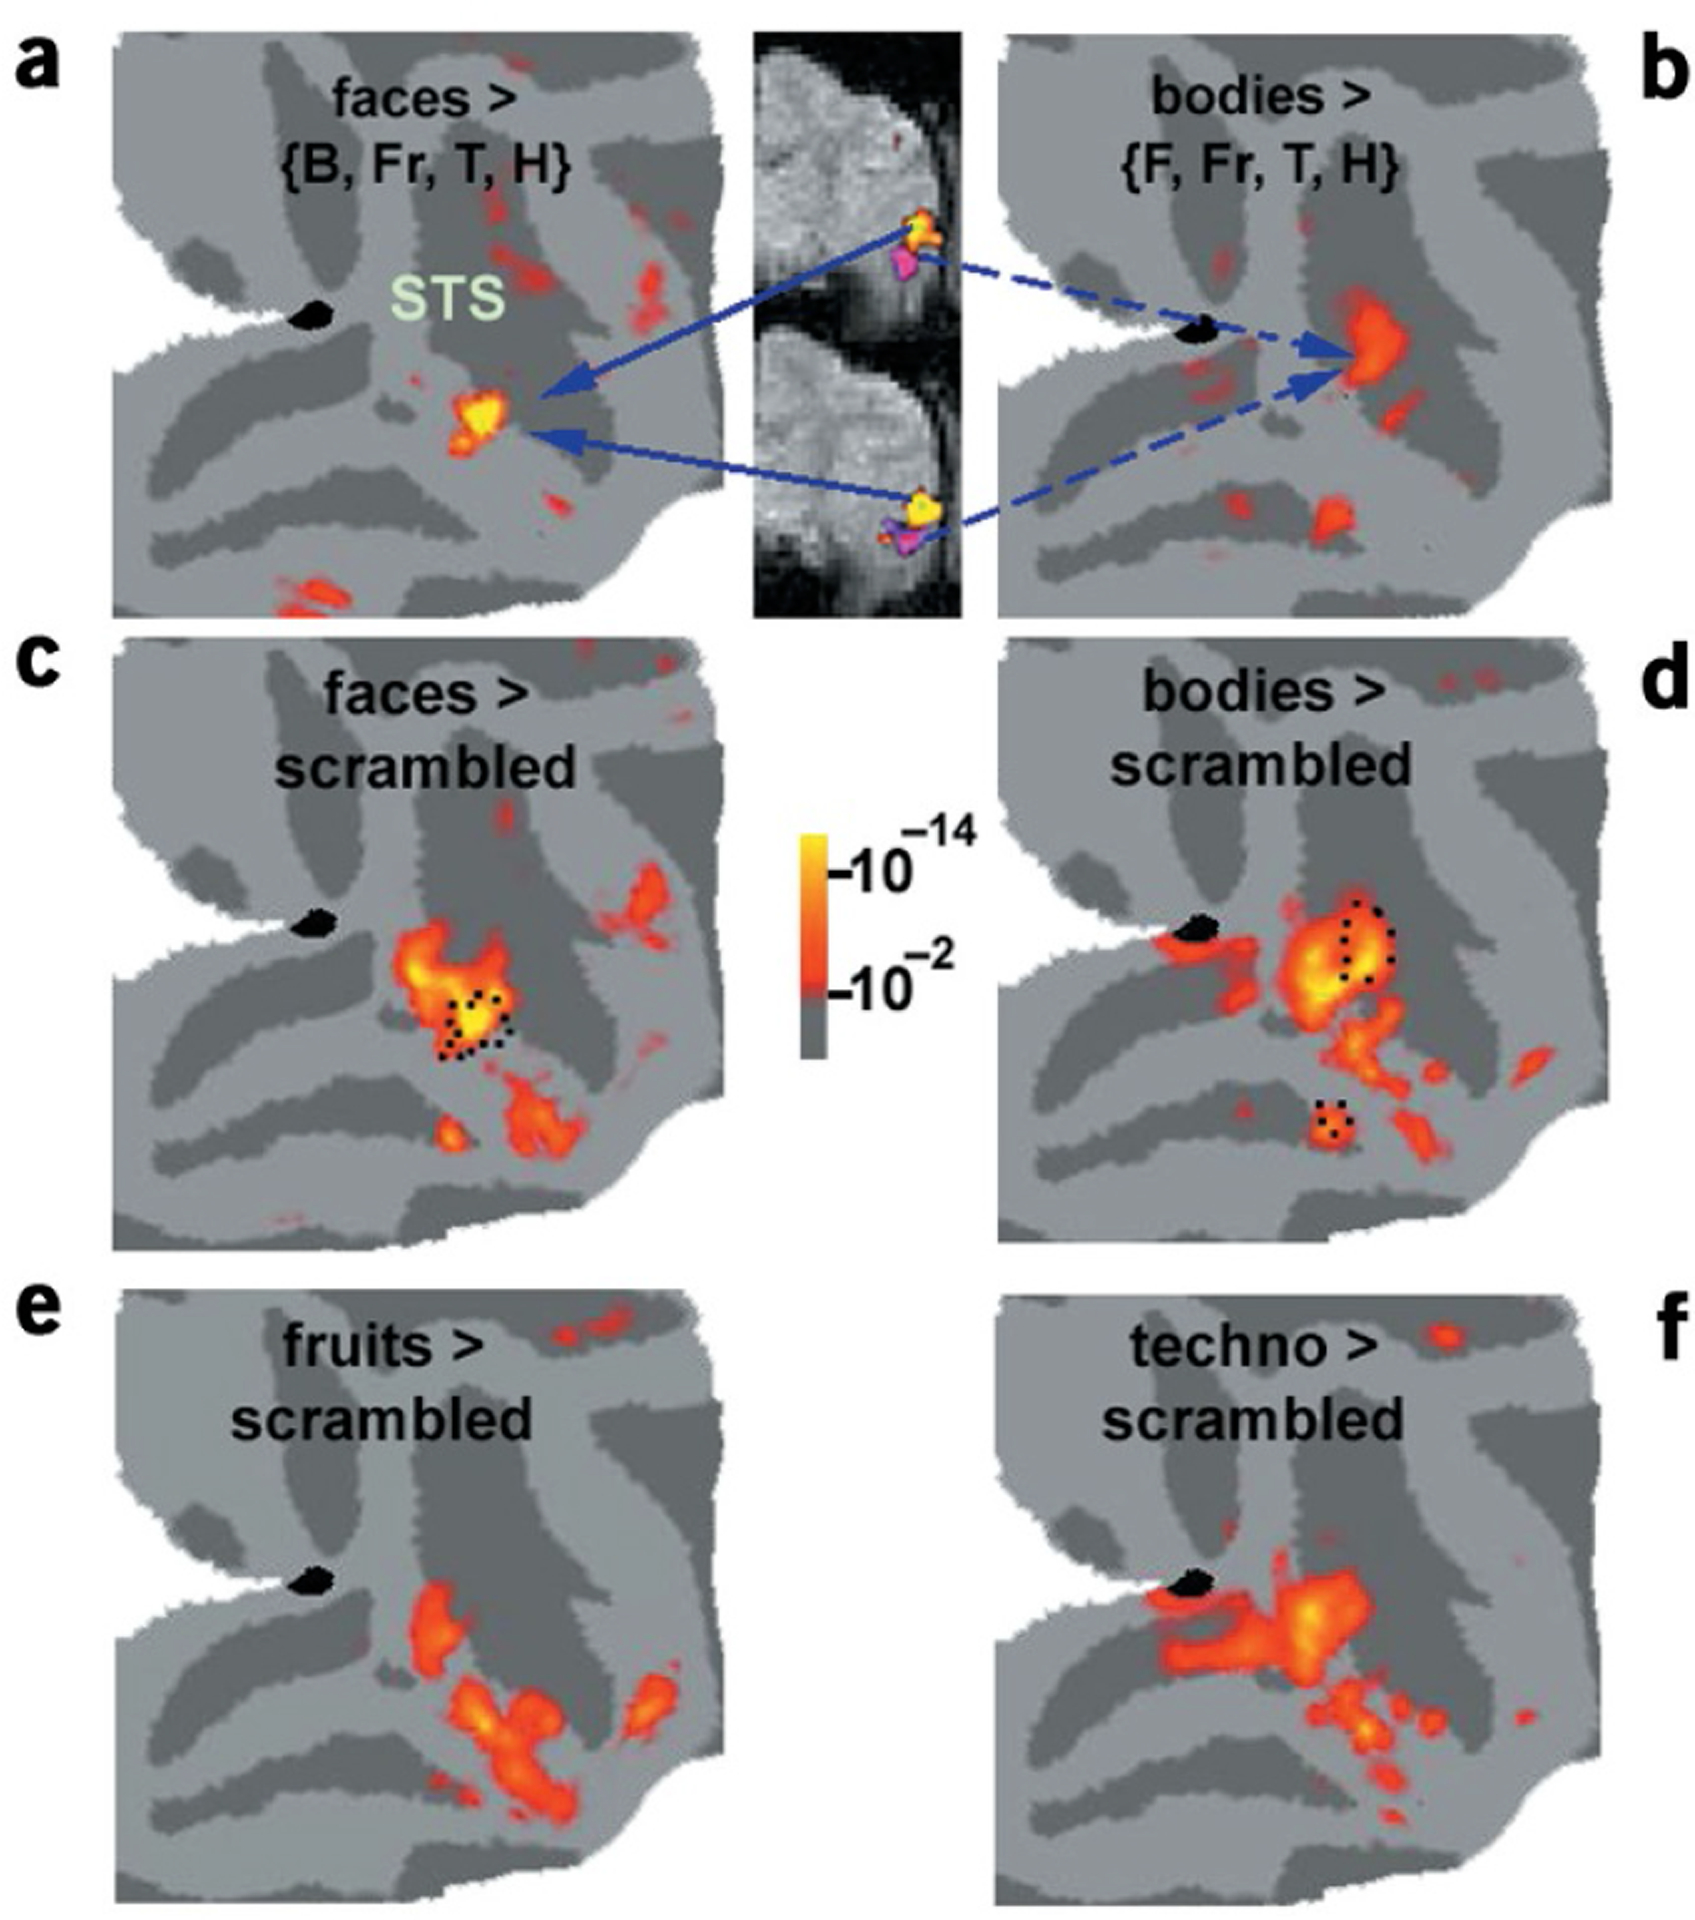
Regions of maximal and relative category selectivity. (a,b) Patches of macaque cortex maximally responsive to faces and to bodies, displayed on the same right-hemisphere map. The body and face-selective patches are also shown on two functional slices, to highlight their proximity. (c–f) Regions significantly more activated by each object category than by grid-scrambled objects. The dotted lines in c and d outline the region of absolute selectivity shown in a and b. The response patterns to the different categories were distributed and partially overlapping.
The lack of specialized patches for categories other than faces and bodies raises the possibility that the macaque brain does not use specialized patches of cortex to represent the majority of categories (such as fruits and technological objects). In agreement with this, we found extensive regions of ‘relative selectivity’ to each category, meaning that the response of the region to the category was significantly greater than to scrambled counterparts, but not significantly greater than to every other intact object category (Fig. 3c–f).
Are the overlapping response patterns within these regions nevertheless consistent and distinctive enough to allow accurate category discrimination? Figure 4a shows the distributed patterns of activity, averaged over even and odd scans independently, to two different object categories, in an exemplary slice from each monkey. The unique and repeatable patterns shown here suggest that distributed response patterns in the macaque can indeed subserve accurate category discrimination.
Figure 4.
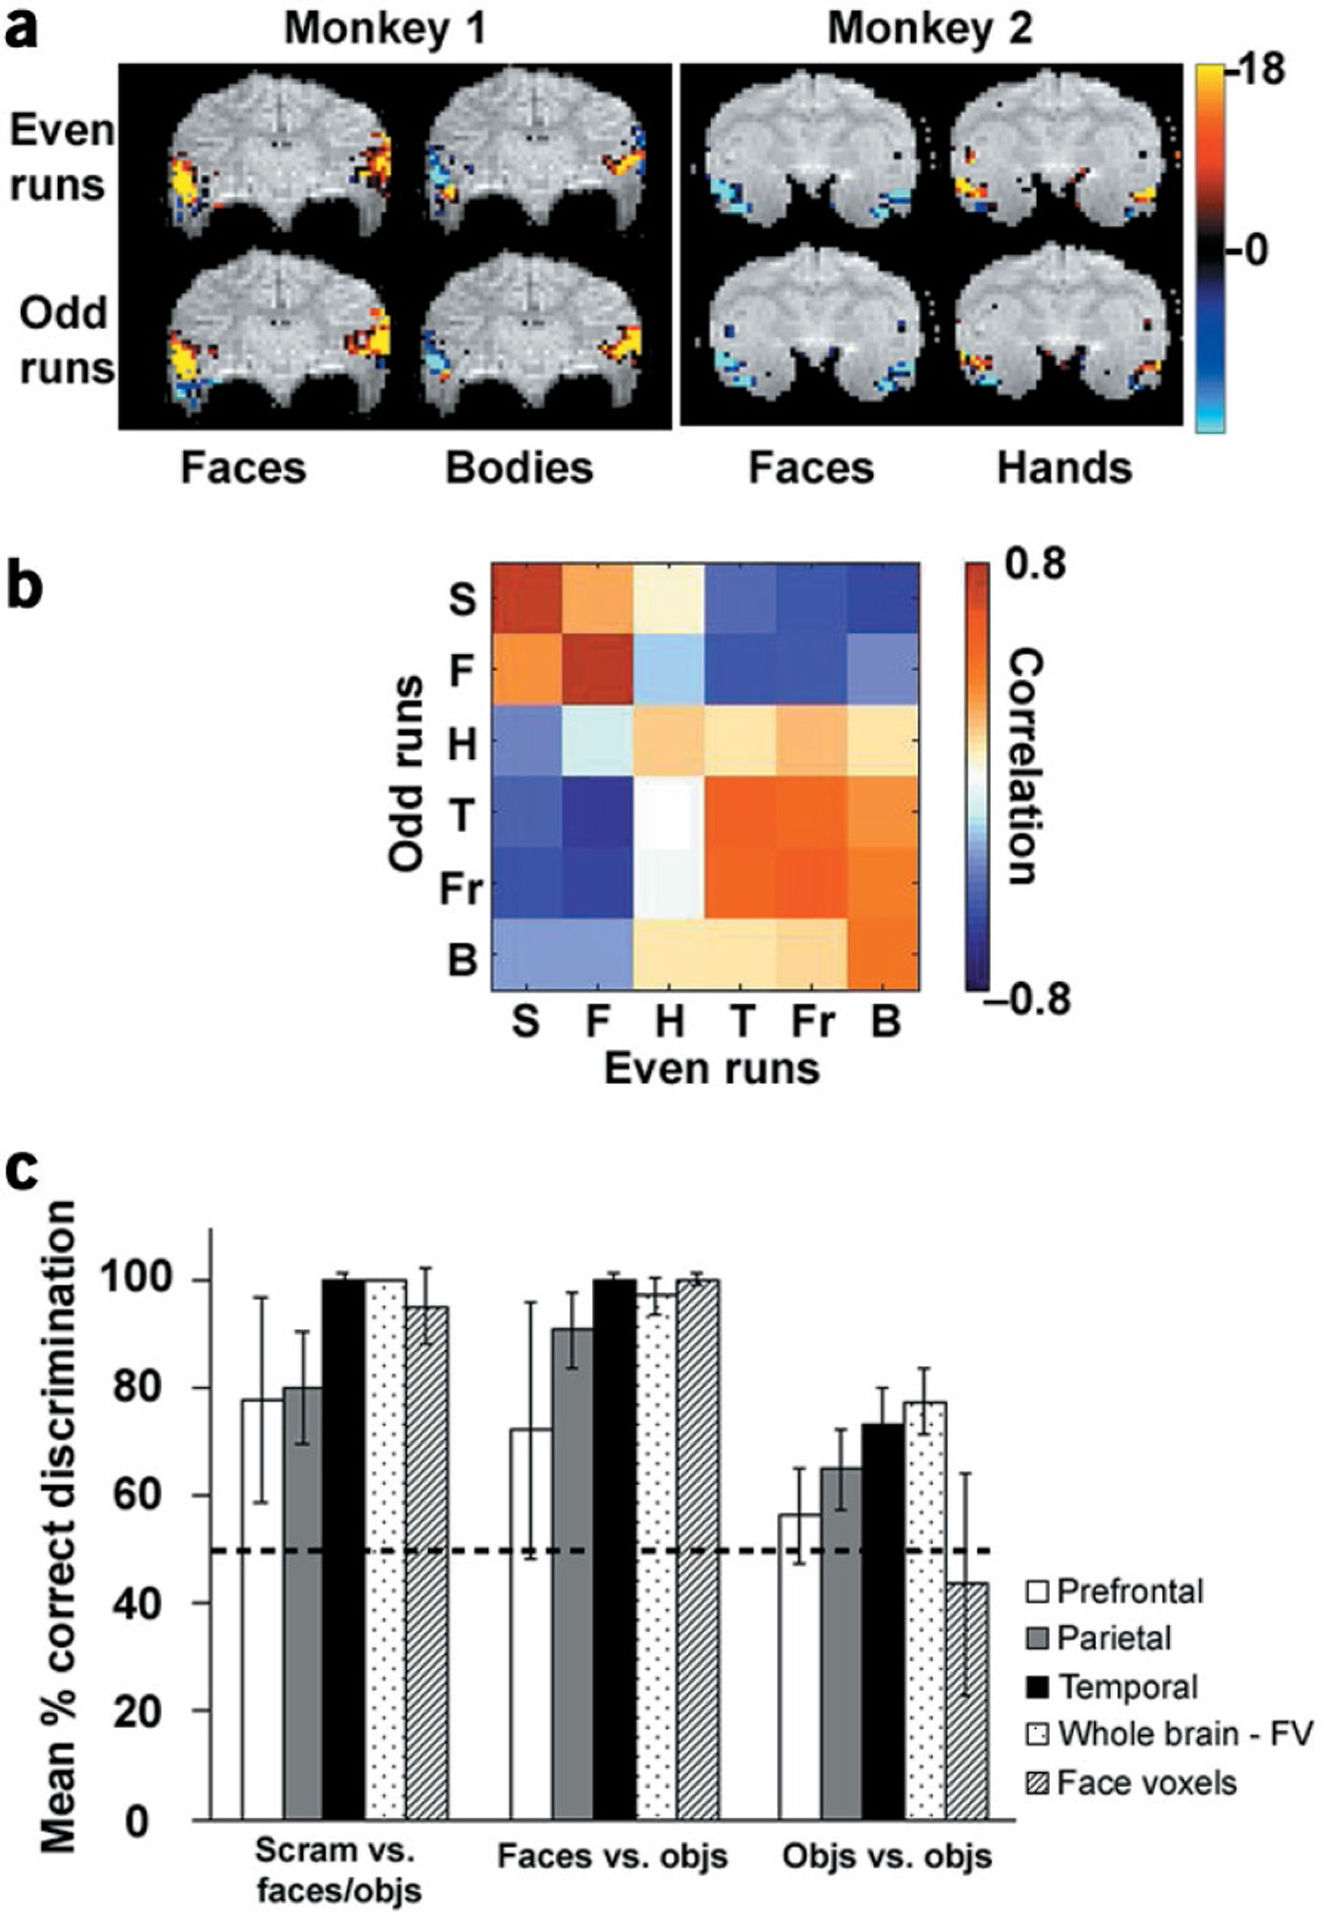
The information content of distributed activity patterns in different brain regions. (a) An exemplary slice from each of two monkeys, showing the response pattern to two different object categories during even and odd runs. (b) Color-coded matrix of correlation values between responses to each object category during even and odd runs (abbreviations as in Fig. 2; S, scrambled technological objects). Only visually activated voxels (P < 0.01) in the temporal lobe were used to compute the correlation matrix, and data were averaged across two monkeys. (c) Mean percentage pairwise correct discrimination (see Methods) and standard errors across two scan sessions in two monkeys for three different discrimination types (faces and objects versus scrambled, faces versus objects, and objects versus objects) based on visually activated voxels in the prefrontal lobe (white), parietal lobe (gray), temporal lobe (black), whole brain excluding face-selective voxels (stippled) and face-selective voxels only (striped). For each discrimination type, chance performance would be 50%. All data were averaged across two experimental sessions in two monkeys.
To address this issue more quantitatively, we used a previously described method7 to compute a matrix of correlation values between the activity patterns elicited by the different object categories during even and odd scans (Fig. 4b,c). A set of consistent and unique responses should result in high correlation values for same-category patterns, and low correlation values for different-category patterns, and such activity patterns could subserve category discrimination. Of course, whether the brain actually uses these patterns to perform category discrimination is a further question not addressed here.
If a diagonal entry in the correlation matrix (Fig. 4b) is the highest (red) in both its row and column, this indicates that the corresponding category can be perfectly discriminated. The correlation matrix revealed that in both monkeys tested, the distributed pattern of face responses allowed perfect discrimination of faces from other object categories. In fact, the correlation value for faces was the greatest of all five categories, demonstrating that faces are indeed ‘special’. Information about other categories was also present. For example, the distributed responses to technological objects and fruits were distinct from that to four other stimulus categories (but similar to each other).
The correlation matrix in Fig. 4b was obtained from visually activated voxels in the temporal lobe. We compared the performance on different discrimination types in different visual areas, and Fig. 4c shows mean percentage pairwise correct discrimination (see Methods) for different discrimination types in the prefrontal lobe, parietal lobe, temporal lobe, whole brain excluding face-selective voxels, and face-selective voxels only. Temporal lobe performance was above chance for each of the three discrimination types, whereas prefrontal performance was at chance. Parietal performance was above chance for discriminating scrambled objects and faces from other categories, but at chance for object-versus-object discriminations. These results support the idea that object recognition is accomplished primarily in temporal cortex1 (but see refs. 29,30).
The near-negligible response to non-face objects within the face patches (Fig. 2d) suggests that cells in these patches are truly specialized for discriminating faces, and carry little information about other object categories. Confirming this prediction, correlation analysis restricted to face-selective (P < 0.01) voxels revealed only chance performance for discriminating non-face objects from one another (Fig. 4c,right cluster, striped bar). In humans, the coding specificity of face-selective patches is currently a topic of debate8–10,28.
The activity patterns analyzed in Fig. 4c were smoothed with a Gaussian kernel of 2 mm full-width-at-half-maximum. One might expect spatial smoothing to diminish discrimination performance. However, when we redid the analysis without any prior spatial smoothing (top graph in Supplementary Fig. 6 online), we found essentially the same pattern of discrimination indices. In particular, the ability of face-selective voxels to discriminate among non-face object categories remained at chance.
We also addressed the converse question: whether the response pattern to faces in voxels not maximally responsive to faces was nevertheless sufficient to distinguish faces. Even without face-selective voxels, the distributed response pattern to faces was sufficient to yield 100% accuracy for discriminating faces from other objects in both monkeys (Fig. 4c,middle cluster, stippled bar). Similar conclusions were reached in human fMRI studies9,10.It has been proposed that the distributed response patterns elicited by faces are used to distinguish faces from other categories, whereas face-specific patches are used to recognize the identity of specific faces10.
A simple explanation of the superior discrimination ability of the temporal lobe could be that there were many more visually-activated voxels in the temporal lobe compared to other regions. When the analysis in Fig. 4c was restricted to the 30 most visually active voxels in each region (Supplementary Fig. 6b), discrimination performance in prefrontal cortex was substantially improved. However, discrimination performance in the temporal lobe remained significantly better than that in parietal and prefrontal lobes, confirming the specialization of the temporal lobe for object recognition1,2.
Discussion
Overall, our findings indicate striking parallels between the representation of different object categories in the human and macaque brain. Using fMRI, we found face-selective cortical patches concentrated in caudal TE of the macaque, which were very similar in number and relative size to face-selective patches in humans. Now that such patches have been described, it becomes possible to use microstimulation, tract tracing, and single-cell recordings in these patches to reveal the detailed mechanisms underlying face recognition. fMRI-guided single-cell recording in particular may shed light on why we were able to find such strong fMRI face selectivity within the macaque face patches, even though single-unit physiologists have reported a maximum of only 20% of the cells in the temporal lobe as face-selective (even in the STS where they are most numerous)6.Resolving such discrepancies will be essential to understanding the relationship between the blood oxygenation level–dependent (BOLD) signal and single-cell physiology.
Even outside the face-selective patches, the overlapping temporal lobe response patterns to different categories carried sufficient information to allow accurate discrimination. In humans, such findings have been interpreted as evidence for a distributed code9,10.Taken together, our results emphasize the importance of face stimuli to primates, and indicate that in both primate species, the code for faces and objects relies on general-purpose as well as specialized cortical machinery.
Predictions for single-cell physiology
Within each voxel, fMRI samples averaged activity across hundreds of thousands of neurons via hemodynamics. If cells with different ‘object tuning curves’ were randomly strewn throughout temporal cortex, then we should not have observed distinct patterns of response to different object categories. Instead, the response to each object category should have been identical in all voxels. The fact that we did observe distinct patterns confirms that cells with similar object tuning curves are clustered together, in agreement with results from single-cell recordings7,13 and optical imaging14,15.
Several studies of the relationship between the BOLD signal and spike rate suggest that the two measures of neural activity have a simple linear relationship31,32.We found that the BOLD response to faces within the macaque face-selective patches was seven times as strong as that to non-face objects: (Responsefaces – Responsebaseline)/ (Responseobjects – Responsebaseline) = 7. Therefore, assuming a linear relationship between BOLD signal and spike rate, we predict that the summed spike output of neurons within the face-selective patches to the face stimuli should be at least seven times as strong as the summed spike output to the non-face stimuli. Obviously, this is only a rough estimate. The net BOLD activation of a voxel to an object category depends on many factors, including the nature of the object variable being encoded, the concentration of category-specific cells, the shape of object-tuning curves, the temporal response properties of cells, the size of functional domains relative to the voxel size and the precise nature of neural-hemodynamic coupling. Thus a detailed understanding of single unit properties within the face-selective patches will require direct recording within these patches.
The role of learning
What is the role of learning in the development of face-selective patches? One possibility is that the patches are innately wired to represent faces; another possibility is that they are adapted, through learning, to represent any set of overtrained stimuli, including but not limited to faces28.Learning can take place over various time scales: seconds, days, months and years.
It is unlikely that the face-selective patches in the macaque reflect learning/adaptation over seconds, as the patches were insensitive to the frequency of presentation of face stimuli compared to other object categories. For example, for the experiment in Supplementary Fig. 3a, the stimulus sequence consisted of alternating blocks of faces and four non-face object categories (thus faces were presented four times as frequently as each of the other categories), whereas for the experiment in the third row (c), all five object categories were presented with equal frequency. Nevertheless, the regions of cortex that responded more strongly to the face stimuli than the object stimuli were virtually identical in the two experiments.
Another possibility is that the face-selective patches developed through learning over the course of multiple scan sessions, as the monkeys became more familiar with the stimuli. This seems unlikely for two reasons. First, the two ‘overtrained’ monkeys were equally familiar with the face and non-face stimuli; thus it is not clear why learning would have generated patches selective for faces but not, for example, fruits. Second, we found face-selective patches in the STS in a third monkey who had never seen any of our face or object stimuli before (Supplementary Fig. 4c).
It remains possible that the development of face-selective patches requires long-term learning of face stimuli from birth. We believe fMRI in monkeys will be an extremely powerful technique to study learning-dependent changes in representation. Our ability to control expertise in humans is limited, but in monkeys it will be possible to generate a high level of expertise for a specific set of stimuli and image the cortical representation before and after such training.
Finally, we want to emphasize the practical importance of identifying face-selective patches. The major difficulty in understanding object recognition is that we don’t know the space in which the vast number of possible objects are represented: iconic cartoons33, Cartesian/polar/hyperbolic gratings34,geons35,principal components36,opponent axes37, and so on. By recording from the face-selective patches, we have the opportunity for the first time to study the representation of a complex form (faces) in a systematic way to decipher the parameter space in which object form is encoded.
Methods
Subjects.
Three male rhesus monkeys (2–3 kg) and six human subjects were scanned in a 3-T Allegra (Siemens) scanner. All procedures conformed to local and NIH guidelines. Informed written consent was obtained for each human subject before the scanning session, and all procedures were approved by Massachusetts General Hospital Human Studies Protocol # 967464 and 2000p-001155. Surgical details and the general experimental procedure are described elsewhere18,20.Human subjects were asked to fixate a small cross at the center of the visual display. Macaque subjects were trained to fixate a small cross, and eye position was monitored using an infrared pupil tracking system (RK-726PCI, ISCAN Inc.) with 0.25° resolution. Macaques were also trained to perform a foveal bar orientation discrimination task (see ref. 18 for details). Figures 1 and 2b and Supplementary Figs. 3 (j,k) and 4 were obtained with the simple fixation task; other figures were obtained with the foveal bar task. Importantly, we found no difference between the activation patterns using these two different methods of enforcing fixation (Supplementary Fig. 3a–h and j).
Scanning.
In total, we obtained 251,464 functional volumes (6,115,240 slices) during 53 scan sessions in one monkey, 164,560 functional volumes (4,183,360 slices) during 40 scan sessions in a second monkey, 4760 functional volumes (142,800 slices) during 2 scan sessions in a third monkey, and 4624 functional volumes (217,600 slices) during 6 scan sessions in six human subjects.
Each monkey experiment consisted of 20–60 functional scans, each lasting ~4 min (EPI; TR = 2 s; TE = 30 ms; 64 ×64 matrix; 1.72 ×1.72 ×2.0 mm or 1.25 ×1.25 ×1.25 mm voxels; 11, 21 or 30 coronal slices). Slices were typically positioned to cover the temporal lobe (see Supplementary Fig. 2 online for a typical set of slices), but some scans (for each experiment) also covered the occipital or frontal lobes. Thus the effective field of view consisted of the entire macaque brain. In an additional scan session, the high-resolution anatomy (1.0 × 1.0 × 1.0 mm voxels) was obtained while the monkey was anesthetized. This anatomical MR data was used to generate the inflated cortex and flattened cortical patches.
The procedure for functional scanning in humans was similar to that for monkeys, but a larger voxel size was used to accommodate the larger human brains (3.1 ×3.1 ×3.1 mm voxels and 28 slices). In humans, slices were oriented in an oblique axial plane, approximately perpendicular to the calcarine sulcus.
Data analysis.
Data were analyzed using FS-FAST and Freesurfer (http://surfer.nmr.mgh.harvard.edu/) as well as custom code written in Matlab. Data were motion-corrected, quadratically detrended and smoothed with a Gaussian kernel of 2 mm (monkey) or 5 mm (human) full-width-at-half-maximum. To generate significance maps, we calculated the mean and variance of the response in each voxel to each condition across the entire scan session. Then t-tests for appropriate comparisons were performed. Area borders for the macaque brain were derived from a surface-based atlas21 and were mapped to individual hemispheres by surface-based registration of spherical maps27 using CARET software (atlases and software available at http://brainmap.wustl.edu/).
For the correlation analysis (Fig. 4), we first computed the average hemodynamic response pattern elicited by each of the six stimulus categories during even and odd runs. Then we normalized these patterns by subtracting the mean response pattern to all six conditions (for even and odd run patterns separately). Finally, voxel-wise correlations were computed for each of the 36 possible pairs of even and odd run response patterns, using the formula r(v,w) = (v·w)/sqrt(vw2). The mean percent correct discrimination for each discrimination type was computed from the correlation matrix by evaluating an inequality corresponding to each pairwise discrimination, assigning a 0 or a 1 depending on the outcome, and taking the average over all discriminations. For example, discrimination of objects versus objects required the evaluation of 4 ×6 = 24 inequalities. (see refs. 9,10 for more details).
Visual stimuli.
Visual stimuli were displayed using a Sharp XG-NV6XU LCD projector (1,024 ×768 pixels, 60 Hz refresh rate), on a screen which was positioned 53 cm (monkey) or 42 cm (human) in front of the eyes. Each image was 11°×11°(monkey) or 14°×14°(human).
All stimuli were presented in a block design. Each image was presented for 1 s, and each block lasted 16 s (i.e., 16 images). The method of ordering the blocks varied between experimental sessions. For two-condition comparisons as well as experiments to extract time courses, different blocks of faces, objects and scrambled counterparts were arranged in an alternating design. For experiments to reveal the detailed response pattern to different categories, each category (faces, bodies, hands, fruits, technological objects and grid-scrambled technological objects) was presented five times every two scans. Epochs of the different categories were presented within each scan in a way that balanced the serial position of the category across scans. Importantly, we verified that the face-specific patches remained the same, regardless of whether the stimulus order consisted of repeating blocks of {scrambled faces, faces, scrambled objects, objects} or whether it consisted of a fully randomized presentation sequence in which each of the five non-face stimuli blocks were presented just as frequently as faces (Supplementary Fig. 3 online).
Two methods of image scrambling were used. To generate grid-scrambled images (Figs. 1, 3, 4), we divided the images into 20 ×20 blocks and randomly shuffled them. To generate Fourier-scrambled images (Supplementary Fig. 2 online), we randomized the Fourier phase of each spectral component.
Supplementary Material
Acknowledgements
We wish to thank R. Desimone, N. Kanwisher, K.S. Saleem, Y. Sasaki, W. Vanduffel and D.C. Van Essen for their comments on the manuscript and valuable discussions. We are also grateful to W. Vanduffel and L. Wald for setting up the monkey fixation system, to D.C. Van Essen for help with using CARET, and to D. Greve for help with using FSFAST. This study was supported by the National Center for Research Resources (P41RR14075), the Mental Illness and Neuroscience Discovery Institute, and grants from the National Institutes of Health (R01 MH67529 A01 and R01 EB00790 A01).
Footnotes
Competing Interests Statement
The authors declare that they have no competing financial interests.
Note: Supplementary information is available on the Nature Neuroscience website.
References
- 1.Ungerleider L & Mishkin M Two cortical visual systems. in Analysis of Visual Behavior (ed. Ingle D) 549–586 (MIT Press, Cambridge, Massachusetts, 1982). [Google Scholar]
- 2.Logothetis N & Sheinberg D Visual object recognition. Annu. Rev. Neurosci 19, 577–621 (1996). [DOI] [PubMed] [Google Scholar]
- 3.Gross CG, Rocha-Miranda CE & Bender DB Visual properties of neurons in inferotemporal cortex of the macaque. J. Neurophysiol 35, 96–111 (1972). [DOI] [PubMed] [Google Scholar]
- 4.Desimone R, Albright T, Gross CG & Bruce C Stimulus-selective properties of inferior temporal neurons in the macaque. J. Neurosci 4, 2051–2062 (1984). [DOI] [PMC free article] [PubMed] [Google Scholar]
- 5.Perrett D, Hietanen J, Oram M & Benson P Organization and function of cells responsive to faces in the temporal cortex. Phil. Trans. R. Soc. Lond 335, 23–30 (1992). [DOI] [PubMed] [Google Scholar]
- 6.Baylis G, Rolls E & Leonard C Functional subdivisions of the temporal lobe neocortex. J. Neurosci 7, 330–342 (1987). [DOI] [PMC free article] [PubMed] [Google Scholar]
- 7.Tanaka K, Saito H, Fukada Y & Moriya M Coding visual images of objects in the inferotemporal cortex of the macaque monkey. J. Neurophysiol 66, 170–189 (1991). [DOI] [PubMed] [Google Scholar]
- 8.Kanwisher N, McDermott J & Chun M The fusiform face area: a module in human extrastriate cortex specialized for face perception. J. Neurosci 17, 4302–4311 (1997). [DOI] [PMC free article] [PubMed] [Google Scholar]
- 9.Haxby J et al. Distributed and overlapping representations of faces and objects in ventral temporal cortex. Science 293, 2425–2430 (2001). [DOI] [PubMed] [Google Scholar]
- 10.Spiridon M & Kanwisher N How distributed is visual category information in human occipito-temporal cortex? An fMRI study. Neuron 35, 1157–1165 (2002). [DOI] [PubMed] [Google Scholar]
- 11.Epstein R & Kanwisher N A cortical representation of the local visual environment. Nature 392, 598–601 (1998). [DOI] [PubMed] [Google Scholar]
- 12.Downing P, Jiang Y, Shuman M & Kanwisher N A cortical area selective for visual processing of the human body. Science 293, 2470–2472 (2001). [DOI] [PubMed] [Google Scholar]
- 13.Fujita I, Tanaka K, Ito M & Cheng K Columns for visual features of objects in monkey inferotemporal cortex. Nature 360, 343–346 (1992). [DOI] [PubMed] [Google Scholar]
- 14.Wang G, Tanaka K & Tanifuji M Optical imaging of functional organization in the monkey inferotemporal cortex. Science 272, 1665–1668 (1996). [DOI] [PubMed] [Google Scholar]
- 15.Tsunoda K, Yamane Y, Nishizaki M & Tanifuji M Complex objects are represented in macaque inferotemporal cortex by the combination of feature columns. Nat. Neurosci 4, 832–838 (2001). [DOI] [PubMed] [Google Scholar]
- 16.Dubowitz DJ et al. Functional magnetic resonance imaging in macaque cortex. NeuroReport 9, 2213–2218 (1998). [DOI] [PubMed] [Google Scholar]
- 17.Logothetis N, Guggenberger H, Peled S & Pauls J Functional imaging of the monkey brain. Nat. Neurosci 2, 555–562 (1999). [DOI] [PubMed] [Google Scholar]
- 18.Vanduffel W et al. Visual motion processing investigated using contrast-agent enhanced fMRI in awake behaving monkeys. Neuron 32, 565–577 (2001). [DOI] [PubMed] [Google Scholar]
- 19.Nakahara K, Hayashi T, Konishi S & Miyashita Y Functional MRI of macaque monkeys performing a cognitive set-shifting task. Science 295, 1532–1536 (2002). [DOI] [PubMed] [Google Scholar]
- 20.Leite FP et al. Repeated fMRI using iron oxide contrast agent in awake, behaving macaques at 3 tesla. Neuroimage 16, 283–294 (2002). [DOI] [PubMed] [Google Scholar]
- 21.Van Essen DC Organization of visual areas in macaque and human cerebral cortex. in The Visual Neurosciences (eds. Chalupa L & Werner JS) (MIT Press, Cambirdge, Massachusetts, 2003). [Google Scholar]
- 22.Lewis JW & Van Essen DC Mapping of architectonic subdivisions in the macaque monkey, with emphasis on parieto-occipital cortex. J. Comp. Neurol 428, 79–111 (2000). [DOI] [PubMed] [Google Scholar]
- 23.Sakata H et al. Neural coding of 3D features of objects for hand action in the parietal cortex of the monkey. Phil. Trans. R. Soc. Lond. B. Biol. Sci 353, 1363–1373 (1998). [DOI] [PMC free article] [PubMed] [Google Scholar]
- 24.Scalaidhe S, Wilson F & Goldman-Rakic P Areal segregation of face-processing neurons in prefrontal cortex. Science 278, 1135–1138 (1997). [DOI] [PubMed] [Google Scholar]
- 25.Grill-Spector K, Kourtzi Z & Kanwisher N The lateral occipital complex and its role in object recognition. Vision Res. 41, 1409–1422 (2001). [DOI] [PubMed] [Google Scholar]
- 26.Allman J & McGuiness E Visual cortex in primates. in Comparative Primate Biology (eds. Mitchell G & Erwin J) 279–326 (Alan R. Liss, New York, 1988). [Google Scholar]
- 27.Van Essen DC et al. An integrated software system for surface-based analyses of cerebral cortex. J. Amer. Med. Informatics Assoc 8, 443–459 (2001). [DOI] [PMC free article] [PubMed] [Google Scholar]
- 28.Gauthier I & Logothetis N Is face recognition not so unique after all? Cognit. Neuropsychol. 17, 125–142 (1999). [DOI] [PubMed] [Google Scholar]
- 29.Sereno AB & Maunsell JH Shape selectivity in primate lateral intraparietal cortex. Nature 395, 500–503 (1998). [DOI] [PubMed] [Google Scholar]
- 30.Freedman DJ, Riesenhuber M, Poggio T & Miller EK Categorical representation of visual stimuli in primate prefrontal cortex. Science 291, 312–316 (2001). [DOI] [PubMed] [Google Scholar]
- 31.Rees G, Friston KJ & Koch C A direct, quantitative relationship between the functional properties of human and macaque V5. Nat. Neurosci 3, 716–723 (2000). [DOI] [PubMed] [Google Scholar]
- 32.Logothetis NK, Pauls J, Augath M, Trinath T & Oeltermann A Neurophysiological investigation of the basis of the fMRI signal. Nature 412, 150–157 (2001). [DOI] [PubMed] [Google Scholar]
- 33.Cavanagh P Vision is getting easier every day. Perception 24, 1227–1232 (1995). [DOI] [PubMed] [Google Scholar]
- 34.Gallant JL, Braun J & Van Essen DC Selectivity for polar, hyperbolic and Cartesian gratings in macaque visual cortex. Science 259, 100–103 (1993). [DOI] [PubMed] [Google Scholar]
- 35.Biederman I Visual object recognition. in Visual Cognition (eds. Kosslyn SM & Osheron DN) 121–166 (MIT Press, Cambridge, MA, 1995). [Google Scholar]
- 36.Turk M & Pentland A Eigenfaces for recognition. J. Cogn. Neurosci 1995, 71–86 (1991). [DOI] [PubMed] [Google Scholar]
- 37.Leopold DA, O’Toole A, Vetter T & Blanz V Prototype-referenced shape encoding revealed by high-level aftereffects. Nat. Neurosci 4, 89–94 (2001). [DOI] [PubMed] [Google Scholar]
- 38.Ungerleider L & Desimone R Cortical connections of visual area MT in the macaque. J. Comp. Neurol 248, 190–222 (1986). [DOI] [PubMed] [Google Scholar]
- 39.Sereno MI et al. Borders of multiple visual areas in humans revealed by functional magnetic resonance imaging. Science 268, 889–893 (1995). [DOI] [PubMed] [Google Scholar]
Associated Data
This section collects any data citations, data availability statements, or supplementary materials included in this article.