Fig. 1.
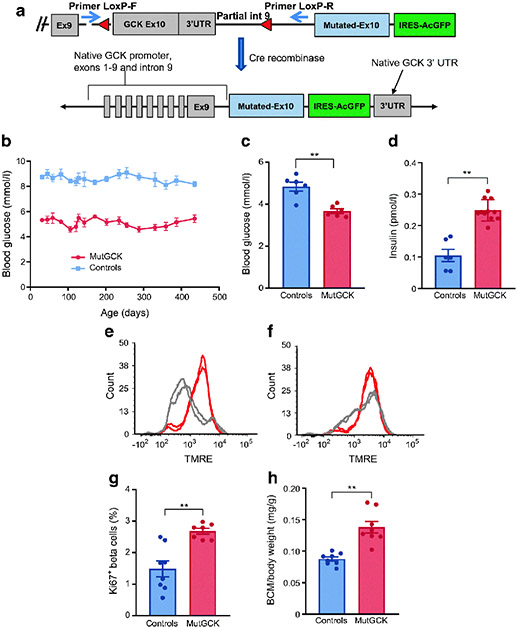
Description and phenotype of novel model for GCK-CHI. (a) Schematic representation of mouse model. Upper panel, a cassette including the mutated Gck exon 10 followed by IRES-AcGFP was inserted immediately downstream to the native exon 10, which was flanked by LoxP sites (red triangles). Thus, Cre recombinase results in removal of the native exon 10 and expression of mutant exon 10 in the natively regulated Gck locus, as shown in the lower panel. Two PCR primers (blue arrows, upper panel) were designed to measure efficiency of recombination. (b) Activation of mutGCK persistently decreased random blood glucose levels in beta-mutGCK mice (referred to as mutGCK in this and subsequent figures) (n=6 mice/group). (c, d) Decreased glucose and increased insulin secretion in vivo after a 1 h fast in young mice (n=9 beta-mutGCK and 6 control mice). (e, f) FACS analysis of TMRE; beta cells isolated from young control (e) and beta-mutGCK (f) mice. Islets from beta-mutGCK mice exhibited significantly increased membrane potential response in 2.8 mmol/l glucose (n=4 mice/group). (g) The fraction of replicating beta cells is almost doubled in 1.5-month-old beta-mutGCK mice (n=8 beta-mutGCK and 9 control mice). (h) Activation of beta-mutGCK caused an increase in beta cell mass as a function of body weight [(pancreas weight × %beta cells)/body weight] at age 1.5 months (n=7 beta-mutGCK and 8 control mice). Bars represent standard error (*p<0.05, **p<0.001). BCM, beta cell mass; Ex, exon; int, intron; IRES-AcGFP, internal ribosome entry site followed by activated green fluorescent protein; UTR, untranslated region

