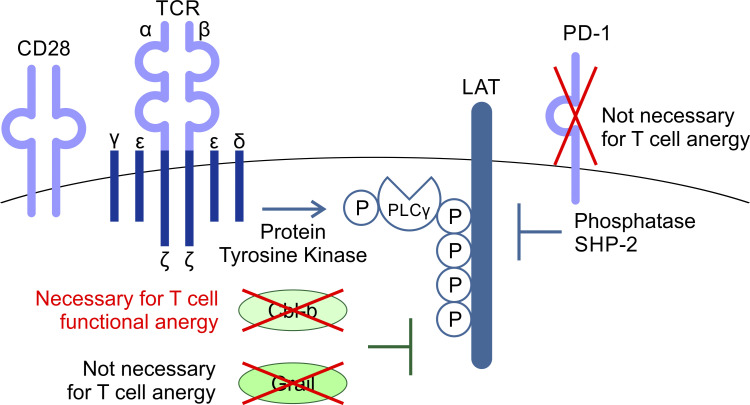
T cell anergy is an important peripheral tolerance mechanism to prevent autoimmunity. Nguyen et al. find that T cell anergy develops in the periphery, not in the thymus, and depends upon Cbl-b but not Grail or PD-1.
Abstract
T cell anergy is an important peripheral tolerance mechanism. We studied how T cell anergy is established using an anergy model in which the Zap70 hypermorphic mutant W131A is coexpressed with the OTII TCR transgene (W131AOTII). Anergy was established in the periphery, not in the thymus. Contrary to enriched tolerance gene signatures and impaired TCR signaling in mature peripheral CD4 T cells, CD4SP thymocytes exhibited normal TCR signaling in W131AOTII mice. Importantly, the maintenance of T cell anergy in W131AOTII mice required antigen presentation via MHC-II. We investigated the functional importance of the inhibitory receptor PD-1 and the E3 ubiquitin ligases Cbl-b and Grail in this model. Deletion of each did not affect expression of phenotypic markers of anergic T cells or T reg numbers. However, deletion of Cbl-b, but not Grail or PD-1, in W131AOTII mice restored T cell responsiveness and signaling. Thus, Cbl-b plays an essential role in the establishment and/or maintenance of unresponsiveness in T cell anergy.
Graphical Abstract
Introduction
T cell anergy is an adaptive state resulting from absent costimulation and/or high coinhibitory tone (Schwartz, 2003). As a result, anergic CD4 T cells lose the ability to produce the autocrine growth factor IL-2 or proliferate to agonist antigens (Schwartz, 2003). Naturally occurring anergic T cells are characterized by their Foxp3− (non–regulatory T [T reg] cell) CD73+FR4+ phenotype (Kalekar et al., 2016). Anergy induction not only prevents the responsiveness of potentially harmful self-reactive CD4 T cells but also generates progenitor cells for peripheral T reg cells. A population of Nrp1+ anergic CD4 T cells is the precursor of Foxp3+Nrp1+ T reg cells (Kalekar and Mueller, 2017; Kalekar et al., 2016). T reg cells actively suppress immune responses. Thus, anergic T cells and T reg cells are two major peripheral tolerance mechanisms to prevent autoimmune diseases.
T cell anergy has been observed both in vitro and in vivo. The in vitro induction of anergy has been described with agents that engage the TCR alone in the absence of costimulatory ligands, such as occurs with chemically fixed APCs, inefficient APCs such as small resting B cells, purified MHC–peptide complexes, anti-CD3 antibody, or the mitogen concanavalin A (Gajewski et al., 1994; Jenkins and Schwartz, 1987). An anergic state can also be induced by altered low-avidity peptide or low doses of agonist peptides (Korb et al., 1999; Mirshahidi et al., 2001; Sloan-Lancaster et al., 1993). Calcium ionophores, such as ionomycin, that trigger NFAT alone in the absence of AP-1 cooperation, can induce in a gene expression program associated with T cell anergy in vitro (Macián et al., 2002). Models of T cell anergy in vivo are induced by repeated exposure to superantigens or soluble peptides in the absence of adjuvant in TCR transgenic mice, or by adoptive transfer of TCR transgenic T cells into hosts that express the cognate antigen as a self-antigen (Dubois et al., 1998; Kawabe and Ochi, 1990; Kearney et al., 1994; Pape et al., 1998). However, it is important to note that the methods by which antigens are delivered for inducing anergy in vivo can have a profound impact on the functional outcome of anergic T cells in these model systems and are largely nonphysiological. Here we used a distinct genetic strategy to induce anergy: a Zap70 hypermorphic mutant, W131A, which prevents Zap70 autoinhibition, to study T cell anergy. Introduction of the W131A mutant into the OTII TCR transgenic background (W131AOTII) results in increased, but incomplete, negative selection due to increased signal strength resulting from OTII recognition of an unknown self-pMHC. As a consequence of incomplete thymic-negative selection, high numbers of peripheral anergic and T reg CD4 T cells were observed (Hsu et al., 2017). This genetically encoded mouse model of T cell anergy has two advantages over other previous models of T cell anergy. First, T cell anergy is naturally occurring without transferring T cells or introducing antigens into these mice. Second, functional features of T cell unresponsiveness correspond to those of classical anergy: poor proliferation and little IL-2 production in response to antigen or TCR stimulation.
The function of peripheral T cells is tightly regulated by a combination of TCR signaling as well as costimulatory and coinhibitory molecules. Unresponsiveness in anergic T cells has been attributed to the induction of multiple negative regulators, including PD-1 and E3 ubiquitin ligases, that target TCR signaling pathways (Fathman and Lineberry, 2007; Lutz-Nicoladoni et al., 2015; Mueller, 2004). The inhibitory receptor PD-1 has been associated with the inactive state of anergic T cells, and anti–PD-1–mediated blockade can partially reverse T cell anergy, including in the model studied here (Hsu et al., 2017; Tsushima et al., 2007). PD-1 inhibits T cell responses by recruiting the SH2 domain–containing phosphatases SHP1 and SHP2. Recruited to the plasma membrane, these cytoplasmic phosphatases target protein tyrosine kinase (PTK)–dependent pathways in the TCR or CD28 pathways (Chemnitz et al., 2004; Hui et al., 2017). The E3 ubiquitin ligases Cbl proto-oncogene B (Cbl-b) and gene related to anergy in lymphocytes (Grail) are highly expressed in anergic T cells and contribute to establishing the unresponsive state (Fathman and Lineberry, 2007; Lutz-Nicoladoni et al., 2015; Mueller, 2004). E3 ubiquitin-protein ligases recognize and transfer ubiquitin from specific E2 ubiquitin-conjugating enzymes to target substrates, generally promoting substrate degradation by the proteasome or lysosome (Buetow and Huang, 2016). Cbl-b interacts with and inhibits multiple downstream molecules of PTK-dependent TCR and costimulatory CD28 pathways (Bachmaier et al., 2000; Thien and Langdon, 2005). Cbl-b–deficient T cells stimulated via the TCR alone can respond similarly to those that have received both TCR and CD28-mediated costimulation (Bachmaier et al., 2000; Chiang et al., 2000; Jeon et al., 2004). Similar to Cbl-b, Grail is well-known as a negative regulator of TCR responsiveness and cytokine production (Anandasabapathy et al., 2003; Soares et al., 2004). Grail expression is associated with decreased cytokine transcription and proliferation and contributes to anergy induction as well as suppressive functions in T cells (Anandasabapathy et al., 2003; Soares et al., 2004). Grail has been reported to target the TCR ζ chain and the IL-21 receptor for degradation (Haymaker et al., 2017; Nurieva et al., 2010). Deletion of Grail leads to hyperactivation of primary CD4+ T cells in response to TCR stimulation and resistance to anergy induction (Bachmaier et al., 2000; Nurieva et al., 2010). Thus, PD-1, Cbl-b, and Grail each represent candidates likely to mediate T cell unresponsiveness in the anergic state, but their relative contributions are not known.
Whether the T cell anergic state is induced and established in the thymus or in the periphery is not known. By using our genetically encoded mouse model of T cell anergy (W131AOTII), we find that anergy was established in the periphery, but not in the thymus. Furthermore, we investigated the contributions of PD-1, Cbl-b, and Grail in the W131AOTII model using mice deficient in each of these negative regulators. Interestingly, loss of Cbl-b, Grail, or PD-1 did not affect the numbers of phenotypically identified anergic CD4 T cells or numbers of T reg cells in W131AOTII mice. However, loss of Cbl-b, but not Grail or PD-1, reversed peripheral T cell unresponsiveness to antigen or TCR stimulation in these mice. Taken together, these results reveal that T cell anergy is induced in the periphery, and Cbl-b plays an essential role in the regulation of unresponsiveness of anergic CD4 T cells. Moreover, cell surface markers associated with the anergic state may not be reliable markers of T cell unresponsiveness.
Results
In contrast to peripheral T cells, mature CD4 thymocytes exhibit normal TCR signaling in W131AOTII mice
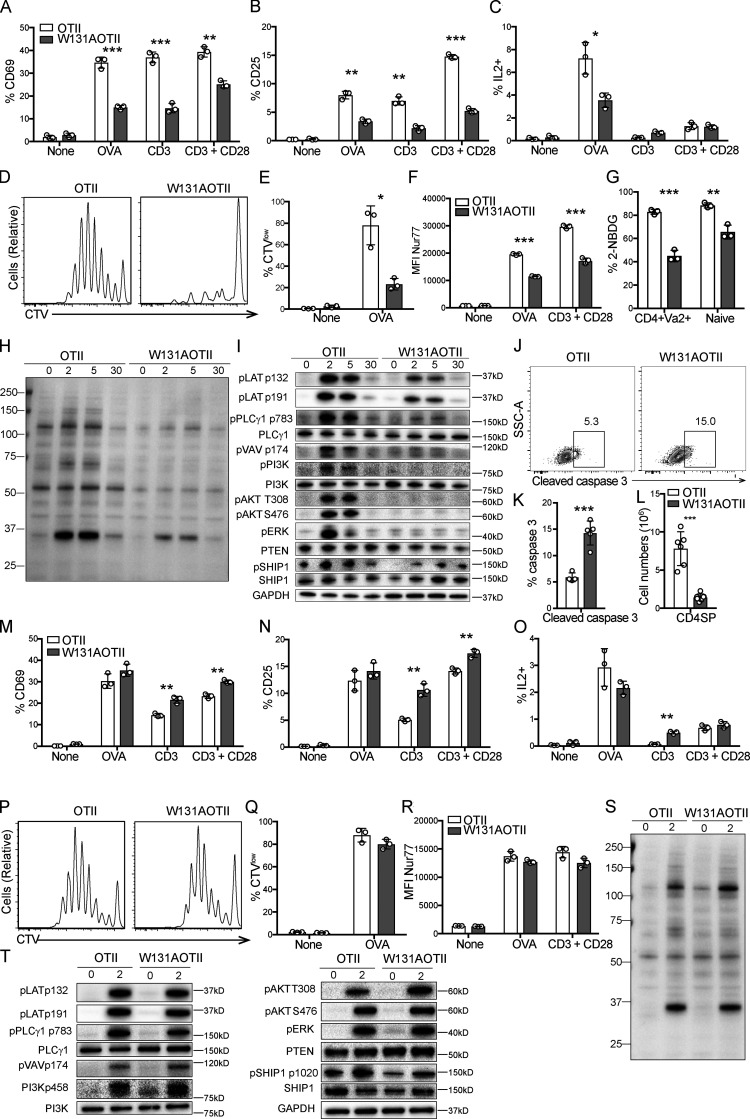
To address the mechanism underlying T cell anergy, we used mice in which the Zap70 W131A hypermorphic mutant is introduced into the OTII transgenic background (W131AOTII; Hsu et al., 2017). Since naive W131AOTII T cells were previously shown to be markedly functionally impaired and contained few phenotypically defined (CD73+FR4+) anergic T cells, they are probably precursors of the large number of anergic T cells seen in memory T cells (Hsu et al., 2017). Therefore, we studied TCR signaling in conventional naive OTII T cells from W131AOTII mice. Consistent with our previously published study (Hsu et al., 2017), peripheral naive CD25− W131AOTII CD4 T cells displayed impaired induction of activation markers, such as CD25 and CD69, in response to OVA peptide or TCR stimulation (Fig. 1, A and B). The proportion of IL-2–secreting cells and proliferative responses in W131AOTII CD4 T cells were greatly reduced after OVA peptide stimulation compared with OTII T cells (Fig. 1, C–E).
Figure 1.
In contrast to peripheral T cells, mature CD4 thymocytes exhibit normal TCR signaling in W131AOTII mice. (A–F) Peripheral naive CD25−CD4+ T cells from age-matched OTII, W131AOTII mice (n = 3 mice/group) were cultured with TCRα−/− splenocytes plus 0.1 µM OVA peptide, plate-bound anti CD3 (0.3 µg/ml) with or without anti-CD28 (2 µg/ml). (A–C) Bar graphs indicate mean frequencies ± SD for CD69+ (A), CD25+ (B), and IL2+ (C) of naive OTII and W131AOTII CD4+ T cells after 16 h culture. (D and E) Peripheral OTII and W131AOTII CD4+ T cells after culture with TCRα−/− splenocytes plus 0.1 µM OVA peptide for 4 d. Peripheral naive CD25−CD4+ T cells from OTII and W131AOTII mice were loaded with CTV dye. (D) Dilution of cell trace dye by flow cytometry. (E) Percentages of proliferating (CTVlow) cells of Vα2+CD4+ T cells. (F) Graphs show mean fluorescence intensity (MFI) for Nur77 of naive Vα2+CD4+ T cells after 16 h culture. (G) Frequencies of fluorescent glucose analogue+ (2-NBDG+) of OTII and W131AOTII cells after 2 h of culture. (H and I) Immunoblot analyses of phosphotyrosine (H) and phosphorylation of total TCR proximal signaling molecules in peripheral naive Vα2+CD4+ T cells (I; n = 4–8 mice/group) that were left unstimulated or were stimulated with anti-CD3 (1 µg/ml) followed by cross-linking with 20 µg/ml anti–Armenian hamster IgG for 2, 5, and 30 min. GAPDH was used as a loading control. (J) FACS plots showing activated caspase 3 staining in TCRβ+CD5+ thymocytes. (K and L) Bar graphs indicating mean frequencies ± SD for activated caspase 3+ of TCRβ+CD5+ thymocytes (K) and numbers of CD4SP thymocytes (L). (M–R) CD25− CD4SP thymocytes from OTII, W131AOTII mice (n = 3 mice/group) were cultured with TCRα−/− splenocytes plus 0.1 µM OVA peptide, plate-bound anti-CD3 (0.3 µg/ml) with or without anti-CD28 (2 µg/ml). (M–O) Bar graphs indicating mean frequencies ± SD for CD69+ (M), CD25+ (N), and IL2+ (O) of Vα2+CD4SP thymocytes after 16 h culture. (P and Q) Histograms comparing proliferative responses and frequencies for proliferative (CTVlow) cells of Vα2+CD4SP thymocytes after culture for 4 d. (R) Graphs show MFI for Nur77 of Vα2+ CD4SP thymocytes after 16 h culture. (S and T) Immunoblot analysis of phosphotyrosine (S) and phosphorylation of total TCR proximal signaling molecules in Vα2+CD4SP thymocytes (T; n = 3–6 mice/group) stimulated with anti-CD3 (1 µg/ml) followed by cross-linking with 20 µg/ml anti–Armenian hamster IgG for 2 min. GAPDH, loading control. Data are representative of three independent experiments. Two-tailed Student’s t test was performed. *, P < 0.05; **, P < 0.005; ***, P < 0.0005.
To confirm the defects in peripheral T cell responsiveness in W131AOTII mice, we used a Nur77-GFP reporter to study the integrated TCR signal strength perceived by T cells (Moran et al., 2011; Zikherman et al., 2012). Up-regulation of Nur77-GFP was strongly diminished in peripheral W131AOTII CD4 T cells stimulated with OVA peptide or TCR stimulation compared with similarly stimulated OTII T cells (Fig. 1 F). Naive CD4 T cells from W131AOTII mice also exhibited defects in glucose uptake compared with control OTII T cells (Fig. 1 G). These profound reductions in T cell responsiveness and glucose uptake by naive W131AOTII T cells support the notion that this is a valuable genetic model to study CD4 T cell anergy.
We studied TCR signaling in naive CD25− W131AOTII CD4 T cells by assessing induced phosphorylation of important TCR downstream molecules in response to anti-CD3 stimulation and compared their responses to their OTII counterparts. Strong reduction in protein tyrosine phosphorylation occurred in TCR-stimulated W131AOTII CD4 T cells compared with OTII T cells (Fig. 1 H). Naive W131AOTII CD4 T cells displayed multiple defects in proximal TCR signaling, including diminished phosphorylation of LAT (linker for activation of T cells), PLCγ1, Vav, PI3K, Akt, and ERK compared with control OTII T cells (Fig. 1 I; and Fig. S1, A and B). The strong reduction of proximal TCR signaling in W131AOTII T cells did not appear to be due to changes in protein expression of TCR downstream pathway signaling molecules, such as PLCγ1, and PI3K (Fig. 1 I). Nor was this due to increases in the protein expression of the lipid phosphatases PTEN (phosphatase and tensin homolog) or SHIP1 (Fig. 1 I). Phosphorylation of SHIP1 was even reduced in naive W131AOTII CD4 T cells (Fig. 1 I). Thus, naive W131AOTII T cells exhibited markedly impaired TCR-induced signaling and production of IL-2 or up-regulation of CD69, CD25, and Nur77 as well as proliferative responses after antigen or anti-CD3 stimulation.
Figure S1.
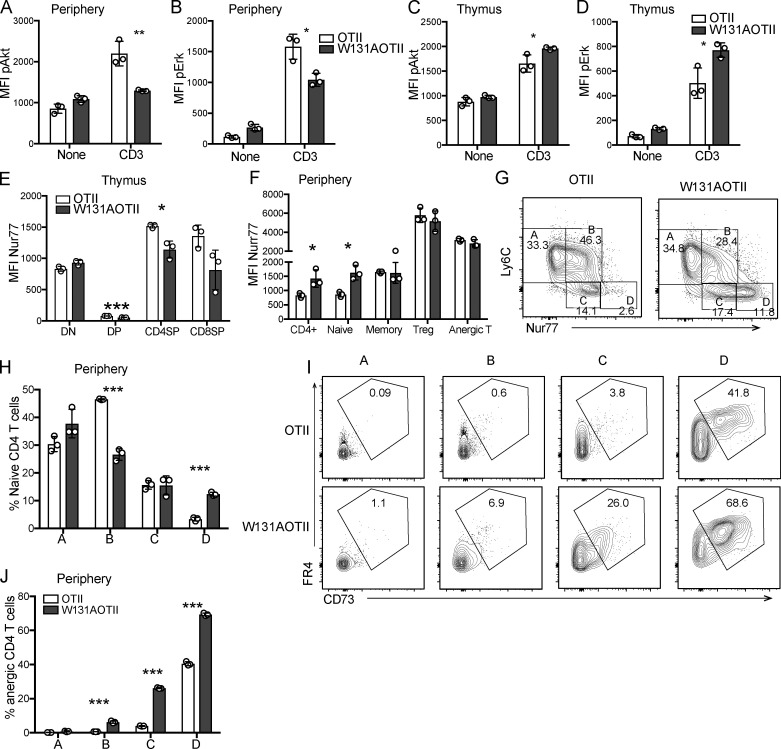
Increased basal TCR signals, as evidenced by enhanced Nur77-GFP expression in W131AOTII, correlated with increased numbers of anergic T cells. Flow cytometry–based assessment of MFI of AKT phosphorylation and ERK phosphorylation levels of peripheral naive or CD4SP thymocytes stimulated with anti-CD3 (1 µg/ml) followed by cross-linking with anti–Armenian hamster IgG (20 µg/ml) for 2 min (n = 3 mice/group). (A and B) MFI of AKT phosphorylation (A) and ERK phosphorylation (B) relative amounts in stimulated peripheral naive OTII and W131AOTII T cells. (C and D) MFI of AKT phosphorylation (C) and ERK phosphorylation (D) levels in stimulated Vα2+CD4SP thymocytes. (E and F) Quantification of MFI of Nur77-GFP in thymic T cell subsets (E; double-negative [DN], DP, CD4SP, and CD8SP) and peripheral T cell subsets (F) from OTII and W131AOTII mice (n = 3 mice/group). (G) Contour plots show the gating scheme for populations A to D, based on Nur77-GFP and Ly6C expression in peripheral naive T cells. (H) Bar graphs show the percentages of populations A to D in peripheral naive T cells. (I) Contour plots depict anergic T cells (FR4+CD73+) from populations A to D. (J) Bar graphs show the percentage of anergic T cells from populations A to D. Data are representative of two independent experiments. Two-tailed Student’s t test was performed. *, P < 0.05; **, P < 0.005; ***, P < 0.0005.
We previously reported that the reduction of CD4 single-positive (SP) thymocytes in W131AOTII mice was associated with their increased propensity to undergo apoptosis, and the reduced number of SP CD4 thymocytes could be partially rescued by the expression of the Bcl2 transgene (Hsu et al., 2017). We sought to confirm that the W131A mutation might mediate some degree of increased negative selection due to some endogenous self-pMHC reactivity during thymocyte development in the OTII transgenic background. Analysis of negative selection by activated caspase 3 staining in TCRβ+CD5+ cells (Breed et al., 2019) revealed an approximately threefold increase in the frequency of activated caspase 3+ thymocytes in W131AOTII compared with OTII mice (Fig. 1, J and K). This correlated well with a threefold reduction in the numbers of CD4SP thymocytes in W131AOTII relative to OTII mice (Fig. 1 L). Therefore, increased negative selection seems to account for reduction in mature CD4SP thymocytes in W131AOTII mice compared with OTII mice.
The diminished TCR-dependent responses of naive W131AOTII CD4 T cells suggested that the CD4SP thymocytes might also be hyporesponsive. However, the CD4SP thymocytes from W131AOTII mice exhibited similar or even higher up-regulation of CD25, CD69, and IL-2 production in response to antigen or TCR stimulation compared with OTII cells (Fig. 1, M–O). Similarly, W131AOTII CD4SP thymocytes also exhibited comparable proliferative responses and up-regulation of Nur77-GFP with those of OTII CD4SP thymocytes (Fig. 1, P–R). Therefore, CD4SP thymocytes that escaped negative selection in W131AOTII mice had not become anergic.
Immunoblots of lysates and flow cytometry revealed comparable amounts of signaling proteins and phosphorylation of TCR-induced downstream signaling components following TCR stimulation when comparing OTII and W131AOTII CD4SP thymocytes (Fig. 1, S and T; and Fig. S1, C and D). Phosphorylation of the phosphatase SHIP1 and the total protein of PLCγ, PI3K, phosphatase SHIP1, and PTEN were comparable between OTII and W131AOTII mice (Fig. 1 T). These results demonstrate that TCR signaling was maintained at normal levels in mature CD4SP thymocytes but was strongly reduced in peripheral CD4 T cells in W131AOTII mice. Thus, functional anergy to self-antigens is acquired in the periphery even though a self-pMHC appears present and capable of inducing increased negative selection in the thymus.
T cell anergy in W131AOTII mice is dependent on antigen presentation in their periphery
In contrast to SP CD4 thymocytes in W131AOTII mice, which showed a slight decrease in Nur77-GFP expression, peripheral naive W131AOTII CD4 T cells exhibited 1.5-fold higher Nur77-GFP expression compared with those in OTII mice (Fig. S1, E and F). The higher expression of Nur77-GFP suggests increased TCR signaling, perhaps in response to encounter with a relatively high-affinity self-pMHC ligand in the periphery superimposed on the W131A hypermorphic mutant. Increased TCR signaling in W131AOTII CD4 T cells could lead to feedback mechanisms leading to T cell unresponsiveness in periphery.
Using Nur77-GFP and Ly6C, a previous study identified four populations, designated A, B, C, and D, in naive CD4 T cells that reflect different degrees of signaling under antigen-free homeostatic conditions, presumed to result from encounter with self-pMHC (Zinzow-Kramer et al., 2019). Population D (Ly6Clow Nur77hi) showed the strongest basal TCR signaling and contained the largest population of anergic T cells (Zinzow-Kramer et al., 2019). Naive W131AOTII CD4 T cells showed a decreased population B but a marked increase of population D when compared with OTII T cells (Fig. S1, G and H). Importantly, W131AOTII T cells had much higher frequencies of anergic T cells in both populations C and D compared with OTII T cells (Fig. S1, I and J). This suggests that increased basal TCR signals as evidenced by enhanced Nur77-GFP expression in W131AOTII correlates with increased numbers of anergic T cells. Therefore, W131AOTII T cells experience stronger relative basal TCR signals and, perhaps as an adaptive response, attenuate their TCR agonist-induced responses.
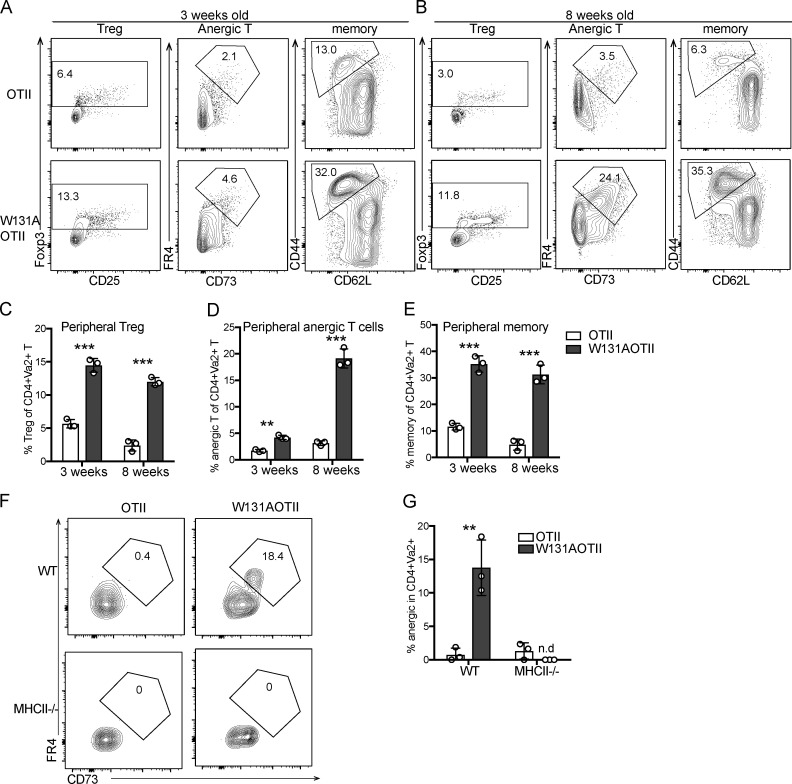
Normal TCR signaling in mature CD4SP thymocytes suggested that newly generated CD4 T cells from the thymus may not be anergic. Consistent with this notion, in contrast to large increases in the frequencies of anergic CD4 T cells observed in adult W131AOTII mice by 8 wk of age, 3-wk-old W131AOTII mice had small increases in anergic CD4 T cells when compared with OTII mice (Fig. 2, A–E). In contrast, frequencies of T reg and memory T cells were already markedly increased in both young and adult W131AOTII mice compared with OTII mice (Fig. 2, A–E). Therefore, it appears that anergic T cells accumulated over time as W131AOTII mice age, and the pathways generating memory T cells and T reg cells may be operative before T cells become anergic. These data also further support the notion that conventional naive TCR transgenic OTII cells are precursors of anergic T cells and studying W131AOTII naive T cells may help us understand early events resulting in the development of T cell anergy.
Figure 2.
Age-dependent T cell anergy in W131AOTII mice is dependent on antigen presentation in their periphery. (A and B) Flow cytometry of peripheral CD4+Vα2+ T cells to identify T reg cells (Foxp3+), anergic T cells (Foxp3−FR4+CD73+), and memory T cells (CD44+CD62L−) in (A) 3-wk-old and (B) 8-wk-old mice (n = 3 mice/group). (C–E) Bar graphs depict the frequencies of peripheral T reg cells (C), anergic T cells (D), and memory T cells (E) of Vα2+CD4+ T cells. (F and G) Peripheral naive CD25− T cells from OTII and W131AOTII mice were labeled with CTV and transferred into WT or MHC class II–deficient (MHCII−/−) hosts for 10 d. (F) Contour plots show frequencies of anergic T cells in donor cells after transfer. Numbers indicate the percentages of events within each gate. (G) Bar graphs show the percentages of anergic T cells of donor cells after transfer (n = 3 mice/group). Data are representative of three independent experiments (A–E) and two independent experiments (F and G). Two-tailed Student’s t test was performed. **, P < 0.005; ***, P < 0.0005. n.d., not detectable.
To determine whether the maintenance of anergic T cells depends on continuous antigen presentation, we transferred peripheral naive T cells from W131AOTII or OTII into WT or MHC-II−/− mice. Whereas the anergic W131AOTII T cells were still readily detectable 10 d after adoptive transfer into WT mice, the anergic W131AOTII T cells were difficult to detect 10 d after adoptive transfer into MHCII−/− mice (Fig. 2, F and G). Since naive OTII T cells contained very few anergic T cells, anergic T cells from OTII T cells were undetectable after adoptive transfer into WT and MHCII−/− mice (Fig. 2, F and G). In summary, the maintenance, generation, or survival of new anergic T cells in W131AOTII mice appears to be dependent on ongoing antigen presentation by class II MHC molecules.
Gene signatures characteristic of unresponsive cells were strongly enriched in peripheral W131AOTII CD4 T cells but not in CD4SP thymocytes
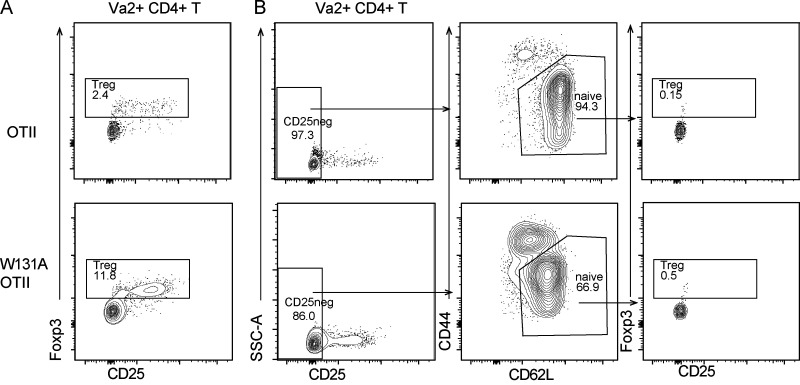
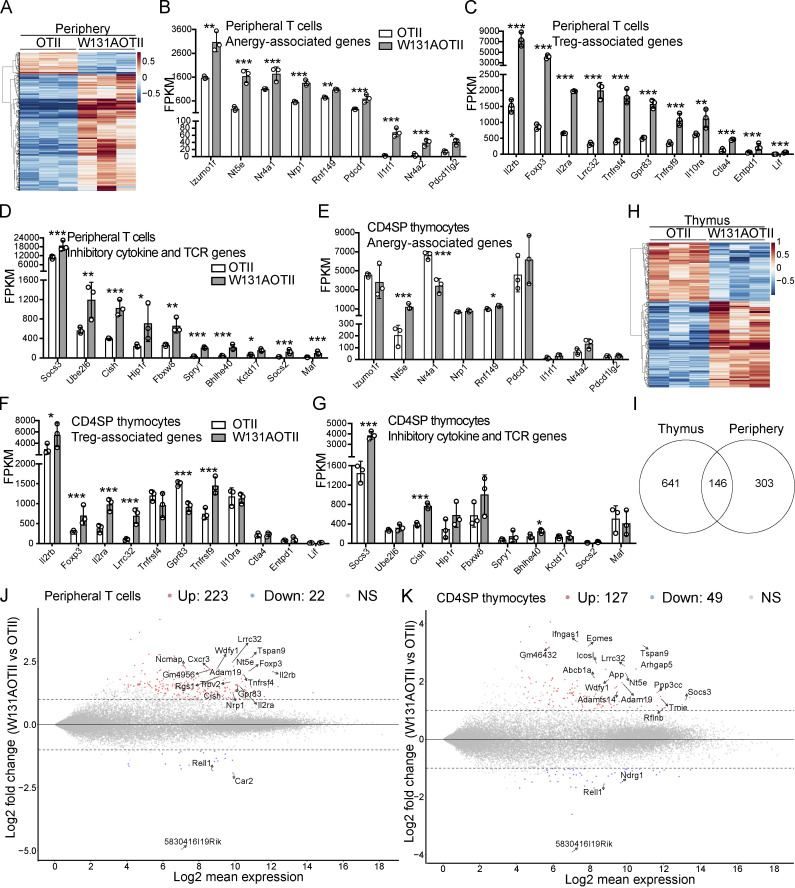
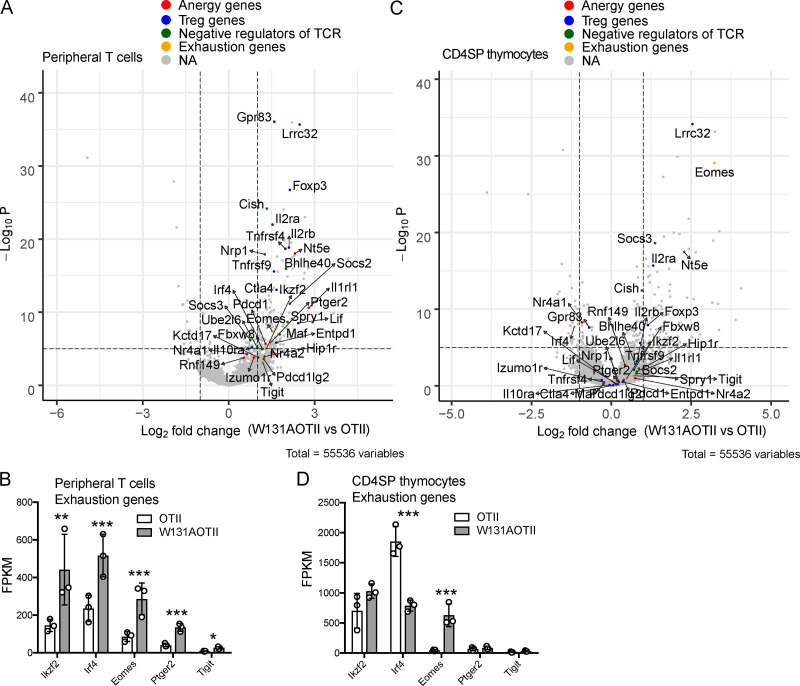
RNA sequencing was performed to assess gene expression in peripheral naive CD25− transgenic (Vα2+) CD4 T cells depleted of T reg (Foxp3+) cells (Fig. S2, A and B) to identify unique tolerance gene signatures and signaling pathway genes that were different between W131AOTII and OTII mice. A total of 449 genes were uniquely expressed in naive CD25−Vα2+ CD4 T cells from W131AOTII mice compared with those from OTII mice (Fig. 3 A and Table S1). Anergy-related genes (Izumo1r [FR4], Nt5e [CD73], Nr4a1 [Nur77], Nrp1, Rnf149, Wdfy1, pdcd1 [PD-1], Il1rl1 [ST2], Nr4a2,and Pdcd1lg2), T reg cell–related genes (Il2rβ, Foxp3, Il2rα, Tnfrsf4 [PX40], Lrrc32, Gpr83, Tnfrsf9 [4-1BB], Il10ra, Ctla4, and EntPD-1 [CD39]), and inhibitory genes influencing cytokine and TCR signaling (Socs3, Golm1, Ube2l6, Cish, Fbxw8, Spry1, Bhlhe40, Kctd17, Sosc2, and Maf) were greatly up-regulated in naive CD25−Vα2+ CD4 T cells from W131AOTII mice compared with those from OTII mice (Fig. 3, B–D; and Fig. S3 A). The IL-33 receptor ST2 (Il1rl1) was reported to be important for the development of T cell anergy in nonlymphoid tissues of Aire-deficient mice (Tuncel et al., 2019). We compared our list of differentially expressed (DE) genes of W131AOTII naive CD4 T cells with two previous studies analyzing anergy in human peripheral CD8 T cells (Maeda et al., 2014; Yu et al., 2015). Among the 12 genes that were significantly different between anergic and control T cells identified by Yu et al. (2015), 4 of these 12 genes, including Il2rα, Il2rβ, IL21r, and Il10rα, were also present in our list of DE genes of W131AOTII versus OTII naive CD4 T cells. Among four DE genes in human anergic T cells identified by Maeda et al. (2014), Ctla4 is present in our list of DE genes of W131AOTII T cells. Some T cell exhaustion–related genes (Ikzf2, Irf4, Eomes2, Ptger2, and Tigit) were slightly up-regulated in the naive CD25−Vα2+ W131AOTII CD4 T cells (Fig. S3 B).
Figure S2.
Peripheral CD25− naive (CD44lowCD62L+) Vα2+ CD4 T cells contained very few T reg cells. (A) Flow cytometry of peripheral CD4+Vα2+ T cells stained for Foxp3 and CD25 expression to identify T reg cells (Foxp3+). (B) Gating strategy for sorting peripheral CD25− naive (CD44lowCD62L+) Vα2+ CD4 T cells contained very few T reg cells (Foxp3+). Data are representative of two independent experiments. SSC-A, side scatter.
Figure 3.
In contrast to CD4SP thymocytes, tolerance-associated gene signatures were strongly enriched in peripheral W131AOTII T cells. (A) RNA sequencing revealed heatmap analysis of gene expression in peripheral naive (CD44lowCD62L+) CD25−Vα2+ CD4 T cells (n = 3–12 mice/group). (B–D) RNA sequencing revealed expression of anergy-associated genes (B), T reg cell–associated genes (C), and inhibitory genes (D) influencing cytokines and TCR signaling in peripheral naive CD25−Vα2+CD4+ T cells from OTII and W131AOTII mice. (E–G) Expression of anergy-associated genes (E), T reg cell–associated genes (F), and inhibitory genes (G) influencing cytokines and TCR signaling in CD25−Vα2+ CD4SP thymocytes from OTII versus W131AOTII mice. The expression values were normalized by fragments per kilobase of transcript per million reads (FPKM). (H) RNA seqequencing revealed heatmap analysis of gene expression in CD25−Vα2+ CD4SP thymocytes from OTII versus W131AOTII mice. (I) Venn diagram showing the total number of DE genes between W131AOTII and OTII T cells in transgenic CD4SP thymocytes and peripheral naive CD25− CD4 T cells. (J and K) MA plot revealed top genes whose expression was highly expressed and DE in peripheral W131AOTII T cells (J) and W131AOTII CD4SP thymocytes (K) compared with those from OTII mice. FDR-corrected *, P < 0.05; **, P < 0.005; ***, P < 0.0005.
Figure S3.
In contrast to CD4SP thymocytes, tolerized gene signatures were strongly enriched in peripheral W131AOTII T cells. (A) Volcano plot revealed expression of anergy-associated genes, T reg cell–associated genes, inhibitory genes influencing cytokines and TCR signaling, and exhausted genes in peripheral naive CD25−Vα2+CD4+ T cells from W131AOTII compared with those cells from OTII mice (n = 3–12 mice/group). (B) RNA sequencing revealed expression of exhausted genes in peripheral naive CD25−Vα2+CD4+ T cells. (C) Volcano plot revealed expression of anergy-associated genes, T reg cell–associated genes, inhibitory genes influencing cytokines and TCR signaling, and exhausted genes in CD25−Vα2+CD4SP thymocytes from W131AOTII compared with those cells from OTII mice. NA, not applicable. (D) RNA sequencing revealed expression of exhausted genes in CD25−Vα2+ CD4SP thymocytes from OTII versus W131AOTII mice. The expression values were normalized by fragments per kilobase of transcript per million reads (FPKM) of W131AOTII T cells versus OTII T cells. FDR-corrected *, P < 0.05; **, P < 0.005; ***, P < 0.0005.
Interestingly, CD4SP thymocytes from W131AOTII mice showed fewer differences in these anergy-related, T reg cell–related genes, inhibitory genes influencing cytokine and TCR signaling, and T cell exhaustion–related genes (Fig. 3, E–G; and Fig. S3, C and D). In contrast to naive W131AOTII CD4 T cells, W131AOTII thymocytes displayed decreased expression of Nr4a1, Gpr83, and Irf4, but increased expression of Nt5e, CISH (a suppressor of cytokine signaling [SOCS] family member; Fig. 3, E–G; and Fig. S3, C and D). W131AOTII thymocytes also displayed increases of many T reg cell–associated genes, consistent with the increase in T reg cells seen in the W131AOTII thymocytes (Fig. 3, E–G; and Fig. S3, C and D). Furthermore, the gene expression of Nr4a1 in W131AOTII mice was consistent with elevated Nur77-GFP expression (Fig. S1, E and F). 787 genes were DE in CD4SP thymocytes from W131AOTII mice compared with CD4SP cells from OTII mice (Fig. 3, H and I; and Table S2). Among these genes, only 146 genes (18.6%) were also differentially differentiated in the naive W131AOTII CD4 T cells (Fig. 3 I). Among the top 20 genes, 7 (Lrrc32, Nt5e, Tspan9, Adam19, Wdfy1, Rell1, and 5830416l19Rik) were DE in both naive CD4 T cells and CD4SP thymocytes from W131AOTII mice compared with those from OTII mice (Fig. 3, J and K). Importantly, most of the top 20 DE genes in peripheral T cells were anergy-related genes, T reg cell–related genes, or inhibitory genes influencing cytokine genes and TCR signaling (Fig. 3 J). In summary, the RNA-sequencing results generally support the notion that T cell anergy in W131AOTII mice is not acquired in the thymus, but in the periphery.
Deletion of Cbl-b, Grail, or PD-1 in W131AOTII mice did not rescue anergic phenotypes in W131AOTII mice
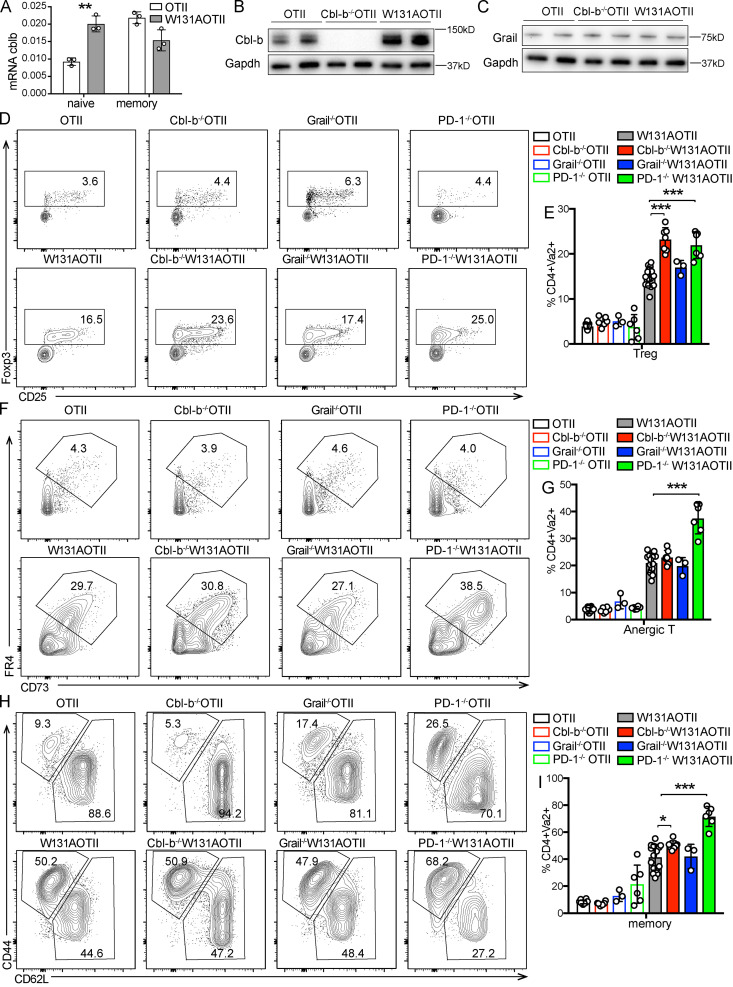
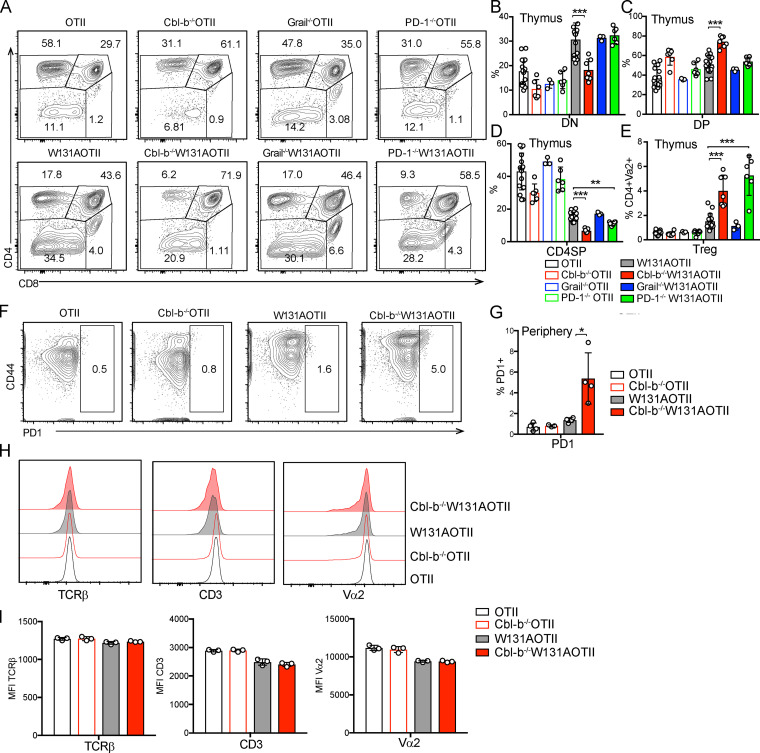
The inhibitory receptor PD-1 and the E3 ubiquitin ligases Cbl-b and Grail are highly expressed in anergic T cells and have been implicated in establishing the unresponsive state (Fathman and Lineberry, 2007; Lutz-Nicoladoni et al., 2015; Mueller, 2004). Naive W131AOTII T cells had increased Cbl-b mRNA and protein expression compared with OTII T cells (Fig. 4, A and B). Although we previously detected increased Grail mRNA expression in W131AOTII T cells (Hsu et al., 2017), the Grail protein amount was not expressed differentially in peripheral naive OTII and W131AOTII CD4 T cells (Fig. 4 C). To determine whether deletion of Cbl-b, Grail, or PD-1 could overcome or prevent the development of anergic T cells in W131AOTII mice, we generated Cbl-b−/−W131AOTII, Grail−/−W131AOTII, and PD-1−/−W131AOTII mice. Deletion of Cbl-b, Grail, or PD-1 did not restore normal T cell development in W131AOTII mice (Fig. S4, A–D). In fact, Cbl-b−/−W131AOTII and PD-1−/−W131AOTII mice even exhibited reduced frequencies of CD4SP thymocytes and increased frequencies of thymic T reg cells compared with W131AOTII mice (Fig. S4, D and E). Notably, Cbl-b−/−W131AOTII, Grail−/−W131AOTII, or PD-1 −/−W131AOTII mice did not exhibit any evidence of rescue of anergic T cells, T reg cells, and memory CD4 T cells compared with W131AOTII mice (Fig. 4, D–I). Deletion of Cbl-b or PD-1 even resulted in increased frequencies of peripheral T reg cells in W131AOTII mice (Fig. 4, D and E). Furthermore, deletion of PD-1 resulted in increased frequencies of peripheral anergic T cells and memory T cells in W131AOTII mice (Fig. 4, F–I). These results suggest that there may be multiple compensatory mechanisms to establish and/or maintain anergic T cells. For example, deletion of Cbl-b led to increased W131AOTII T cells that expressed PD-1 (Fig. S4, F and G). Cbl-b deficiency did not increase TCRβ/CD3/Vα2 expression of naive Va2+ CD4 T cells (Fig. S4, H and I). In summary, deletion of Cbl-b, Grail, or PD-1 in W131AOTII mice did not rescue anergic CD4 T cell phenotypes in W131AOTII mice.
Figure 4.
Deletion of Cbl-b, Grail, or PD-1 in W131AOTII mice did not rescue anergic phenotypes in W131AOTII mice. (A) Relative expression of Cbl-b mRNA in naive and memory Vα2+ CD4 T cells from indicated mice (n = 3 mice/group). (B and C) Immunoblot analysis of Cbl-b (B) and Grail (C) on peripheral CD25− naive OTII and W131AOTII T cells (n = 4–8 mice/group). (D) Flow cytometry of peripheral CD4+Vα2+ T cells to identify T reg cells (Foxp3+). (E) Bar graph depicts the frequencies of peripheral T reg cells of Vα2+CD4+ T cells. (F) Flow cytometry of peripheral CD4+Vα2+Foxp3− T cells to identify anergic T cells (Foxp3−FR4+CD73+). (G) Bar graph shows the frequencies of peripheral anergic T cells of CD4+Vα2+ T cells. (H) Flow cytometry of peripheral CD4+Vα2+ T cells stained for CD44 and CD62L expression. (I) Bar chart shows the frequencies of peripheral memory T cells (CD44+CD62L−) of Va2+CD4+ T cells. Data are representative of three independent experiments (A–C) and combined from five independent experiments (n = 3–17 mice/group). Two-tailed Student’s t test was performed. *, P < 0.05; **, P < 0.005; ***, P < 0.0005.
Figure S4.
Deletion of Cbl-b, Grail, or PD-1 in W131AOTII mice did not rescue anergic phenotypes in W131AOTII mice. (A) Representative plots showing expression of CD4 and CD8 in total thymocytes from indicated mice. (B–D) Bar graphs show frequencies of double-negative (B; DN), DP (C), and CD4SP thymocytes (D) in indicated mice. (E) Bar graph shows the frequencies of thymic T reg cells (Foxp3+) of Vα2+ CD4SP thymocytes. (F) FACS plots showing PD-1 staining in peripheral Vα2+ CD4 T cells from OTII and W131AOTII mice. (G) MFI of PD-1 expression. (H) Histograms comparing expression of TCRβ, CD3, and Vα2 in peripheral naive Vα2+CD4+ T cells from indicated mice. (I) Bar graphs indicating MFI ± SD for TCRβ, CD3, and Vα2 in peripheral naive Vα2+CD4+ T cells from indicated mice. Data in A–E are combined from five independent experiments (n = 3–17 mice/group). Data in F–I are presentative of two independent experiments (n = 3 or 4 mice/group). Two-tailed Student’s t test was performed. *, P < 0.05; **, P < 0.005; ***, P < 0.0005.
Loss of Cbl-b, but not PD-1 or Grail, in W131AOTII mice restores peripheral T cell responsiveness to antigen and anti-TCR stimuli
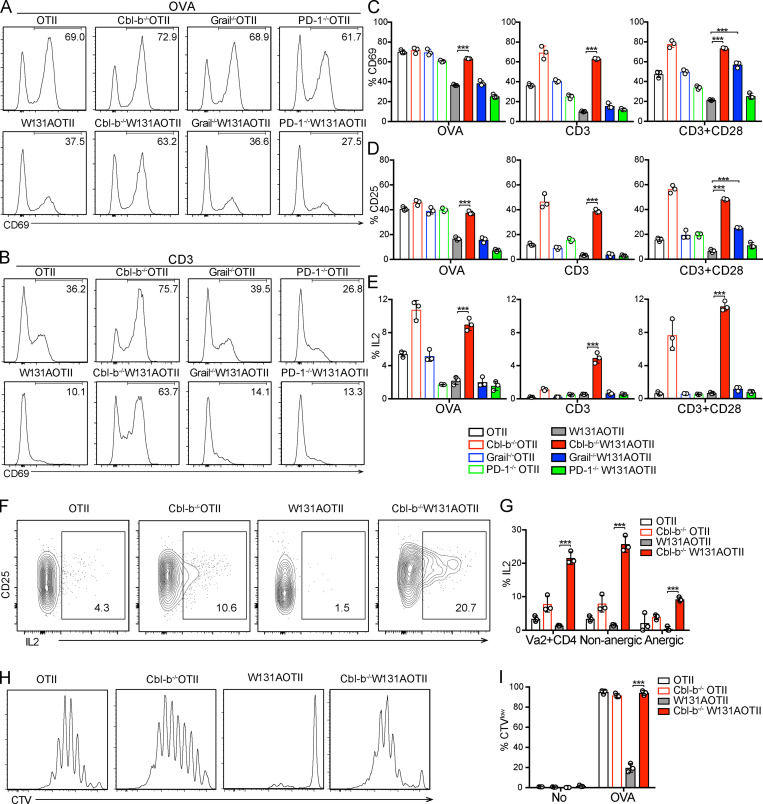
Despite preservation of the anergic cell surface markers, we determined whether deletion of Cbl-b, Grail, or PD-1 could overcome T cell unresponsiveness in W131AOTII mice. In contrast to impaired T cell responses observed in peripheral W131AOTII CD4 T cells, loss of Cbl-b in W131AOTII mice rescued peripheral T cell responsiveness to antigen or TCR stimuli, including up-regulation of CD69, CD25, and the proportion of IL-2 secreting CD4 T cells (Fig. 5, A–E). Cbl-b−/−W131AOTII T cells were hyperresponsive to TCR stimulation and had higher responses than even OTII T cells (Fig. 5, A–E). In contrast, loss of PD-1 in W131AOTII mice did not rescue T cell responsiveness to antigen or TCR stimulation (Fig. 5, A–E). Interestingly, Grail deficiency in W131AOTII mice resulted in increases in CD69, CD25 up-regulation in response to anti-CD3 and anti-CD28 stimulation (Fig. 5, A–E). However, deletion of Grail did not rescue T cell responsiveness to OVA or anti-CD3 stimulation alone (Fig. 5, A–E). This could reflect enhanced CD28 signaling pathways in Grail−/−W131AOTII mice exposed to the high-affinity anti-CD28 antibody as opposed to the physiological ligand in APC-containing cultures.
Figure 5.
Loss of Cbl-b, but not PD-1 or Grail, in W131AOTII mice prevents peripheral T cell unresponsiveness to antigen and TCR stimulation. (A–J) Peripheral naive CD25− CD4 T cells from age-matched mice (n = 3 mice/group) were cultured in vitro with TCRα−/− splenocytes plus 0.1 µM OVA peptide, or plate-bound anti-CD3 (0.3 µg/ml) with or without anti-CD28 (2 µg/ml). (A and B) Histograms comparing CD69 up-regulation after 16 h culture with OVA (A) or anti-CD3 (B) stimulation. (C–E) Bar graphs indicating mean frequencies ± SD for CD69+ (C), CD25+ (D), or IL2+ of Vα2+ CD4 T cells (E). (F) Flow cytometry of peripheral Vα2+ CD4 T cells stained for CD25 and IL2 after 16 h culture with anti-CD3 plus anti-CD28. (G) Frequencies of IL2+ of Vα2+ CD4 T cells and nonanergic and anergic T cells after 16 h culture with anti-CD3 plus anti-CD28. (H and I) Proliferative responses of peripheral naive CD25− CD4 T cells loaded with CTV dye after culture with TCRα−/− splenocytes plus 0.1 µM OVA peptide for 4 d. (H) Dilution of CTV of Vα2+ CD4 T cells by flow cytometry. (I) Frequencies of proliferating cells (CTVlow). Data are representative of three independent experiments. Two-tailed Student’s t test was performed. ***, P < 0.0005.
We examined whether loss of Cbl-b could rescue IL-2 production in anergic T cells in W131AOTII mice. Indeed, deletion of Cbl-b greatly increased IL-2 production in both nonanergic and anergic T cells in W131AOTII compared with OTII T cells (Fig. 5, F and G). Consistent with the increased IL-2 production, proliferative responses to peptide stimulation were comparable among OTII cells, Cbl-b−/−OTII, and Cbl-b−/−W131AOTII, whereas W131AOTII T cells exhibited significantly reduced T cell proliferation (Fig. 5, H and I). Thus, although Cbl-b deficiency did not prevent the expression of phenotypic markers (CD73+FR4+) of anergy on the W131AOTII T cells, it did enhance functional responses to TCR stimulation of anergic T cells. Together, these results reveal an essential role for Cbl-b in the regulation of peripheral tolerance and T cell anergy.
Loss of Cbl-b in W131AOTII mice altered gene expression profiles associated with improved T cell responsiveness
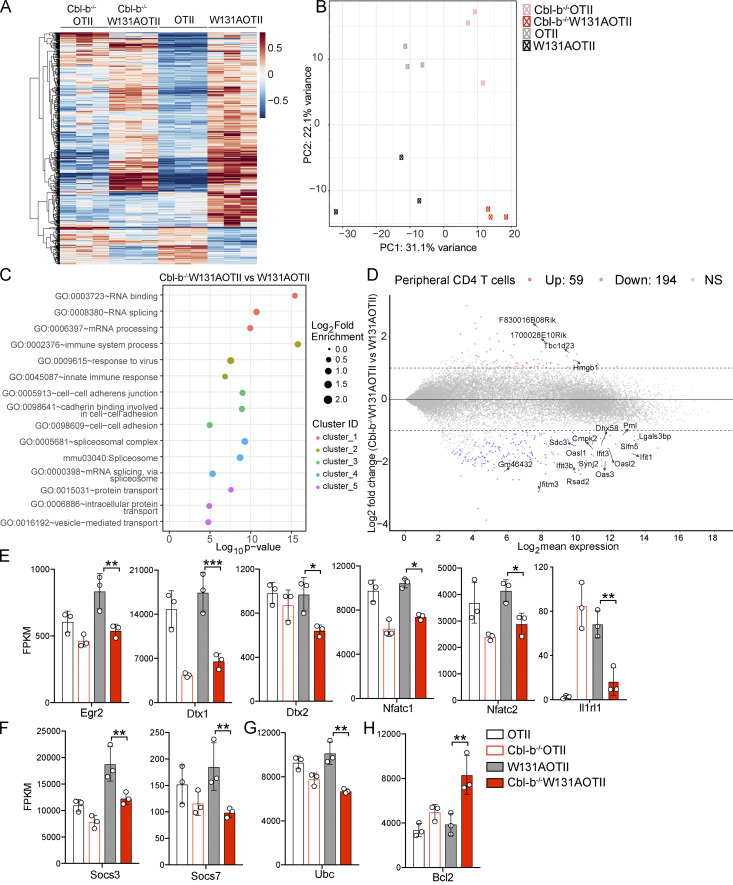
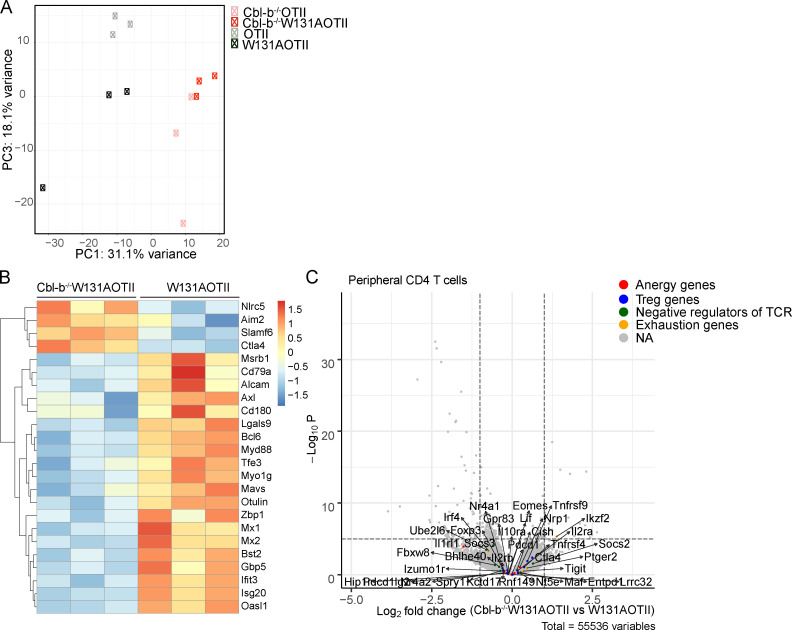
We performed gene expression analysis of naive CD25−Vα2+ CD4 T cells isolated from OTII, Cbl-b−/−OTII, W131AOTII, and Cbl-b−/−W131AOTII mice to investigate the possible downstream signaling pathways that Cbl-b influences and related these changes to T cell responsiveness. Expression of a total of 2,226 genes was significantly altered in naive Cbl-b−/−W131AOTII T cells compared with W131AOTII naive T cells (Fig. 6, A and B; and Table S3). Analysis of principal component 1 accounting for the most variance (31%) and the numbers of DE genes suggested that Cbl-b−/−W131AOTII T cells showed a more similar transcription expression to Cbl-b−/−OTII than to W131AOTII T cells (Fig. 6, A and B; Fig. S5 A; and Table S3). Signaling pathways enriched in Cbl-b−/−W131AOTII T cells compared with W131AOTII T cells included RNA binding/processes, immune system processes, responses to virus, innate responses, cell–cell adhesion, spliceosome, and protein transport (Fig. 6 C). The immune system process pathway (gene ontology: 0002376) contained 24 genes DE in Cbl-b−/−W131AOTII T cells compared with W131AOTII T cells (Fig. S5 B). The top genes that were mostly differentiated in Cbl-b−/−W131AOTII T cells are genes involved in innate and IFN responses (Fig. 6 D). Even though most of the anergy-related genes up-regulated in peripheral W131AOTII CD4 T cells were not rescued in Cbl-b−/−W131AOTII mice (Fig. S5 C), some anergy-associated genes (Egr2, Dtx1, Dtx2, Nfatc1, Nfatc2,and Il1rl1), suppressor of cytokine signaling genes (Socs3 and Socs7), and ubiquitin-C gene (Ubc) were substantially down-regulated in Cbl-b−/−W131AOTII T cells (Fig. 6, E–G). Furthermore, the expression of the anti-apoptotic Bcl2 gene was up-regulated in Cbl-b−/−W131AOTII T cells compared with W131AOTII T cells (Fig. 6 H). In summary, deletion of Cbl-b resulted in distinct transcriptional profiles that might contribute to the improvement of T cell responsiveness on the W131AOTII background.
Figure 6.
Loss of Cbl-b in W131AOTII mice significantly altered gene expression profile. (A) RNA sequencing revealed heatmap analysis of gene expression of peripheral naive (CD44low CD62L+) CD25−Vα2+ CD4 T cells (n = 3–12 mice/group). (B) Principal component analysis of CD25−Vα2+ peripheral naive CD4 T cells from the indicated mouse strains. (C) Top five signaling pathways enriched in peripheral naive Cbl-b−/−W131AOTII T cells compared with W131AOTII T cells. (D) MA plot revealed the top 20 genes whose expressions were highly differentiated in peripheral Cbl-b−/−W131AOTII compared with those from W131AOTII mice. (E–H) RNA sequencing revealed gene expression of anergy-associated genes (E), Socs genes (F), Ubc (G), and anti-apoptotic Bcl2 (H) in peripheral naive CD25−Vα2+CD4+ from the indicated mice. The expression values were normalized by fragments per kilobase of transcript per million reads (FPKM). FDR-corrected *, P < 0.05; **, P < 0.005; ***, P < 0.0005. GO, gene ontology; ID, identification.
Figure S5.
Loss of Cbl-b in W131AOTII mice altered gene expression profile. (A) Principal component analysis with principal component 1 (PC1) and PC3 of CD25−Vα2+ peripheral naive CD4 T cells from the indicated mouse strains (n = 3–12 mice/group). (B) Expression of genes that belong to gene ontology: 0002376–immune system process pathway in peripheral naive CD25−Vα2+CD4+ T cells from Cbl-b−/−W131AOTII mice was compared with those cells from W131AOTII mice. (C) Volcano plot revealed expression of anergy-associated genes, T reg cell–associated genes, inhibitory genes influencing cytokines and TCR signaling, and exhaustion genes in peripheral naive CD25−Vα2+CD4+ T cells from Cbl-b−/−W131AOTII mice compared with those cells from W131AOTII mice. NA, not applicable.
Loss of Cbl-b in W131AOTII mice was associated with improved TCR signaling
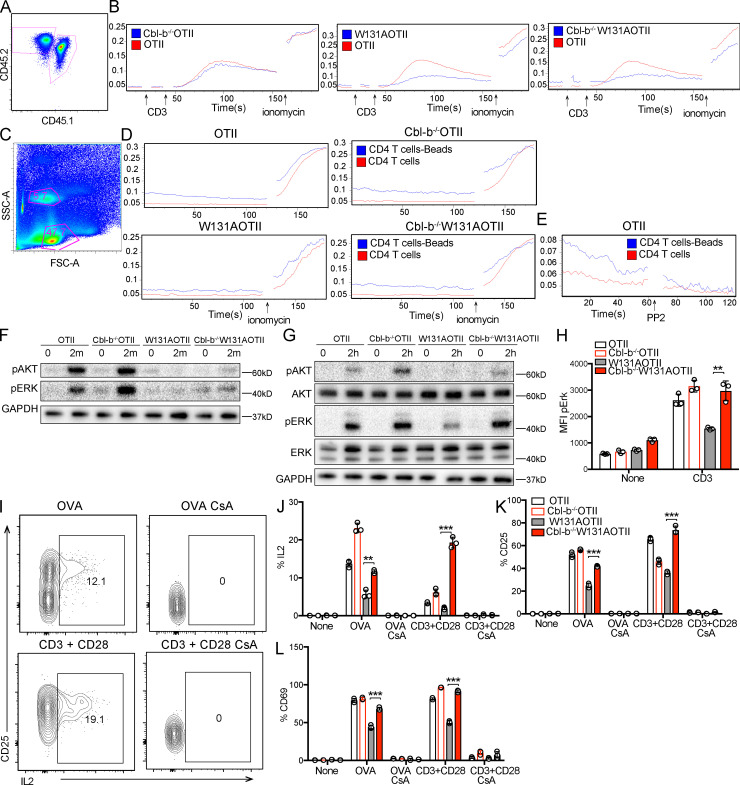
We next determined the impact of Cbl-b deficiency on TCR signaling, focusing first on calcium responses in W131AOTII-naive CD4 T cells. Surprisingly, absence of Cbl-b in these T cells did not rescue the early peak calcium response observed after TCR stimulation (Fig. 7, A and B). However, the baseline calcium in the W131AOTII T cells was elevated, as previously reported (Hsu et al., 2017), and it was even further elevated by the loss of Cbl-b (Fig. 7, A and B). Cellular responses to anti-TCR or antigen stimuli more readily occur when stimuli are presented at surfaces, such as mAbs immobilized on plastic dishes or at cellular interfaces, respectively, and must be maintained for hours to induce cellular responses. To determine whether loss of Cbl-b can rescue a longer-term TCR-induced calcium response that is more consistent with what might be observed in cells stimulated to produce a proliferative or cytokine response, we cultured naive CD4 T cells with anti-CD3 plus anti-CD28 beads for 3 h and compared calcium elevation of stimulated (bead-bound) cells with unstimulated (unbound) cells. Bead-bound cells were distinguished from unbound cells based on higher side scatter (Fig. 7 C). W131AOTII T cells displayed impaired long-term calcium elevation to anti-CD3 and anti-CD28 beads compared with OTII T cells. On the other hand, Cbl-b−/−W131AOTII T cells showed greater long-term calcium elevation when compared with W131AOTII T cells (Fig. 7, C and D). To ensure active TCR signaling was required for the observed elevation of calcium, addition of PP2, a selective Src family kinase inhibitor, led to reduced calcium responses in bead-bound cells, supporting the notion that the calcium elevation in these cells was dependent upon the TCR-dependent signaling pathway (Fig. 7 E). Consistent with the calcium elevation, deletion of Cbl-b in W131AOTII mice did not rescue early TCR proximal signaling, including phosphorylation of AKT and ERK, 2 min after anti-CD3 stimulation (Fig. 7 F), but at least partially rescued these responses after long-term TCR signaling measured 2 h after anti-CD3 stimulation (Fig. 7, G and H). Thus, loss of Cbl-b in W131AOTII mice rescued TCR signaling and calcium responses detectable at 2 and 3 h, respectively, after TCR stimulation with immobilized cross-linked stimuli.
Figure 7.
Loss of Cbl-b in W131AOTII mice rescued calcium responses and TCR signaling. (A) Peripheral T cells were mixed together, identified by congenic markers CD45.1x CD45.2 (OTII) and CD45.2 (Cbl-b−/−W131AOTII or W131AOTII, or Cbl-b−/−W131AOTII), and loaded with Indo-1 to detect intracellular calcium. (B) Cells were stimulated with 10 µg/ml anti-CD3, followed by cross-linking with 20 µg/ml anti–Armenian hamster IgG, and 1 µM ionomycin. (C and D) Peripheral OTII and Cbl-b−/−OTII or W131AOTII or Cbl-b−/−W131AOTII CD4 T cells were culture with anti-CD3/CD28 Dynabeads for 3 h. Cell were loaded with Indo-1 for 30 min to detect intracellular calcium. (C) Flow cytometry shows bead-bound cell binding has higher side scatter (SSC-A) than unbound cells. FSC-A, forward side scatter. (D) Calcium changes in bead-bound and unbound cells. Cells were stimulated with 1 µM ionomycin. (E) Calcium changes in bead-bound and unbound OTII T cells incubated with 10 µM PP2. (F) Immunoblot analysis of AKT and ERK phosphorylation in peripheral naive CD4+ T cells stimulated with anti-CD3 (1 µg/ml) followed by cross-linking with anti–Armenian hamster IgG (20 µg/ml) for 2 min (n = 3–6 mice/group). (G and H) Immunoblot analysis (G) and flow-based assessment (H) of AKT and ERK phosphorylation in peripheral naive CD25−Va2+CD4+ T cells stimulated with plate-bound anti-CD3 (1 µg/ml) for 2 h (n = 3–6 mice/group). (I–L) Peripheral naive CD4+ T cells were cultured with OVA (0.1 µM) with or without cyclosporin A (CsA; 10 µg/ml) or anti-CD3 (0.5 µg/ml) plus anti CD28 (2 µg/ml) with or without CsA (10 µg/ml). (I) Flow cytometry of peripheral CD4+Vα2+ T cells stained for CD25 and IL-2. (J–L) Bar chart indicating mean frequencies ± SD for IL-2+ (J), CD25+ (K), and CD69+ (L) of Vα2+CD4+ T cells (n = 3 mice/group). Data are representative of at least two independent experiments. Two-tailed Student’s t test was performed. **, P < 0.005; ***, P < 0.0005.
TCR stimulation without costimulation triggers the formation of NFAT homomeric complexes without NFAT:AP-1 cooperation and induces a gene expression program associated with T cell anergy (Heissmeyer et al., 2004; Macián et al., 2002). To further validate the importance of physiological calcium-dependent signaling in Cbl-b–deficient cells, we assessed whether the increased responses in Cbl-b−/−W131AOTII T cells depended on NFAT. Treatment with cyclosporin A completely inhibited T cell responses with large reductions in the frequency of IL-2+ cells, as well as up-regulation of CD25 and CD69 in W131AOTII Cbl-b−/− CD4 T cells (Fig. 7, I–L). These results suggest that IL-2 production in these cells still depended on calcium-dependent NFAT signaling. Thus, removing Cbl-b prevented functional T cell anergy by enhancing time-dependent, calcium-dependent responses and TCR signaling.
Discussion
Here we studied a genetically encoded mouse model of T cell anergy (W131AOTII mice) wherein TCR signaling is increased by the Zap70 W131A hypermorphic mutant that disrupts autoinhibition in the setting of a TCR transgene, presumably due to encounter with an unidentified self-pMHC. In the thymus, at the double-positive (DP) stage of development, this led to increased but incomplete negative selection. Our results suggest that anergy was established in the periphery, but not in the thymus, in a time-dependent manner. In contrast to enriched tolerized gene signatures and impaired TCR signaling observed in peripheral CD4 T cells, CD4SP thymocytes from W131AOTII mice exhibited biochemical TCR signaling and gene expression that were comparable to those from the control OTII mice. The maintenance of CD4 T cell anergy or survival of anergic T cells in W131AOTII mice presumably required antigen presentation via MHC-II molecules. Therefore, the anergic state is established and maintained in peripheral T cells in this model.
Recent thymic emigrants (RTEs) differentiate for up to 3 wk before they become mature T cells (Boursalian et al., 2004; Fink, 2013). Consistent with this, and in contrast to large increases of anergic T cells in adult W131AOTII mice, 3-wk-old W131AOTII mice contained small increases in the frequencies of anergic T cells (Fig. 2, A–E). Thus, RTEs probably take at least 3 wk to become mature and/or anergic. Since the adoptively transferred CD4SP thymocytes survived poorly beyond 10 d after transfer, thymic transplantation might be required to investigate when and where W131AOTII RTEs are induced to become anergic.
Our model of anergy takes advantage of a genetically encoded hypermorphic allele that augments signaling by a well-characterized TCR transgene to induce a signal that is too strong when it encounters an unidentified self-pMHC, resulting in partial negative selection in the thymus or anergy of mature T cells in the periphery. This may mimic the events that normally occur with higher-affinity interactions involving self-pMHC and some clonally distributed TCRs of normal mice. Most models of anergy have introduced exogenous antigens or stimuli to induce anergic states. The genes involved in regulating anergy have largely been studied in these artificially induced anergic states. For instance, Grail−/− and Cbl-b−/− T cells were reported to be resistant to in vitro induction of T cell anergy with ionomycin, TGF-β, or T reg cells (Jeon et al., 2004; Kriegel et al., 2009). Furthermore, TCR transgenic Grail−/−, Cbl-b−/−, and PD-1−/− T cells were also resistant to in vivo oral tolerance or peptide-induced anergy (Chikuma et al., 2009; Jeon et al., 2004; Kriegel et al., 2009; Tsushima et al., 2007). In contrast to our genetic model of T cell anergy, those models of T cell anergy depend to some extent on how antigens are delivered to induce anergy and are only short-term anergy models. This may explain why it is easier to reverse T cell anergy in these models and why deletion of Grail or PD-1 is implicated in T cell anergy in these studies but not in our W131AOTII mice. Our results suggest that many compensatory layers of regulation may control T cell anergy in W131AOTII mice, which may be relevant for more physiological anergy induction to self-pMHC.
Even though the genetically encoded W131A anergy model offers the advantage of spontaneous T cell anergy development, there are two potential limitations of this model. First, since Zap70 has been shown to interact with Cbl-b (Lupher et al., 1996), it is possible that Zap70 mutant W131A could affect the interaction with Cbl-b. Second, since the anergy-inducing self-antigen in W131AOTII mice is still unidentified, our understanding of where and how T cell anergy is induced in periphery is limited. Future studies will investigate the potential enrichment of anergic T cells in different tissues and identify the self-antigens inducing anergic T cells in W131AOTII mice.
Interestingly, absence of PD-1, Cbl-b, or Grail did not affect the development of phenotypically identified anergic T cells or T reg cells in W131AOTII mice (Fig. 4, D–I). However, loss of Cbl-b, but not PD1 or Grail, in W131AOTII mice eliminated the T cell unresponsiveness to antigen or anti-CD3 stimulation, including up-regulation of long-term TCR-induced calcium responses, phosphorylation of downstream targets, the activation markers CD69 and CD25, the proportion of IL-2–secreting CD4 T cells, and their proliferation (Fig. 5, A–E). Consistent with this, Cbl-b was strongly up-regulated at 8 h after TCR stimulation (Zhang et al., 2008), suggesting Cbl-b probably has stronger effects in reducing the threshold for T cell activation at later time points after TCR stimulation and may explain the delayed signaling phenotypes seen in the Cbl-b−/−W131AOTII cells.
Cbl-b can interact with and inhibit multiple downstream molecules of TCR and costimulatory CD28 pathways, such as Lck, Vav, Grb2, PI3K, PLC-γ, PKC-δ, and others (Bachmaier et al., 2000; Thien and Langdon, 2005). Cbl-b–dependent ubiquitination targets activated forms of these TCR downstream molecules for degradation either by facilitating their endocytic sorting into lysosomes or by promoting their proteasomal degradation (Lutz-Nicoladoni et al., 2015). In addition to its function as an E3 ubiquitin ligase, Cbl-b binds to other effector molecules such as the tyrosine phosphatases suppressor of T cell signaling 1 (Sts-1) and -2, which could promote dephosphorylation of TCR downstream molecules and thereby negatively regulate downstream signaling (Carpino et al., 2004; Kowanetz et al., 2004). Sts-1 and -2 are recruited through an SH3 domain–mediated interaction with Cbl-b and possibly by binding ubiquitylated proteins through its ubiquitin-associated domain (Feshchenko et al., 2004; Kowanetz et al., 2004). Similar to Cbl-b−/− T cells, double Sts-1/Sts-2 knockout T cells displayed strikingly enhanced TCR signaling (Carpino et al., 2004). Future studies are needed to investigate whether Cbl-b function in anergic T cells is mainly mediated by its E3 ubiquitin ligase effects or by interacting with phosphatases Sts-1 and -2 or other molecules.
Even though antibody-induced blockade of PD-1 partially reversed T cell unresponsiveness in W131AOTII mice (Hsu et al., 2017), germline deletion of PD-1 in W131AOTII mice did not prevent the unresponsiveness (Fig. 5, A–E). Therefore, abrupt inhibition of PD-1 signaling at a homeostatic state may be able to perturb the development rather than the maintenance of the anergic state, but there may be developmentally layered compensatory mechanisms when PD-1 deletion is present throughout development.
In summary, compensatory mechanisms that maintain tolerance in CD4 T cells are strongly regulated in W131AOTII mice. Among these, our studies suggest that Cbl-b plays a dominant role, at least in controlling the functional capacity of anergic T cells. The maintenance of the anergic phenotype, but not function, in Cbl-b–deficient anergic T cells is surprising and deserves further exploration to understand this phenotypic/functional dissociation.
Materials and methods
Mice
Mice 8–12 wk of age, of the strains OTII TCR transgenic, B6.SJLPtprca Pepcb/BoyJ (CD45.1), MHCII−/−, and PD-1−/− (Keir et al., 2007), were purchased from The Jackson Laboratory. Cbl-b−/−, Grail−/−, W131AOTII, and Nur77–enhanced GFP (EGFP) transgenic mice were described previously (Chiang et al., 2000; Hsu et al., 2017; Kriegel et al., 2009; Zikherman et al., 2012). Cbl-b−/−OTII, Grail−/−OTII, PD-1−/−OTII, Cbl-b−/−W131AOTII, Grail−/−W131AOTII, and PD-1−/−W131AOTII mice were generated by crossing Cbl-b−/− with OTII or W131AOTII, respectively. CD45.1xCD45.2 OTII mice were generated by crossing CD45.1 with OTII (CD45.2) mice. OTII-Nur77-EGFP reporter and W131AOTII-Nur77-GFP reporter mice were generated by crossing Nur77-EGFP reporter mice with OTII or W131A mice, respectively. Male mice bearing the Y chromosome–linked OTII TCR transgenes were used in all experiments. All mice were housed in the specific pathogen–free facilities at the University of California, San Francisco, and were treated according to protocols that were approved by the University of California, San Francisco, Animal Care Ethics and Veterinary Committees, and in accordance with National Institutes of Health guidelines.
Flow cytometry
Single-cell suspensions from spleens, lymph nodes, and thymi were incubated with anti-CD16/32 at 5 µg/ml for 20 min on ice to block Fc receptors. Cells were stained with the following antibodies: CD4 PerCP-Cy55, TCRβ PerCp-Cy55, and CD62L APC (TONBO); CD44 FITC, PD-1 PerCP-Cy55, CD69 Cy7PE, CD25 PerCP-Cy55 (Biolegend); CD4 BUV395, and CD8 BUV737 (BD); Vα2 PE (phycoerythrin), Vα2 Pacific Blue, Vα2 FITC, FR4 Cy7PE, and CD73 BV605 (eBioscience); and CD25 BV605 (Life Technology). Dead cells were excluded using the live/dead fixable Near-IR death cell stain kit (Invitrogen). Intracellular Foxp3-FITC staining was done according to the manufacturer’s instructions (Life Technology). For detection of negatively selected thymocytes, caspase 3 PE (BD) was used as previously described (Breed et al., 2019). For intracellular flow cytometry, antibodies against phosphorylated ERKT202/Y204 (mAb 197G2), AKTS473 (Cell Signaling) were used as previously described (Hsu et al., 2009). Antibody against Alexa 647–anti-rabbit IgG was used as a secondary antibody to detect phosphorylation of ERK and AKT.
T cell isolation and in vitro T cell assay
Thymocytes or peripheral CD4+ T cells were negatively enriched by conjugated magnetic beads using biotinylated antibody depletion mixtures and anti-biotin microbeads (Miltenyi Biotec) after Fc blocking with rat serum. For the isolation of CD25− CD4SP thymocytes, cells were stained with biotinylated antibodies to CD8 and CD25. For the isolation of naive CD25− T cells from the periphery, cells were stained with biotinylated antibodies to CD45R, CD11b, CD24, CD8α, CD49b, Ter119, CD19, CD11c, CD44, and CD25. For proliferation assays, the cells were labeled with cell trace violet (CTV; Invitrogen) according to the manufacturer’s instructions. Purified CD25− T cells were cultured with splenocytes from TCRα−/− mice and 0.1 µM OVA peptide, plate-bound anti-CD3 (2C11; 0.3 µg/ml) with or without soluble anti-CD28 (37.51; 2 µg/ml) in medium (RPMI supplemented with L-glutamine/streptomycin and 10% fetal bovine serum) in 96-well round-bottom plates at 37°C in 5% CO2. IL-2–secreting T cells were identified using the IL-2 secretion assay (Miltenyi Biotec) according to the instructions of the manufacturer. Flow cytometry analysis was done to identify CD69+, CD25+, IL-2+, and proliferating cells (CTVlow) among transgenic OTII+(Vα2+) CD4 T cells with anti–CD4-PE, -Vα2-FITC, -IL2-APC, -CD69-Cy7PE, and -CD25-PercpCy55 antibody staining.
Calcium responses
Splenocytes from OTII (CD45.1xCD45.2) and Cbl-b−/−OTII, W131AOTII, or Cbl-b−/−W131AOTII (CD45.2) were surface-stained with anti–CD4-PercpCy55, –Vα2-PE, -CD45.1, and -CD45.2. Magnetic bead negatively purified peripheral CD4+ T cells from OTII, Cbl-b−/−OTII, or W131AOTII, Cbl-b−/−W131AOTII mice were cultured with anti–CD3/-CD28 Dynabeads (Thermo Fisher Scientific) for 3 h at 37°C. Cells were loaded with Indo-1 dye (Invitrogen) for 30 min at 37°C in RPMI supplemented with 5% fetal bovine serum and Hepes. After loading with Indo-1, cells were washed and analyzed by flow cytometry (LSR Fortessa with a UV laser) at 37°C and stimulated with 10 µg/ml of anti-CD3 (2C11), followed by cross-linking with 20 µg/ml goat anti–Armenian hamster IgG, 1 µM ionomycin, or 10 µM PP2. Calcium increase was monitored as the ratio of Indo-1 (blue) and (violet) and displayed as a function of time.
Immunoblot analyses
Vα2+CD25− CD4SP thymocytes or peripheral naive (CD44lowCD62L+) CD25−Vα2+CD4+ T cells were sorted and washed with PBS. Purified primary T cells were washed with RPMI (without serum), resuspended at 106 cells/50 µl RPMI, and allowed to rest for 30 min at 37°C. The cells were left unstimulated or were stimulated with soluble anti-CD3 (2C11; final concentration, 1 µg/ml) and secondary antibody (goat anti–Armenian hamster; final concentration, 20 µg/ml) for 2 min, or stimulated with plate-bound anti-CD3 (2C11, final concentration 1 µg/ml) for 2 h. The cells (106 cells) were quickly centrifuged (10,000 g; 10s), the supernatant was aspirated, and the pelleted cells were lysed by direct addition of 50 µl of 1% NP-40 (containing the phosphatase and protease inhibitors 2 mM NaVO4, 10 mM NaF, 5 mM EDTA, 2 mM PMSF, 10 µg/ml aprotinin, 1 µg/ml pepstatin, and 1 µg/ml leupeptin). The lysates were placed on ice and centrifuged at 13,000 g to pellet cell debris. 6× loading dye was added to the supernatant. Samples were heated in sand at 100°C for 5 min. The supernatants were run on NuPAGE 4–12% Bis-Tris protein gels (Thermo Fisher Scientific) and transferred to polyvinylidene fluoride membranes. Membranes were blocked with tris-buffered saline with Tween 20 buffer containing 3% BSA, then probed with primary antibodies overnight at 4°C or 2 h at room temperature (25°C). Primary antibodies for the following specificities were used: Cbl-b (Proteintech; catalog no. 12781–1-AP), Cbl-b (Cell Signaling; catalog no. D3C12), Zap70 (Cell Signaling; DICIOE), Gapdh (Cell Signaling; 14C10), phosphotyrosine (4G10), Plcγ1 (BD; 610028), Vav (Transduction Lab), STS1 (Abcam; AB34781), Grb2 (Santa Cruz; C23), phosphorylated Plcγ1 Tyr783 (Cell Signaling), Vav (Transduction Lab; rabbit), phosphorylated Vav Tyr160 (R & D), phosphorylated Vav Tyr174 (Abcam), phosphorylated AKT T308 (Cell Signaling; 60 kD; 244F9; #4056), phosphorylated AKT Ser473 (Cell Signaling; 193H12; #4058), phosphorylated LAT Tyr132 (Abcam), phosphorylated LAT Tyr191 (Cell Signaling), phosphorylated SHIP1 Tyr1020 (Cell Signaling; antibody #3941), SHIP1 (Cell Signaling; D1163), phosphorylated PI3 Kinase p85 (Tyr458)/p55 (Tyr199; Cell Signaling; E3U1H; #17366), PI3K-85 (Cell Signaling; #4292), phosphorylated ERK phospho-p44/42 MAPK (ERK1/2, Thr202/Tyr204; Cell Signaling), and PTEN (Cell Signaling; D4.3, mAb #9188). The following day, the blots were rinsed and incubated with HRP-conjugated secondary antibodies. The blots were detected with a chemiluminescent substrate and a Bio-Rad Chemi-Doc Imaging system.
Quantitative RT-PCR
Total RNA from naive and memory CD25−Vα2+CD4+ cells were isolated with RNeasy (Qiagen). Complementary DNA was synthesized using a cDNA synthesis kit (Quantabio) according to the manufacturer’s instructions. Expression of Cbl-b mRNA was measured using a commercial primer/probe set (Mm01343092_m1; Applied Biosystems). Quantitative PCR was performed using a 7900HT Fas Real-Time PCR system (Applied Biosystems) with the following cycles: 50°C for 2 min, 95°C for 10 min, and 40 cycles of 95°C for 15 s and 60°C for 1 min. Relative expression was normalized to B2m.
Total RNA sequencing
CD25−Vα2+ CD4SP thymocytes or peripheral naive (CD44low CD62L+) CD25−Va2+ CD4 T cells were sorted from OTII (n = 3 mice), W131AOTII (n = 12 mice, 4 mice/group), Cbl-b−/− (n = 3 mice), or Cbl-b−/−W131AOTII (n = 6 mice, 2 mice/group) and washed with PBS. Total RNA was isolated from 106 cells per sample using RNeasy (Qiagen) following the manufacturer’s protocol. Libraries were prepared using the Nugen/Nextera XT kit (Illumina), and single-end 50-pb RNA sequencing was performed using a HiSeq 4000 (Illumina). The data have been false discovery rate (FDR)–corrected for multiple testing via the Benjamini–Hochberg procedure (Benjamini and Hochberg, 1995). The data discussed in this publication have been deposited in GEO (Edgar et al., 2002) under accession no. GSE167169.
Statistical analysis
All data are shown as mean ± SD. Statistical analysis was done using an unpaired two-tailed Student’s t test. A P value <0.05 was considered significant. For RNA sequencing, FDR-corrected P was used to evaluate significant differences between different groups (*, P < 0.05; **, P < 0.005; ***, P < 0.0005).
Online supplemental material
Fig. S1 demonstrates the increased basal TCR signals, as evidenced by enhanced Nur77-GFP expression in W131AOTII, correlated with increased numbers of anergic T cells. Fig. S2 shows that peripheral CD25− naive (CD44low CD62L+) Vα2+ CD4 T cells contained very few T reg cells. Fig. S3 shows that tolerized gene signatures were strongly enriched in peripheral W131AOTII T cells. Fig. S4 shows that deletion of Cbl-b, Grail, or PD-1 in W131AOTII mice did not rescue anergic phenotypes in W131AOTII mice. Fig. S5 shows that loss of Cbl-b in W131AOTII mice altered the gene expression profile. Table S1 shows that tolerized gene signatures were strongly enriched in peripheral W131AOTII T cells. Table S2 shows that most tolerized gene signatures were not enriched in W131AOTII CD4SP thymocytes. Table S3 shows that loss of Cbl-b in W131AOTII mice significantly altered gene expression profile associated with improved T cell responsiveness.
Supplementary Material
shows that tolerized gene signatures were strongly enriched in peripheral W131AOTII T cells.
shows that most tolerized gene signatures were not enriched in W131AOTII CD4SP thymocytes.
shows that loss of Cbl-b in W131AOTII mice significantly altered the gene expression profile associated with improved T cell responsiveness.
Acknowledgments
We thank Julie Zikherman, Mark Anderson, and Mark Ansel for valuable comments and suggestions that improved the manuscript.
This research was supported by the Howard Hughes Medical Institute, the National Institutes of Health (2P01AI091580 and R37AI114575 to A. Weiss), the Damon Runyon Cancer Research Foundation Fellowship (DRG-2347-18 to T.T.T. Nguyen), and the Rheumatology Research Foundation Scientist Development Award and K Bridge Award (to L. Shen).
Author contributions: T.T.T. Nguyen and A. Weiss designed experiments, analyzed data, and wrote the manuscript; T.T.T. Nguyen, Z.-E. Wang, and L. Shen performed experiments; T.T.T. Nguyen, A. Schroeder, and W. Eckalbar analyzed RNA-sequencing data; and all authors provided edits to the manuscript.
Data availability
The data that support the findings of this study are available from the corresponding author upon request.
References
- Anandasabapathy, N., Ford G.S., Bloom D., Holness C., Paragas V., Seroogy C., Skrenta H., Hollenhorst M., Fathman C.G., and Soares L.. 2003. GRAIL: an E3 ubiquitin ligase that inhibits cytokine gene transcription is expressed in anergic CD4+ T cells. Immunity. 18:535–547. 10.1016/S1074-7613(03)00084-0 [DOI] [PubMed] [Google Scholar]
- Bachmaier, K., Krawczyk C., Kozieradzki I., Kong Y.Y., Sasaki T., Oliveira-dos-Santos A., Mariathasan S., Bouchard D., Wakeham A., Itie A., et al. 2000. Negative regulation of lymphocyte activation and autoimmunity by the molecular adaptor Cbl-b. Nature. 403:211–216. 10.1038/35003228 [DOI] [PubMed] [Google Scholar]
- Benjamini, Y., and Hochberg Y.. 1995. Controlling the False Discovery Rate - a Practical and Powerful Approach to Multiple Testing. J. R. Stat. Soc. B. 57:289–300. 10.1111/j.2517-6161.1995.tb02031.x [DOI] [Google Scholar]
- Boursalian, T.E., Golob J., Soper D.M., Cooper C.J., and Fink P.J.. 2004. Continued maturation of thymic emigrants in the periphery. Nat. Immunol. 5:418–425. 10.1038/ni1049 [DOI] [PubMed] [Google Scholar]
- Breed, E.R., Watanabe M., and Hogquist K.A.. 2019. Measuring Thymic Clonal Deletion at the Population Level. J. Immunol. 202:3226–3233. 10.4049/jimmunol.1900191 [DOI] [PMC free article] [PubMed] [Google Scholar]
- Buetow, L., and Huang D.T.. 2016. Structural insights into the catalysis and regulation of E3 ubiquitin ligases. Nat. Rev. Mol. Cell Biol. 17:626–642. 10.1038/nrm.2016.91 [DOI] [PMC free article] [PubMed] [Google Scholar]
- Carpino, N., Turner S., Mekala D., Takahashi Y., Zang H., Geiger T.L., Doherty P., and Ihle J.N.. 2004. Regulation of ZAP-70 activation and TCR signaling by two related proteins, Sts-1 and Sts-2. Immunity. 20:37–46. 10.1016/S1074-7613(03)00351-0 [DOI] [PubMed] [Google Scholar]
- Chemnitz, J.M., Parry R.V., Nichols K.E., June C.H., and Riley J.L.. 2004. SHP-1 and SHP-2 associate with immunoreceptor tyrosine-based switch motif of programmed death 1 upon primary human T cell stimulation, but only receptor ligation prevents T cell activation. J. Immunol. 173:945–954. 10.4049/jimmunol.173.2.945 [DOI] [PubMed] [Google Scholar]
- Chiang, Y.J., Kole H.K., Brown K., Naramura M., Fukuhara S., Hu R.J., Jang I.K., Gutkind J.S., Shevach E., and Gu H.. 2000. Cbl-b regulates the CD28 dependence of T-cell activation. Nature. 403:216–220. 10.1038/35003235 [DOI] [PubMed] [Google Scholar]
- Chikuma, S., Terawaki S., Hayashi T., Nabeshima R., Yoshida T., Shibayama S., Okazaki T., and Honjo T.. 2009. PD-1-mediated suppression of IL-2 production induces CD8+ T cell anergy in vivo. J. Immunol. 182:6682–6689. 10.4049/jimmunol.0900080 [DOI] [PubMed] [Google Scholar]
- Dubois, P.M., Pihlgren M., Tomkowiak M., Van Mechelen M., and Marvel J.. 1998. Tolerant CD8 T cells induced by multiple injections of peptide antigen show impaired TCR signaling and altered proliferative responses in vitro and in vivo. J. Immunol. 161:5260–5267. [PubMed] [Google Scholar]
- Edgar, R., Domrachev M., and Lash A.E.. 2002. Gene Expression Omnibus: NCBI gene expression and hybridization array data repository. Nucleic Acids Res. 30:207–210. 10.1093/nar/30.1.207 [DOI] [PMC free article] [PubMed] [Google Scholar]
- Fathman, C.G., and Lineberry N.B.. 2007. Molecular mechanisms of CD4+ T-cell anergy. Nat. Rev. Immunol. 7:599–609. 10.1038/nri2131 [DOI] [PubMed] [Google Scholar]
- Feshchenko, E.A., Smirnova E.V., Swaminathan G., Teckchandani A.M., Agrawal R., Band H., Zhang X., Annan R.S., Carr S.A., and Tsygankov A.Y.. 2004. TULA: an SH3- and UBA-containing protein that binds to c-Cbl and ubiquitin. Oncogene. 23:4690–4706. 10.1038/sj.onc.1207627 [DOI] [PubMed] [Google Scholar]
- Fink, P.J. 2013. The biology of recent thymic emigrants. Annu. Rev. Immunol. 31:31–50. 10.1146/annurev-immunol-032712-100010 [DOI] [PubMed] [Google Scholar]
- Gajewski, T.F., Lancki D.W., Stack R., and Fitch F.W.. 1994. “Anergy” of TH0 helper T lymphocytes induces downregulation of TH1 characteristics and a transition to a TH2-like phenotype. J. Exp. Med. 179:481–491. 10.1084/jem.179.2.481 [DOI] [PMC free article] [PubMed] [Google Scholar]
- Haymaker, C., Yang Y., Wang J., Zou Q., Sahoo A., Alekseev A., Singh D., Ritthipichai K., Hailemichael Y., Hoang O.N., et al. 2017. Absence of Grail promotes CD8+ T cell anti-tumour activity. Nat. Commun. 8:239. 10.1038/s41467-017-00252-w [DOI] [PMC free article] [PubMed] [Google Scholar]
- Heissmeyer, V., Macián F., Im S.H., Varma R., Feske S., Venuprasad K., Gu H., Liu Y.C., Dustin M.L., and Rao A.. 2004. Calcineurin imposes T cell unresponsiveness through targeted proteolysis of signaling proteins. Nat. Immunol. 5:255–265. 10.1038/ni1047 [DOI] [PubMed] [Google Scholar]
- Hsu, L.Y., Tan Y.X., Xiao Z., Malissen M., and Weiss A.. 2009. A hypomorphic allele of ZAP-70 reveals a distinct thymic threshold for autoimmune disease versus autoimmune reactivity. J. Exp. Med. 206:2527–2541. 10.1084/jem.20082902 [DOI] [PMC free article] [PubMed] [Google Scholar]
- Hsu, L.Y., Cheng D.A., Chen Y., Liang H.E., and Weiss A.. 2017. Destabilizing the autoinhibitory conformation of Zap70 induces up-regulation of inhibitory receptors and T cell unresponsiveness. J. Exp. Med. 214:833–849. 10.1084/jem.20161575 [DOI] [PMC free article] [PubMed] [Google Scholar]
- Hui, E., Cheung J., Zhu J., Su X., Taylor M.J., Wallweber H.A., Sasmal D.K., Huang J., Kim J.M., Mellman I., and Vale R.D.. 2017. T cell costimulatory receptor CD28 is a primary target for PD-1-mediated inhibition. Science. 355:1428–1433. 10.1126/science.aaf1292 [DOI] [PMC free article] [PubMed] [Google Scholar]
- Jenkins, M.K., and Schwartz R.H.. 1987. Antigen presentation by chemically modified splenocytes induces antigen-specific T cell unresponsiveness in vitro and in vivo. J. Exp. Med. 165:302–319. 10.1084/jem.165.2.302 [DOI] [PMC free article] [PubMed] [Google Scholar]
- Jeon, M.S., Atfield A., Venuprasad K., Krawczyk C., Sarao R., Elly C., Yang C., Arya S., Bachmaier K., Su L., et al. 2004. Essential role of the E3 ubiquitin ligase Cbl-b in T cell anergy induction. Immunity. 21:167–177. 10.1016/j.immuni.2004.07.013 [DOI] [PubMed] [Google Scholar]
- Kalekar, L.A., and Mueller D.L.. 2017. Relationship between CD4 Regulatory T Cells and Anergy In Vivo. J. Immunol. 198:2527–2533. 10.4049/jimmunol.1602031 [DOI] [PMC free article] [PubMed] [Google Scholar]
- Kalekar, L.A., Schmiel S.E., Nandiwada S.L., Lam W.Y., Barsness L.O., Zhang N., Stritesky G.L., Malhotra D., Pauken K.E., Linehan J.L., et al. 2016. CD4(+) T cell anergy prevents autoimmunity and generates regulatory T cell precursors. Nat. Immunol. 17:304–314. 10.1038/ni.3331 [DOI] [PMC free article] [PubMed] [Google Scholar]
- Kawabe, Y., and Ochi A.. 1990. Selective anergy of V beta 8+,CD4+ T cells in Staphylococcus enterotoxin B-primed mice. J. Exp. Med. 172:1065–1070. 10.1084/jem.172.4.1065 [DOI] [PMC free article] [PubMed] [Google Scholar]
- Kearney, E.R., Pape K.A., Loh D.Y., and Jenkins M.K.. 1994. Visualization of peptide-specific T cell immunity and peripheral tolerance induction in vivo. Immunity. 1:327–339. 10.1016/1074-7613(94)90084-1 [DOI] [PubMed] [Google Scholar]
- Keir, M.E., Freeman G.J., and Sharpe A.H.. 2007. PD-1 regulates self-reactive CD8+ T cell responses to antigen in lymph nodes and tissues. J. Immunol. 179:5064–5070. 10.4049/jimmunol.179.8.5064 [DOI] [PubMed] [Google Scholar]
- Korb, L.C., Mirshahidi S., Ramyar K., Sadighi Akha A.A., and Sadegh-Nasseri S.. 1999. Induction of T cell anergy by low numbers of agonist ligands. J. Immunol. 162:6401–6409. [PubMed] [Google Scholar]
- Kowanetz, K., Crosetto N., Haglund K., Schmidt M.H.H., Heldin C.H., and Dikic I.. 2004. Suppressors of T-cell receptor signaling Sts-1 and Sts-2 bind to Cbl and inhibit endocytosis of receptor tyrosine kinases. J. Biol. Chem. 279:32786–32795. 10.1074/jbc.M403759200 [DOI] [PubMed] [Google Scholar]
- Kriegel, M.A., Rathinam C., and Flavell R.A.. 2009. E3 ubiquitin ligase GRAIL controls primary T cell activation and oral tolerance. Proc. Natl. Acad. Sci. USA. 106:16770–16775. 10.1073/pnas.0908957106 [DOI] [PMC free article] [PubMed] [Google Scholar]
- Lupher, M.L. Jr., Reedquist K.A., Miyake S., Langdon W.Y., and Band H.. 1996. A novel phosphotyrosine-binding domain in the N-terminal transforming region of Cbl interacts directly and selectively with ZAP-70 in T cells. J. Biol. Chem. 271:24063–24068. 10.1074/jbc.271.39.24063 [DOI] [PubMed] [Google Scholar]
- Lutz-Nicoladoni, C., Wolf D., and Sopper S.. 2015. Modulation of Immune Cell Functions by the E3 Ligase Cbl-b. Front. Oncol. 5:58. 10.3389/fonc.2015.00058 [DOI] [PMC free article] [PubMed] [Google Scholar]
- Macián, F., García-Cózar F., Im S.H., Horton H.F., Byrne M.C., and Rao A.. 2002. Transcriptional mechanisms underlying lymphocyte tolerance. Cell. 109:719–731. 10.1016/S0092-8674(02)00767-5 [DOI] [PubMed] [Google Scholar]
- Maeda, Y., Nishikawa H., Sugiyama D., Ha D., Hamaguchi M., Saito T., Nishioka M., Wing J.B., Adeegbe D., Katayama I., and Sakaguchi S.. 2014. Detection of self-reactive CD8+ T cells with an anergic phenotype in healthy individuals. Science. 346:1536–1540. 10.1126/science.aaa1292 [DOI] [PubMed] [Google Scholar]
- Mirshahidi, S., Huang C.T., and Sadegh-Nasseri S.. 2001. Anergy in peripheral memory CD4(+) T cells induced by low avidity engagement of T cell receptor. J. Exp. Med. 194:719–731. 10.1084/jem.194.6.719 [DOI] [PMC free article] [PubMed] [Google Scholar]
- Moran, A.E., Holzapfel K.L., Xing Y., Cunningham N.R., Maltzman J.S., Punt J., and Hogquist K.A.. 2011. T cell receptor signal strength in Treg and iNKT cell development demonstrated by a novel fluorescent reporter mouse. J. Exp. Med. 208:1279–1289. 10.1084/jem.20110308 [DOI] [PMC free article] [PubMed] [Google Scholar]
- Mueller, D.L. 2004. E3 ubiquitin ligases as T cell anergy factors. Nat. Immunol. 5:883–890. 10.1038/ni1106 [DOI] [PubMed] [Google Scholar]
- Nurieva, R.I., Zheng S., Jin W., Chung Y., Zhang Y., Martinez G.J., Reynolds J.M., Wang S.L., Lin X., Sun S.C., et al. 2010. The E3 ubiquitin ligase GRAIL regulates T cell tolerance and regulatory T cell function by mediating T cell receptor-CD3 degradation. Immunity. 32:670–680. 10.1016/j.immuni.2010.05.002 [DOI] [PMC free article] [PubMed] [Google Scholar]
- Pape, K.A., Merica R., Mondino A., Khoruts A., and Jenkins M.K.. 1998. Direct evidence that functionally impaired CD4+ T cells persist in vivo following induction of peripheral tolerance. J. Immunol. 160:4719–4729. [PubMed] [Google Scholar]
- Schwartz, R.H. 2003. T cell anergy. Annu. Rev. Immunol. 21:305–334. 10.1146/annurev.immunol.21.120601.141110 [DOI] [PubMed] [Google Scholar]
- Sloan-Lancaster, J., Evavold B.D., and Allen P.M.. 1993. Induction of T-cell anergy by altered T-cell-receptor ligand on live antigen-presenting cells. Nature. 363:156–159. 10.1038/363156a0 [DOI] [PubMed] [Google Scholar]
- Soares, L., Seroogy C., Skrenta H., Anandasabapathy N., Lovelace P., Chung C.D., Engleman E., and Fathman C.G.. 2004. Two isoforms of otubain 1 regulate T cell anergy via GRAIL. Nat. Immunol. 5:45–54. 10.1038/ni1017 [DOI] [PubMed] [Google Scholar]
- Thien, C.B., and Langdon W.Y.. 2005. c-Cbl and Cbl-b ubiquitin ligases: substrate diversity and the negative regulation of signalling responses. Biochem. J. 391:153–166. 10.1042/BJ20050892 [DOI] [PMC free article] [PubMed] [Google Scholar]
- Tsushima, F., Yao S., Shin T., Flies A., Flies S., Xu H., Tamada K., Pardoll D.M., and Chen L.. 2007. Interaction between B7-H1 and PD-1 determines initiation and reversal of T-cell anergy. Blood. 110:180–185. 10.1182/blood-2006-11-060087 [DOI] [PMC free article] [PubMed] [Google Scholar]
- Tuncel, J., Benoist C., and Mathis D.. 2019. T cell anergy in perinatal mice is promoted by T reg cells and prevented by IL-33. J. Exp. Med. 216:1328–1344. 10.1084/jem.20182002 [DOI] [PMC free article] [PubMed] [Google Scholar]
- Yu, W., Jiang N., Ebert P.J., Kidd B.A., Müller S., Lund P.J., Juang J., Adachi K., Tse T., Birnbaum M.E., et al. 2015. Clonal Deletion Prunes but Does Not Eliminate Self-Specific αβ CD8(+) T Lymphocytes. Immunity. 42:929–941. 10.1016/j.immuni.2015.05.001 [DOI] [PMC free article] [PubMed] [Google Scholar]
- Zhang, R., Zhang N., and Mueller D.L.. 2008. Casitas B-lineage lymphoma b inhibits antigen recognition and slows cell cycle progression at late times during CD4+ T cell clonal expansion. J. Immunol. 181:5331–5339. 10.4049/jimmunol.181.8.5331 [DOI] [PMC free article] [PubMed] [Google Scholar]
- Zikherman, J., Parameswaran R., and Weiss A.. 2012. Endogenous antigen tunes the responsiveness of naive B cells but not T cells. Nature. 489:160–164. 10.1038/nature11311 [DOI] [PMC free article] [PubMed] [Google Scholar]
- Zinzow-Kramer, W.M., Weiss A., and Au-Yeung B.B.. 2019. Adaptation by naïve CD4+ T cells to self-antigen-dependent TCR signaling induces functional heterogeneity and tolerance. Proc. Natl. Acad. Sci. USA. 116:15160–15169. 10.1073/pnas.1904096116 [DOI] [PMC free article] [PubMed] [Google Scholar]
Associated Data
This section collects any data citations, data availability statements, or supplementary materials included in this article.
Supplementary Materials
shows that tolerized gene signatures were strongly enriched in peripheral W131AOTII T cells.
shows that most tolerized gene signatures were not enriched in W131AOTII CD4SP thymocytes.
shows that loss of Cbl-b in W131AOTII mice significantly altered the gene expression profile associated with improved T cell responsiveness.
Data Availability Statement
The data that support the findings of this study are available from the corresponding author upon request.


