MicroRNAs (miRNAs) are small, noncoding transcripts, and ~22 nucleotides long, which belong to a class of endogenous small regulatory RNA molecules that target mRNAs and trigger either translational suppression or mRNA degradation [1–3]. Several studies have shown that miRNAs play crucial roles in neurogenesis and development of nervous system [4,5] and have distinct expression patterns within the developing brain and central nervous system (CNS) [6]. Abnormal expression of miRNAs has also been reported in dysregulated neural tube (NT) development including NT defects (NTDs) [7,8].
To date, however, all NTD-related miRNA profiles were obtained from different microarray platforms, which always contain limited probes, and the data obtained are less precise in quantitative analysis. No quantitatively profiled global miRNA expression in mouse NTD fetuses has been characterized so far. To gain further insight of the possible roles of miRNAs in NTDs, we used deep sequencing to carry out a comprehensive survey of miRNA expression in all-trans retinoic acid (RA)-induced NTD mouse fetuses collected from three different embryonic time points (E8.5, E9.5, and E10.5). This study is the first, to our knowledge, to report the deep sequencing miRNA profile, which defined unique gene expression signatures of a range of miRNAs and their potential regulatory networks in response to RA stress and the development of NTDs in mouse model.
The pregnant C57BL/6 mice were randomly divided into control and NTD model groups. At the time point of E7.5, mice of NTD model group were gavaged with 28 mg/kg (body weight) of RA (Sigma, St Louis, USA) and the control groups were gavaged with the same dose of sesame oil [9]. Embryonic NTs, from the most rostral aspect of the forebrain to the caudal aspect of the hindbrain (above the otic vesicle), were collected on E8.5, E9.5, and E10.5 according to the previous study [10] and further trimmed to eliminate any mesoderm or non-neural tissues as precisely as possible. Nine mouse embryos were collected from three independent dams as pooled sample for each stage in sRNA-seq experiment. Total RNA of the samples was extracted using TRIzol reagent (Invitrogen, Carlsbad, USA). The quality and quantity of the RNA samples were determined on a Bioanalyzer 2100 system using an RNA 6000 nano Reagents Port 1 kit (Agilent Technologies, Santa Clara, USA). Small RNA libraries were generated from the purified RNA using TruSeq Small RNA Sample Preparation kit (Illumina, San Diego, USA). The sequencing was performed on Illumina HiSeq™ 2000. The data obtained from control group were named as Brc8.5, Brc9.5, and Brc10.5 and from NTDs group were named as Bra8.5, Bra9.5, and Bra10.5, respectively. Obtained clean and unique small RNA reads were mapped to the latest mouse genome (http://soap.genomics.org.cn/), the Rfam database (http://rfam.janelia.org/), and the GenBank database (ftp://ftp.ncbi.nlm.nih.gov/genbank/) to annotate. miRNA identification was performed by comparing the data with the known mature miRNAs and the miRNA precursor in miRBase20.0 (http://www.mirbase.org/). The differentially expressed miRNAs (DEmiRNAs) were identified by the DEGseq software [11]. miRNAs that met the criteria of the absolute value log2 ratio≥1 and FDR≤0.001 were considered as significantly differentially expressed. We used the TargetScan software program for target prediction of miRNAs. Gene Ontology (GO) analysis and Kyoto Encyclopedia of Genes and Genomes (KEGG) pathway analysis were performed to reveal the functions of the putative target genes. miRNA–mRNA integrative genomic analysis was performed using Magia2 [12].
After filtering the adaptor sequences and removing the low-quality reads, a total of 10,951,042, 10,357,039, 11,571,691, 10,768,495, 10,461,544, and 12,016,327 clean reads were obtained in constructed library Brc8.5, Brc9.5, Brc10.5, Bra8.5, Bra9.5, and Bra10.5, respectively (Supplementary TableS1). The base quality diagram showed that the sequence data were of good quality (Supplementary Fig.S1), and the map rates with reference genome were all above 70%. By comparing with the corresponding database, different types of sRNA were identified and detailed information of these sRNA was summarized in Supplementary TableS2. The length distribution of sRNAs was similar among different samples (Supplementary Fig.S2).
After blasted against the database miRBase 20.0, we identified 678, 750, 765, 699, 683, and 729 known miRNAs in library Brc8.5, Brc9.5, Brc10.5, Bra8.5, Bra9.5, and Bra10.5, respectively (Supplementary TableS3). Among them, 82 and 103 miRNAs were specifically expressed in library Brc8.5 and Bra8.5, respectively, and 596 miRNAs were co-expressed in library Brc8.5 and Bra8.5; 149 and 82 miRNAs were specifically expressed in library Brc9.5 and Bra9.5, respectively, and 601 miRNAs were co-expressed in library Brc9.5 and Bra9.5; 130 and 94 miRNAs were specifically expressed in library Brc10.5 and Bra10.5, respectively, and 635 miRNAs were co-expressed in library Brc10.5 and Bra10.5.
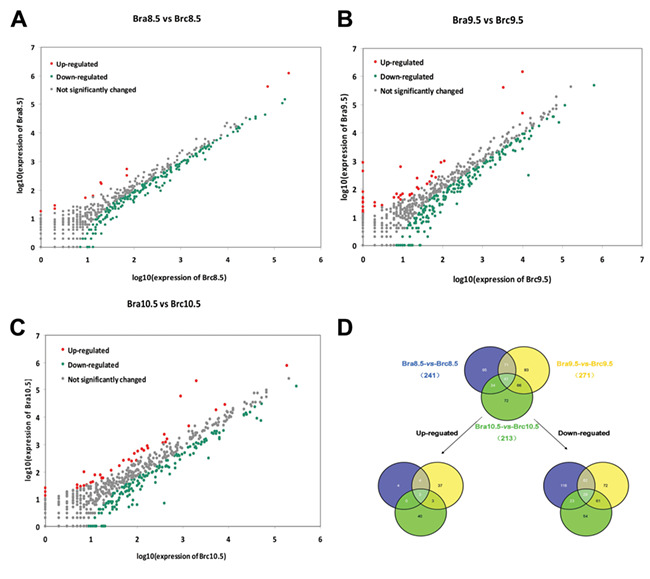
A total of 241 miRNAs (11 miRNAs upregulated and 230 miRNAs downregulated; 11/230), 271 miRNAs (47/224), and 213 miRNAs (46/167) were identified as differentially expressed in the library Bra8.5 vs Brc8.5, Bra9.5 vs Brc9.5, and Bra10.5 vs Brc10.5 comparison, respectively (Fig. 1A–C). The intersection analysis among Bra8.5 vs Brc8.5, Bra9.5 vs Brc9.5, and Bra10.5 vs Brc10.5 was performed, and 41 co-expressed DEmiRNAs were obtained, of which 3 miRNAs were upregulated and 29 miRNAs were downregulated continuously and 9 miRNAs were arch-down or down-arch regulated (Fig. 1D).
Figure 1.

The known DEmiRNA in NTDs (A–C) Compare the known miRNA expression between different NT development stages to find out the DEmiRNAs. Each point in the figure represents a miRNA. The horizontal coordinates and vertical coordinates show the expression level of miRNAs in two libraries. Red points represent upregulated miRNAs and green points represent downregulated miRNAs (P<0.05, FDR≤0.001, and absolute value of log2 ratio≥1); gray points represent no significant change of miRNAs. Ratio means normalized expression in treatment/normalized expression in control. (D) Intersection analysis of DEmiRNAs in Brc8.5 vs Bra8.5, Brc9.5 vs Bra9.5, and Brc10.5 vs Bra10.5 represented by Venn diagram (P<0.05, FDR≤0.001, and absolute value of log2 ratio≥1). In total, 41 miRNAs were identified to be significantly differentially expressed, including 3 miRNAs that were upregulated and 29 miRNAs that were downregulated continuously.
To identify the potential targets of miRNAs, we searched TargetScan database as well as our previously reported RNA-seq database from all six samples used in this experiment [9]. The differentially expressed mRNA and miRNA pairs in the six samples were analyzed by Pearson correlation, and the targeted genes were filtered by correlation coefficient (>0.85) and P-value (<0.05). Supplementary TableS4 lists the number of miRNAs and target genes in Brc8.5 vs Bra8.5, Brc9.5 vs Bra9.5, and Brc10.5 vs Bra10.5.
All the predicted target genes were submitted for GO analysis (Supplementary TableS5). We found that the biological processes involved mainly included the neuron fate commitment, neuron differentiation, CNS development, neurogenesis, nervous system development, etc. (Supplementary Fig.S3).
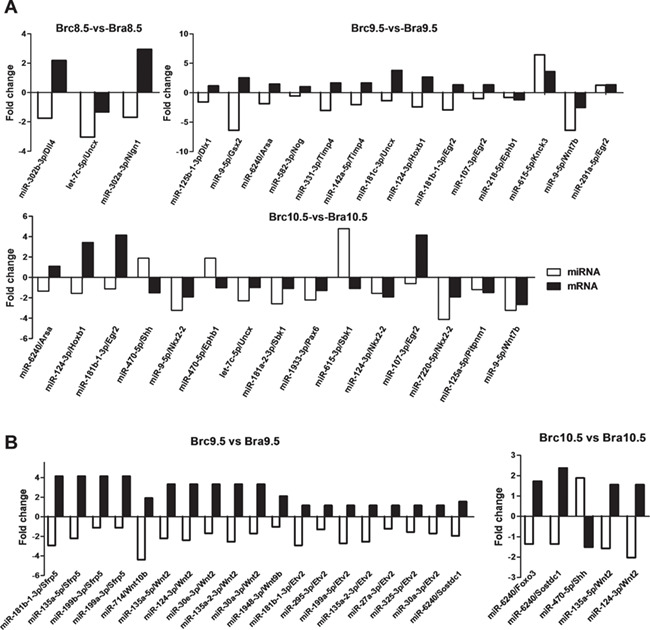
To further elucidate the roles of miRNA–mRNA relationships, we selected the miRNA–mRNA pairs where all the target genes enriched in the GO term `CNS development’, which included 3 miRNA–mRNA pairs (3 genes and 3 miRNA) in Brc8.5 vs Bra8.5, 14 pairs (11 genes and 13 miRNA) in Brc9.5 vs Bra9.5, and 15 pairs (12 genes and 12 miRNA) in Brc10.5 vs Bra10.5. Among them, we identified 19 miRNA/mRNA negative regulation pairs, such as miR-9-5p/Gsx2, miR-615-3p/Sbk1, miR-181b-1-3p/Egr2, miR-331-3p/Timp4, miR-181c-3p/Uncx, and miR-124-3p/Hoxb1 (Fig. 2A).
Figure 2.

miRNA/mRNA pairs related to CNS development, Hedgehog signaling pathway, and Wnt signaling pathway (A) There are 3, 14, and 15 miRNA/mRNA pairs involved in CNS development in Brc8.5 vs Bra8.5, Brc9.5 vs Bra9.5, and Brc10.5 vs Bra10.5, respectively (P<0.05 and FDR≤0.001). The horizontal coordinates are the miRNA/mRNA, and the vertical coordinates are fold change. (B) There are 19 miRNA/mRNA pairs involved in Wnt signaling pathway in Brc9.5 vs Bra9.5 and 5 miRNA/mRNA pairs involved in Hedgehog signaling pathway in Brc10.5 vs Bra10.5. The horizontal coordinates are the miRNA/mRNA, and the vertical coordinates are fold change.
According to KEGG functional annotations, two pathways in Brc9.5 vs Bra9.5 and six pathways in Brc10.5 vs Bra10.5 were found to be significantly enriched (FDR<0.05) (Supplementary TableS6). Interestingly, in the analysis of the KEGG pathway of the targets, we found that there were 9 and 16 genes enriched in the Hedgehog signaling pathway and Wnt signaling pathway of Brc9.5 vs Bra9.5, and similar numbers were detected in Brc10.5 vs Bra10.5 (9 genes in the Hedgehog signaling pathway and 11 genes in Wnt signaling pathway). In addition, 19 and 5 miRNA/mRNA negative regulation pairs were found in E9.5 and E10.5, respectively (Fig. 2B).
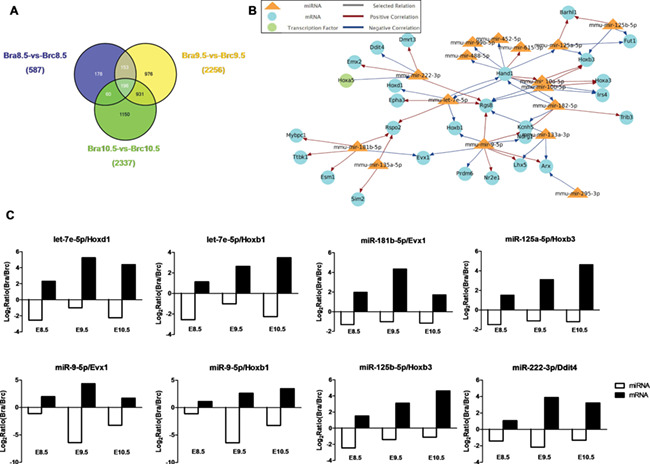
Through the intersection analysis among Bra8.5 vs Brc8.5, Bra9.5 vs Brc9.5, and Bra10.5 vs Brc10.5, we obtained 196 co-expressed differentially expressed genes (DEGs) (Fig. 3A). These miRNAs/mRNAs were uploaded into the Magia2. The person correlation was used as the methods, and TargetScan was chosen as the predictor. Figure 3B summarized the functional interactions among 16 miRNAs, 25 mRNAs, and 2 transcription factors. Moreover, there were eight miRNA–mRNA pairs, which were negatively correlated in three time points indicating the possible key roles in NTDs (Fig. 3C).
Figure 3.

Functional interactive network analysis of co-expressed DE miRNAs and mRNAs (A) Intersection analysis of DEGs in Brc8.5 vs Bra8.5, Brc9.5 vs Bra9.5, and Brc10.5 vs Bra10.5 represented by Venn diagram (P<0.05, FDR≤0.001, and absolute value of log2 ratio≥1). In total, 196 genes were identified to be significantly differentially expressed. (B) The interactive image with the functional interactions among miRNA, mRNA, and transcription factors was constructed by Magia2. (C) The expression pattern of screened eight miRNA–mRNA pairs in three time points. The horizontal coordinates are the time points, and the vertical coordinates are fold changes.
In conclusion, we compared the miRNA expression profiles of different stages in mice NTs and RA-induced NTDs by sRNA-seq. Our data suggested that the expression profiles of miRNAs and targeted mRNAs were significantly dysregulated in NTDs. These results would warrant further investigation to determine the regulatory roles of the DEmiRNAs and targets in controlling NT development and the pathogenesis of NTDs.
Supporting Information
The clean reads of Library Brc8.5, Brc9.5, Brc10.5, Bra8.5, Bra9.5, and Bra10.5 were deposited into NCBI SRA (accession numbers: SRP152512).
Funding
This work was supported by the grants from the National Natural Science Foundation of China (No. 81671462), Shanxi Scholarship Council of China (2012-048 and 2016-051), Shanxi Province Key Laboratory of Birth Defects and Cell Regeneration, and Research Project Supported by Shanxi Scholarship Council of China.
Supplementary Material
References
- 1. Bartel DP. MicroRNAs: target recognition and regulatory functions. Cell 2009, 136: 215–233. [DOI] [PMC free article] [PubMed] [Google Scholar]
- 2. Eulalio A, Huntzinger E, Izaurralde E. Getting to the root of miRNA-mediated gene silencing. Cell 2008, 132: 9–14. [DOI] [PubMed] [Google Scholar]
- 3. Filipowicz W, Bhattacharyya SN, Sonenberg N. Mechanisms of post-transcriptional regulation by microRNAs: are the answers in sight. Nat Rev Genet 2008, 9: 102–114. [DOI] [PubMed] [Google Scholar]
- 4. Foshay KM, Gallicano GI. miR-17 family miRNAs are expressed during early mammalian development and regulate stem cell differentiation. Dev Biol 2009, 326: 431–443. [DOI] [PubMed] [Google Scholar]
- 5. Leucht C, Stigloher C, Wizenmann A, Klafke R, Folchert A, Bally-Cuif L. MicroRNA-9 directs late organizer activity of the midbrain hindbrain boundary. Nat Neurosci 2008, 11: 641–648. [DOI] [PubMed] [Google Scholar]
- 6. Bak M, Silahtaroglu A, Møller M, Christensen M, Rath MF, Skryabin B, Tommerup N, et al. MicroRNA expression in the adult mouse central nervous system. RNA 2008, 14: 432–444. [DOI] [PMC free article] [PubMed] [Google Scholar]
- 7. Qin P, Li L, Zhang D, Liu QL, Chen XR, Yang HY, Fan YZ, et al. Altered microRNA expression profiles in a rat model of spina bifida. Neural Regen Res 2016, 11: 502–507. [DOI] [PMC free article] [PubMed] [Google Scholar]
- 8. Ramya S, Shyamasundar S, Bay BH, Dheen ST. Maternal diabetes alters expression of microRNAs that regulate genes critical for neural tube development. Front Mol Neurosci 2017, 10: 237. [DOI] [PMC free article] [PubMed] [Google Scholar]
- 9. Yu J, Mu J, Guo Q, Yang L, Zhang J, Liu Z, Yu B, et al. Transcriptomic profile analysis of mouse neural tube development by RNA-Seq. IUBMB Life 2017, 69: 706–719. [DOI] [PubMed] [Google Scholar]
- 10. Mukhopadhyay P, Brock G, Appana S, Webb C, Greene RM,Pisano MM. MicroRNA gene expression signatures in the developing neural tube. Birth Defects Res A Clin Mol Teratol 2011, 91: 744–762. [DOI] [PMC free article] [PubMed] [Google Scholar]
- 11. Wang L, Feng Z, Wang X, Wang X, Zhang X. DEGseq: an R package for identifying differentially expressed genes from RNA-seq data. Bioinformatics 2010, 26: 136–138. [DOI] [PubMed] [Google Scholar]
- 12. Bisognin A, Sales G, Coppe A, Bortoluzzi S, Romualdi C. MAGIA2: from miRNA and genes expression data integrative analysis to microRNA–transcription factor mixed regulatory circuits (2012 update). Nucleic Acids Res 2012, 40: W13–W21. [DOI] [PMC free article] [PubMed] [Google Scholar]
Associated Data
This section collects any data citations, data availability statements, or supplementary materials included in this article.


