Abstract
Objectives:
To investigate the time and pattern of fusion of the spheno-occipital synchondrosis in patients with skeletal Class I and Class III malocclusion using cone-beam computed tomography (CBCT).
Materials and Methods:
A total of 262 CBCT images were collected: 140 skeletal Class I (0° < ANB < 4°; 71 males, 69 females) and 122 skeletal Class III (ANB ≤ 0°; 61 males and 61 females). The fusion stages were identified using CBCT images of a six-stage system defined by the appearance of osseous cores and ossifying vestige in the synchondrosis. The age distributions of each stage and the pattern of fusion were evaluated.
Results:
The stages of fusion progressed with increasing age (P < .05, r = .824), and the age distributions in the female groups were generally 1 to 3 years younger than those in the male groups. However, no significant differences were observed between the skeletal Class I and Class III groups regarding the time of ossification of the synchondrosis. The osseous cores appeared most frequently in the supero-center part, followed by the mid-center part of the synchondrosis.
Conclusions:
The time and pattern of fusion of the spheno-occipital synchondrosis are not apparently different between patients with Class I malocclusion and those with Class III malocclusion. The osseous cores appear frequently in the supero-center and mid-center of the synchondrosis with various patterns before the end of the pubertal growth spurt period.
Keywords: Cone-beam computed tomography, Fusion, Skeletal Class III malocclusion, Spheno-occipital synchondrosis
INTRODUCTION
The spheno-occipital synchondrosis is a hyaline cartilaginous joint of the cranial base located between the sphenoid bone anteriorly and the occipital bone posteriorly. The synchondrosis is regarded as an active growth center of the craniofacial skeleton until it is replaced by bone during childhood and adolescence.1,2
There have been many studies on the fusion of the spheno-occipital synchondrosis based on a direct inspection of dry skulls,2–4 macroscopic and histologic investigations of autopsy materials,5–8 cephalometric laminography,9–12 and computed tomography (CT).13–16 In the direct inspection studies of dry skulls,5,17 the fusion stage was evaluated grossly using a three-stage system: open, semiclosed, and closed. Histologically, an osseous core appeared in the cartilage tissue between the sphenoid and occipital bones, and the osseous connection between these two bones occurred with the progress of ossification around the osseous core.7 Computed tomographic studies enabled early detection of a single ossification center,7,14,16 and the fusion stage was classified according to the radiopacity in the synchondrosis as five- or six-stage systems.13,16
Previous studies reported that the fusion of the synchondrosis occurred 2 or 3 years earlier in females than in males.6,9,10,13 However, the timing of complete fusion of the synchondrosis is still controversial in the literature.4–10,13–15 This inconsistency is probably due to a difference in criteria, population, and assessment methods. In addition, most of the studies on the fusion of the synchondrosis did not consider the skeleto-facial differences between the subjects.
Growth in the spheno-occipital synchondrosis is associated with an increase in posterior cranial base length and a flattening of the angle between the anterior and posterior cranial base, which affects the sagittal relationship of the upper and lower jaws.10,18,19 Previous studies have reported distinctive characteristics in the cranial base of patients with Class III malocclusion.18–22 Class III patients exhibited a significantly shorter posterior cranial base during the prepubertal period than the Class I group,19,20 suggesting that early fusion in the spheno-occipital synchondrosis causes a short cranial base and a retruded maxilla. Singh20 proposed that a decreased cranial base angle caused by premature synostosis of the synchondrosis may affect the temporomandibular joint's forward movement, thereby resulting in skeletal Class III malocclusion.
However, to date, no study has determined whether the spheno-occipital synchondrosis in Class III patients fuses earlier than in Class I patients. Therefore, this study aimed to investigate the time and pattern of fusion of the spheno-occipital synchondrosis in Korean patients with skeletal Class I and Class III malocclusion using cone-beam computed tomography (CBCT).
MATERIALS AND METHODS
The sample for this retrospective study was collected from the pretreatment records of patients who had visited the Department of Orthodontics, Gangneung-Wonju National University Dental Hospital, between January 2011 and May 2018. Inclusion criteria were (1) available CBCT images that were taken for diagnostic purposes, (2) ANB angle less than 4°, and (3) females aged 7 to 19 years and males aged 7 to 22 years. Patients with a history of cleft lip or palate, craniofacial syndrome, or prior orthodontic treatment were excluded. No CBCTs were taken specifically for this study, and the protocol of this study was reviewed and approved by the Ethics Committee of Gangneung-Wonju National University Dental Hospital. The final sample consisted of 262 CBCT images (130 females, 132 males), and they were divided into four groups according to gender and ANB angle into male and female skeletal Class I (0° < ANB < 4°) and Class III (ANB ≤ 0°) groups (Table 1).
Table 1.
Distributions of Age and the ANB Angle of the Sample Groupsa
| Group |
n |
Age, y |
ANB, ° |
SNA, ° |
|||||
| Mean |
SD |
Min |
Max |
Mean |
SD |
Mean |
SD |
||
| Class I male | 71 | 13.5 | 3.8 | 7.4 | 21.8 | 2.3 | 0.9 | 80.7 | 3.7 |
| Class I female | 69 | 13.6 | 2.9 | 7.8 | 18.8 | 2.3 | 0.9 | 81.1 | 4.1 |
| Class III male | 61 | 14.1 | 4.3 | 7.8 | 21.4 | −2.5 | 2 | 79.2 | 2.9 |
| Class III female | 61 | 13.7 | 3.4 | 7.6 | 18.8 | −1.8 | 1.4 | 79.1 | 3.5 |
n indicates sample size; SD, standard deviation; Min, minimum; Max, maximum.
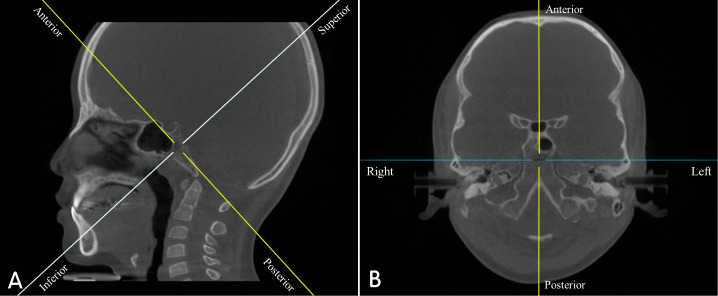
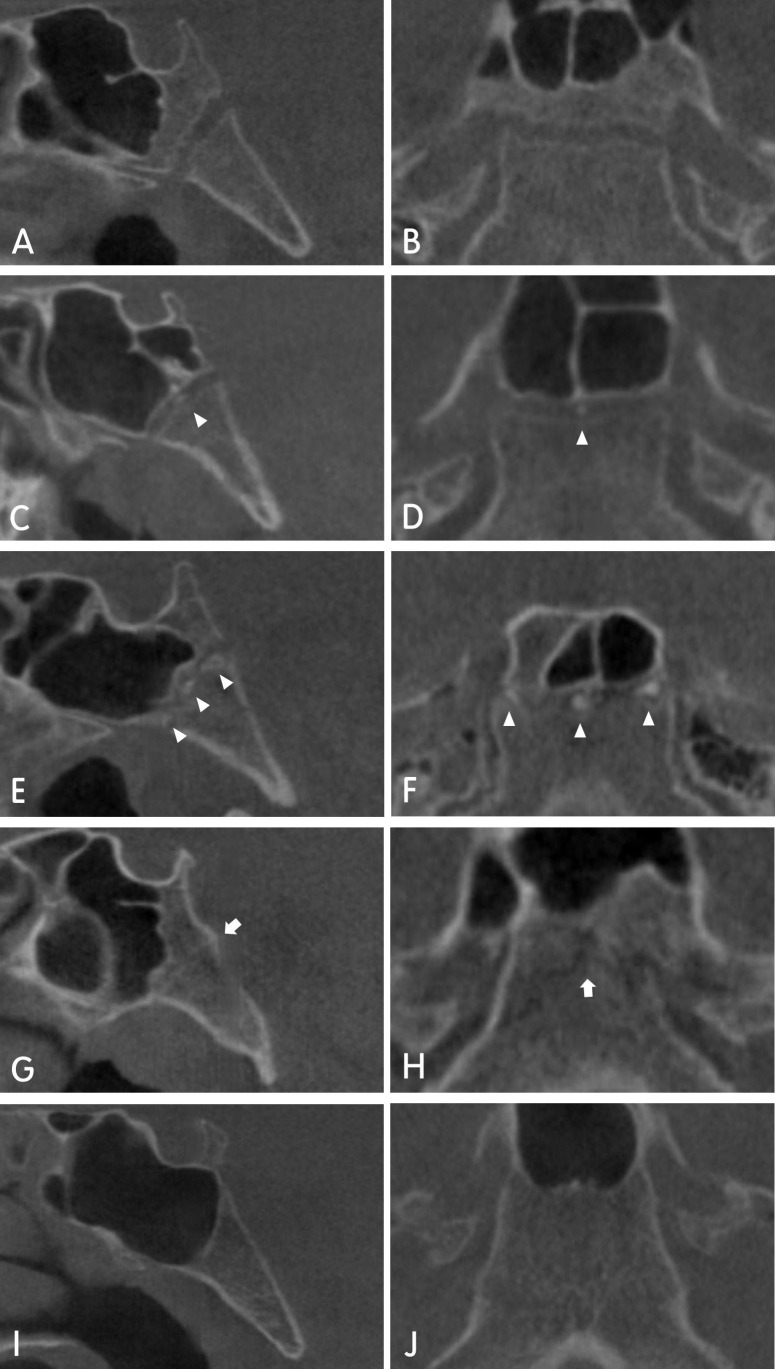
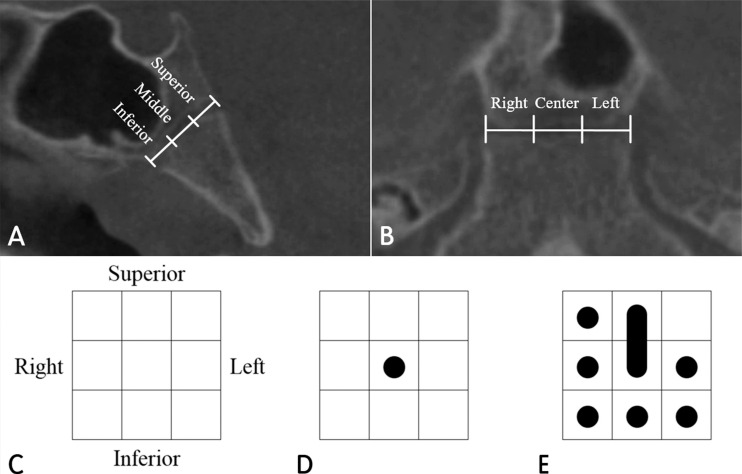
All CBCT scans were taken using an Alphard-3030 unit (Asahi Roentgen Industries Co, Japan) for orthodontic diagnosis. The device was set at 6.0 mA and 80 kV in adults and at 5.0 mA and 80 kV in children. The imaging system captured the head and neck with 0.39-mm-thick slices and a 200-mm × 179-mm field of view. The images were saved as digital imaging and communication in medicine files, and three-dimensional (3D) images were reconstructed via OnDemand 3D software (Cybermed, Seoul, Korea), thereby providing a multiplanar reconstruction view. The principal axes were reoriented in the midsagittal plane according to the long axis of the spheno-occipital synchondrosis (Figure 1). The synchondrosis was comprehensively examined in the sagittal sections from the left to right margin and, in the sections perpendicular to the long axis of the synchondrosis, from the superior to inferior border to classify the stages of fusion. The fusion status of the spheno-occipital synchondrosis was evaluated by one examiner using a six-stage system, which was modified from that of Lottering et al.16 The definitions for the stages of fusion are summarized in Table 2 and Figure 2. The osseous cores in Stage III and IV were recorded graphically in a chart of 3 × 3 boxes, which divides the synchondrosis into nine parts (Figure 3). The prevalence of the osseous core in each box was calculated to determine the developing pattern of the osseous cores in the synchondrosis. Fifty CBCT images were selected arbitrarily and scored twice with a 1-week interval to calculate intraexaminer reliability. The weighted kappa coefficient was 0.871 (P < .001).
Figure 1.
CBCT images: (A) Sagittal section. (B) Section perpendicular to the long axis of the spheno-occipital synchondrosis.
Table 2.
Definitions for the Stages of Fusion of the Spheno-occipital Synchondrosis
| Stage |
Classification |
Definition |
| Stage I | Open | The synchondrosis was completely open and appeared as a radiolucent band; absence of osseous core and no fusing sign on superolateral margin of the synchondrosis |
| Stage II | Incipient fusion | Fusion between the sphenoid and occipital bone on the right and/or left lateral margin, typically on the superior third of the synchondrosis |
| Stage III | Appearance of single osseous core | A single osseous core appeared within the synchondrosis, and the bilateral margins of the superior third of the synchondrosis were fused evidently; a radiopaque osseous core was isolated within the synchondrosis or connected with sphenoid or occipital bones |
| Stage IV | Appearance of additional osseous cores | Multiple complex osseous cores were observed within the synchondrosis; partially fused synchondrosis with presence of isolated and/or bony bridged osseous cores |
| Stage V | Fusion with ossifying vestige | The synchondrosis was almost fused but still visible as a mixed radiopaque and radiolucent ossifying vestige |
| Stage VI | Complete fusion | The synchondrosis was completely ossified and appeared like a single bone without radiolucent gaps |
Figure 2.
CBCT images of the spheno-occipital synchondrosis at various stages of ossification. (A, B) Stage II in a 9.8-year-old boy. (C, D) Stage III, the appearance of a single osseous core (arrow heads) in an 11.5-year-old girl. (E, F) Stage IV, the appearance of multiple osseous cores (arrow heads) in a 13.3-year-old boy. (G, H) Stage V, incomplete fusion with an ossifying vestige (arrows) in a 14.8-year-old girl. (I, J) Stage VI, complete ossification in a 21.3-year-old man.
Figure 3.
(A, B) The spheno-occipital synchondrosis was divided into three parts in each section. (C) Chart of 3 × 3 boxes represent the synchondrosis. (D) Patient shown in Figure 2 C and D (Stage III) had a single osseous core in the middle-center of the synchondrosis. (E) the patient shown in Figure 2 E and F (Stage IV) had the osseous cores in eight parts, and the osseous cores in the superior-center and middle-center were connected to each other.
Statistical Analysis
Mann-Whitney tests were used to identify significant differences in the fusion stage between Class I and Class III groups at each chronologic age, which was rounded to a full year. Kaplan-Meier survival analysis was performed to compare the time of the fusion of the spheno-occipital synchondrosis between Class I and Class III groups. Spearman correlation analysis was used to assess the correlation between fusion stage and age, ANB, and SNA. P < .05 was taken to indicate statistical significance. All statistical analyses were performed using PASW version 18.0 (IBM Co, Armonk, NY).
RESULTS
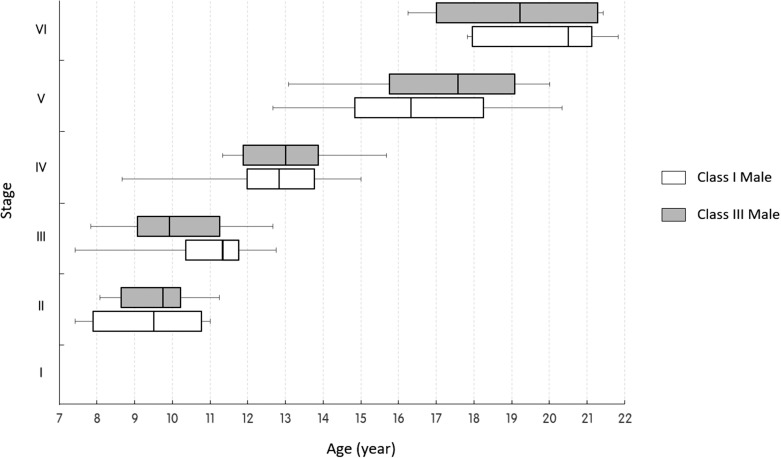
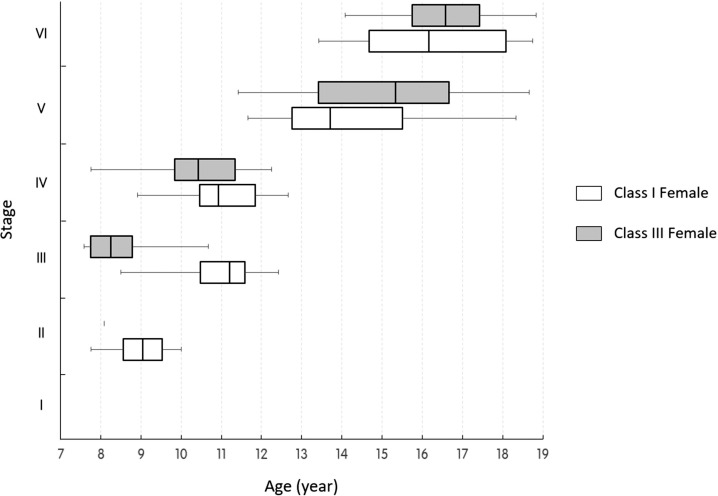
The age distribution at each stage of fusion is shown in Figures 4 and 5. The stages of fusion progressed with increasing age in all groups. The Spearman rank correlation coefficient showed a positive significant relationship between age and fusion stage (P < .001, r = .824) and between SNA and fusion stage (P = .002, r = .212). However, no significant correlation was observed between the fusion stage and ANB (P = .633). In both male and female groups, there was no significant difference between Class I and Class III groups in the fusion stage at each age rounded to a full year (Mann-Whitney test, P > .05). Figure 6 shows the Kaplan-Meier survival analysis, which revealed no significant difference in time of ossification of the synchondrosis between Class I and Class III in both male (P = .340) and female groups (P = .477).
Figure 4.
Age distribution at each stage of fusion of the spheno-occipital synchondrosis in the male groups.
Figure 5.
Age distribution at each stage of fusion of the spheno-occipital synchondrosis in the female groups.
Figure 6.
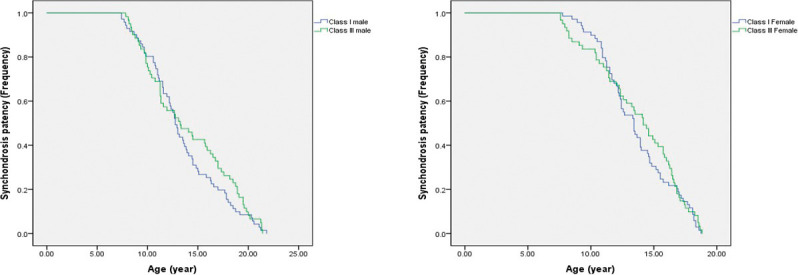
Kaplan-Meier survival analysis. The curve on the left side indicates earlier initiation or completion of fusion.
Skeletal Class I and Class III Male Groups
Stage I was not found in either Class I or Class III male groups. The oldest age at Stage II was 11.3 years in the Class III male group and 11.0 years in the Class I male group. Stage III ranged widely between 7.4 and 12.8 years of age in the Class I male group and between 7.8 and 12.7 years in the Class III male group. The earliest age of stage VI at which complete fusion occurred was 16.3 and 17.8 years for the Class III and Class I male groups, respectively. The age distribution of the Stage V patients was widespread, ranging from 12.7 to 20.3 years in the male groups.
Skeletal Class I and Class III Female Groups
The age distributions for each stage in the female groups were generally 1 to 3 years younger than those in the male groups. Stage I was not found in either Class III or Class I female groups. The subjects classified as Stage III and IV ranged widely between 8.5 and 12.7 years in the Class I female group and between 7.6 and 12.3 years in the Class III female group. Patients older than 13 years were all Stage V or VI.
Pattern of Osseous Cores
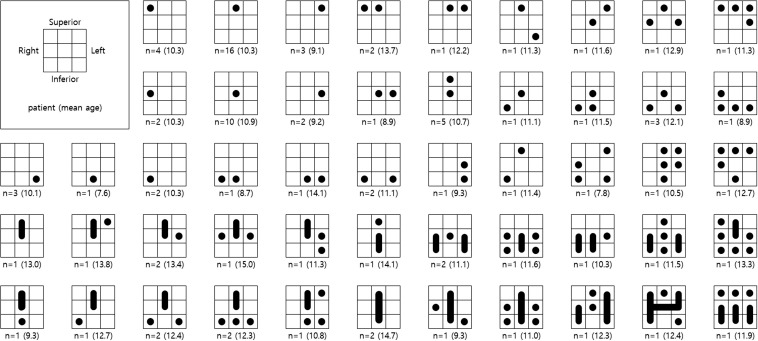
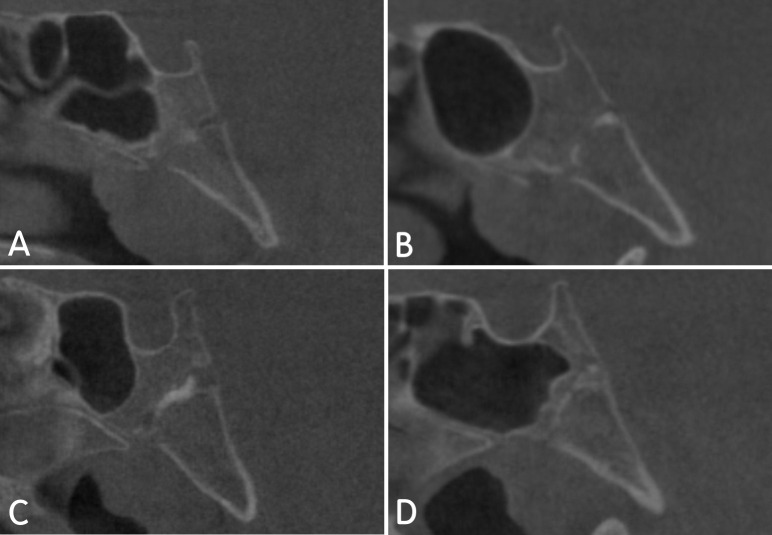
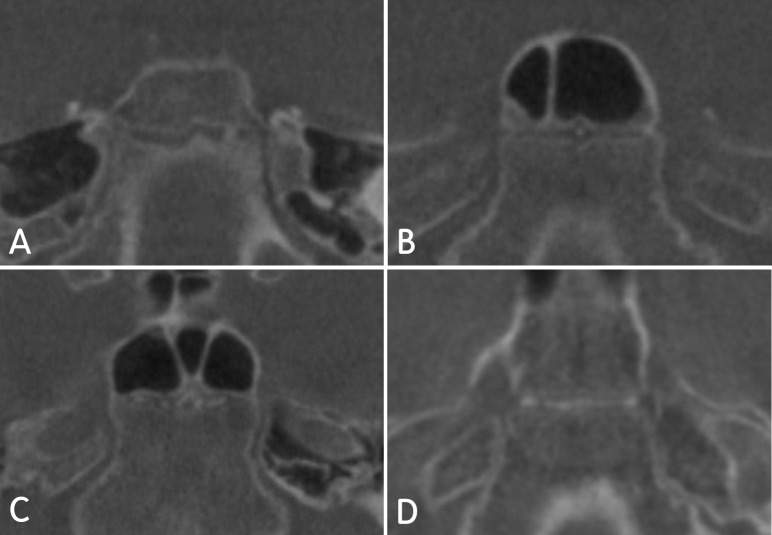
Of the 262 subjects, 98 were classified as Stage III and IV (Figure 7). The patterns of osseous cores varied from a single circle to multiple columns that were generally positioned vertically rather than horizontally within the synchondrosis. The osseous cores in Stage III and IV appeared most frequently in the supero-center part, followed by the mid-center part of the synchondrosis (Figure 8). The osseous core appeared less radiopaque, smaller, and more rounded in the younger patients while it looked more radiopaque and more complex in the older patients (Figures 9 and 10). Some of the osseous cores were connected to the sphenoid or occipital bones by bony bridges, which were observed frequently in the complex types.
Figure 7.
The patterns of the osseous cores arranged from left-up to right-down with increasing complexity at Stage III and IV (n = 98).
Figure 8.
The prevalence of the osseous core in each part of the synchondrosis was calculated as a percentage.
Figure 9.
Osseous cores observed in sagittal sections. (A) Single circle in the middle part (a 9.1-year-old boy in the Class I group). (B) Circles in the superior and inferior parts (a 12.4-year-old girl in the Class I group). (C) Highly radiopaque column in the middle and a circle in the inferior part (an 11.9-year-old boy in the Class I group). (D) Multiple circles in the whole region (a 13.3-year-old boy in the Class III group).
Figure 10.
Osseous cores observed in the sections perpendicular to the long axis of the spheno-occipital synchondrosis. (A) Single circle in the left part (an 8.2-year-old boy in the Class III group). (B) Single circle in the center part (an 11-year-old girl in the Class III group). (C) Multiple circles in the whole region (a 12.3-year-old girl in the Class I group). (D) Column in the whole region (a 12.4-year-old girl in the Class I group).
DISCUSSION
In this study, 262 CBCT images were examined to determine whether the spheno-occipital synchondrosis in Class III patients was fused earlier than in the Class I group. While the mean age of Stage III, which was classified as the initial appearance of the osseous cores within the synchondrosis, tended to be earlier in the skeletal Class III groups than in the Class I groups (Figures 4 to 6), the results indicated no significant difference in the time of fusion of the spheno-occipital synchondrosis between the Class III and Class I groups.
According to an autopsy study by Melsen,7 once a single osseous bridge was established between the sphenoid and occipital bones, the synchondrosis no longer contributed to the growth in the length of the posterior cranial base, even when cartilage still remained within the synchondrosis. The early appearance of the osseous cores could give rise to an early osseous bridge in the synchondrosis, resulting in undergrowth of the maxilla. This assumption can be supported by the fact that the patients with craniofacial deformities accompanied by midfacial hypoplasia, such as achondroplasia, Apert's syndrome, and cleidocranial dysplasia, show premature fusion of their spheno-occipital synchondrosis.23
The lack of differences between the Class I and Class III groups in this study might have been due to the sample criteria, which did not strictly distinguish maxillary deficiency from mandibular prognathism. Class III groups in the study might have had mandibular prognathism rather than maxillary deficiency. For instance, the SNA angles of the Class III groups in this study were not significantly different from those of the Class I group (Table 1), and mandibular prognathism is more prevalent in the Asian population than in American Class III subjects.24 In addition, the spheno-occipital synchondrosis contributes to not only the sagittal relationship but also the vertical relationship, which should be considered in further studies.
The osseous core within the synchondrosis was observed in patients older than 7 years, and it was present until 13 years in females and 16 years in males. Powell and Brodie10 also reported that in a small percentage of females and males, the synchondrosis was still open after 13 and 15 years of age, respectively. Considering that the average age of the pubertal growth peak in Koreans is 11–13 years in females and 12–14 years in males,25 the synchondrosis is thought to begin ossification before the end of the pubertal growth spurt. After the stages that showed the development of osseous cores, the ossifying vestige was still found in females older than 18 and in males over 21 years. Bassed et al.13 also reported that the ossifying vestige was found in both male and female patients until 25 years of age. The time that the ossifying vestige disappears is considered to vary depending on the individual because the age distributions of the patients widely overlapped between the partial fusion group and the complete fusion group.
The osseous core appeared most frequently in the supero-center and mid-center area in both Class I and Class III groups, which supported the theory that fusion of the spheno-occipital synchondrosis occurs first at the superior border and proceeds to the inferior border.3,9,10 Previous CT studies13,26 observed the synchondrosis only on the midsagittal plane; therefore, the osseous core and the bony bridge on bilateral sides were not detected. However, as shown in Figures 7, 9, and 10, the osseous core appeared not always on the midsagittal plane but in a great variety of patterns and was more complex in older patients. Moreover, the degree of fusion in the middle part was not always the same as with bilateral parts of the synchondrosis. Therefore, the six-stage system of Lottering et al.,16 who examined the entirety of the synchondrosis in both sagittal and axial sections, was modified for use in the current study.
One of the limitations of this study was the small sample size of Class III patients who were in a period of pubertal growth spurt, because most Class III patients receive orthopedic treatment at an earlier age or delay their orthodontic treatment until the end of their residual growth. In addition, the chronological age of the patients was used, and actual skeletal maturity might vary. In future studies, it would be helpful to consider the skeletal maturation stage of patients rather than chronological age.
CONCLUSIONS
The stages of fusion progress with increasing age, with females generally showing fusion 1 to 3 years earlier than males.
The time and pattern of fusion of the spheno-occipital synchondrosis are not apparently different between patients with Class I and Class III malocclusion.
The osseous cores appear more frequently in the supero-center and mid-center parts of the synchondrosis with various patterns before the end of the pubertal growth spurt period.
REFERENCES
- 1.Björk A. Cranial base development: a follow-up x-ray study of the individual variation in growth occurring between the ages of 12 and 20 years and its relation to brain case and face development. Am J Orthod. 1955;41:198–225. [Google Scholar]
- 2.Ford EHR. Growth of the human cranial base. Am J Orthod. 1958;44:498–506. [Google Scholar]
- 3.Krogman WM. Studies in growth changes in the skull and face of anthropoids. II. Ectocranial and endocranial suture closure in anthropoids and Old-World Apes. Am J Anat. 1930;46:315–353. [Google Scholar]
- 4.Melsen B. Time of closure of the spheno-occipital synchondrosis determined on dry skulls: a radiographic craniometric study. Acta Odontol Scand. 1969;27:73–90. doi: 10.3109/00016356909033580. [DOI] [PubMed] [Google Scholar]
- 5.Akhlaghi M, Taghaddosinejad F, Sheikhazadi A, Valizadeh B, Shojaei SM. Age-at-death estimation based on the macroscopic examination of spheno-occipital sutures. J Forensic Leg Med. 2010;17:304–308. doi: 10.1016/j.jflm.2010.04.009. [DOI] [PubMed] [Google Scholar]
- 6.Ingervall B, Thilander B. The human spheno-occipital synchondrosis. I. The time of closure appraised macroscopically. Acta Odontol Scand. 1972;30:349–356. doi: 10.3109/00016357209004602. [DOI] [PubMed] [Google Scholar]
- 7.Melsen B. Time and mode of closure of the spheno-occipital synchrondrosis determined on human autopsy material. Acta Anat (Basel) 1972;83:112–118. doi: 10.1159/000143852. [DOI] [PubMed] [Google Scholar]
- 8.Thilander B, Ingervall B. The human spheno-occipital synchondrosis. II. A histological and microradiographic study of its growth. Acta Odontol Scand. 1973;31:323–334. doi: 10.3109/00016357309002520. [DOI] [PubMed] [Google Scholar]
- 9.Irwin GL. Roentgen determination of the time of closure of the spheno-occipital synchondrosis. Radiology. 1960;75:450–453. doi: 10.1148/75.3.450. [DOI] [PubMed] [Google Scholar]
- 10.Powell TV, Brodie AG. Closure of the spheno-occipital synchondrosis. Anat Rec. 1963;147:15–23. doi: 10.1002/ar.1091470104. [DOI] [PubMed] [Google Scholar]
- 11.Molsted K, Kjaer I, Dahl E. Spheno-occipital synchondrosis in three-month-old children with clefts of the lip and palate: a radiographic study. Cleft Palate Craniofac J. 1993;30:569–573. doi: 10.1597/1545-1569_1993_030_0569_sositm_2.3.co_2. [DOI] [PubMed] [Google Scholar]
- 12.Ericson S, Myrberg N. The morphology of the spheno-occipital synchondrosis at the age of eight evaluated by tomography. Acta Morphol Neerl Scand. 1973;11:197–208. [PubMed] [Google Scholar]
- 13.Bassed RB, Briggs C, Drummer OH. Analysis of time of closure of the spheno-occipital synchondrosis using computed tomography. Forensic Sci Int. 2010;200:161–164. doi: 10.1016/j.forsciint.2010.04.009. [DOI] [PubMed] [Google Scholar]
- 14.Okamoto K, Ito J, Tokiguchi S, Furusawa T. High-resolution CT findings in the development of the sphenooccipital synchondrosis. AJNR Am J Neuroradiol. 1996;17:117–120. [PMC free article] [PubMed] [Google Scholar]
- 15.Sahni D, Jit I, Neelam Suri S. Time of fusion of the basisphenoid with the basilar part of the occipital bone in northwest Indian subjects. Forensic Sci Int. 1998;98:41–45. doi: 10.1016/s0379-0738(98)00135-2. [DOI] [PubMed] [Google Scholar]
- 16.Lottering N, MacGregor DM, Alston CL, Gregory LS. Ontogeny of the spheno-occipital synchondrosis in a modern Queensland, Australian population using computed tomography. Am J Phys Anthropol. 2014;157:42–57. doi: 10.1002/ajpa.22687. [DOI] [PubMed] [Google Scholar]
- 17.Shirley NR, Jantz RL. Spheno-occipital synchondrosis fusion in modern Americans. J Forensic Sci. 2011;56:580–585. doi: 10.1111/j.1556-4029.2011.01705.x. [DOI] [PubMed] [Google Scholar]
- 18.Kerr WJ, Adams CP. Cranial base and jaw relationship. Am J Phys Anthropol. 1988;77:213–220. doi: 10.1002/ajpa.1330770209. [DOI] [PubMed] [Google Scholar]
- 19.Singh GD, McNamara JA, Jr, Lozanoff S. Morphometry of the cranial base in subjects with Class III malocclusion. J Dent Res. 1997;76:694–703. doi: 10.1177/00220345970760021101. [DOI] [PubMed] [Google Scholar]
- 20.Singh GD. Morphologic determinants in the etiology of class III malocclusions: a review. Clin Anat. 1999;12:382–405. doi: 10.1002/(SICI)1098-2353(1999)12:5<382::AID-CA9>3.0.CO;2-0. [DOI] [PubMed] [Google Scholar]
- 21.Guyer EC, Ellis EE, III, McNamara JA, Jr, Behrents RG. Components of class III malocclusion in juveniles and adolescents. Angle Orthod. 1986;56:7–30. doi: 10.1043/0003-3219(1986)056<0007:COCIMI>2.0.CO;2. [DOI] [PubMed] [Google Scholar]
- 22.Sanborn RT. Differences between the facial skeletal patterns of Class III malocclusion and normal occlusion. Angle Orthod. 1955;25:208–222. [Google Scholar]
- 23.McGrath J, Gerety PA, Derderian CA, et al. Differential closure of the spheno-occipital synchondrosis in syndromic craniosynostosis. Plast Reconstr Surg. 2012;130:681e–689e. doi: 10.1097/PRS.0b013e318267d4c0. [DOI] [PubMed] [Google Scholar]
- 24.Baik HS, Han HK, Kim DJ, Proffit WR. Cephalometric characteristics of Korean Class III surgical patients and their relationship to plans for surgical treatment. Int J Adult Orthodon Orthognath Surg. 2000;15:119–128. [PubMed] [Google Scholar]
- 25.Lee YS, Lee SJ, An H, Donatelli RE, Kim SH. Do Class III patients have a different growth spurt than the general population? Am J Orthod Dentofacial Orthop. 2012;142:679–689. doi: 10.1016/j.ajodo.2012.07.009. [DOI] [PubMed] [Google Scholar]
- 26.Sinanoglu A, Kocasarac HD, Noujeim M. Age estimation by an analysis of spheno-occipital synchondrosis using cone-beam computed tomography. Leg Med (Tokyo) 2016;18:13–19. doi: 10.1016/j.legalmed.2015.11.004. [DOI] [PubMed] [Google Scholar]


