Abstract
Objective.
Removal of common mode noise and artifacts from extracellularly measured action potentials, herein referred to as spikes, recorded with multi-electrode arrays (MEAs) which included severe noise and artifacts generated by an ultrahigh field (UHF) 16.4 Tesla MRI scanner.
Approach.
An adaptive virtual referencing algorithm is used to remove artifacts and thus enable extraction of neural spike signals from extracellular recordings in anesthetized rat brains. A 16-channel MEA with 150-micron inter-site spacing is used, and a virtual reference is created by spatially averaging the 16 signal channels which results in a reference signal without extracellular spiking activity while preserving common mode noise and artifacts. This virtual reference signal is then used as the input to an adaptive FIR filter which optimally scales and time-shifts the reference to each specific electrode site to remove the artifacts and noise.
Main Results.
By removing artifacts and reducing noise, the neural spikes at each electrode site can be well extracted, even from data originally recorded with a high noise floor due to electromagnetic interference and artifacts generated by a 16.4T MRI scanner. The adaptive virtual referencing method enables many more spikes to be detected than would otherwise be possible. Further, the filtered spike waveforms can be well separated from each other using PCA feature extraction and semi-supervised k-means clustering. While data in a 16.4T MRI scanner contains significantly more noise and artifacts, the developed adaptive virtual referencing method enables similar data quality to be extracted as recorded on benchtop experiments outside the MRI scanner.
Significance.
Adaptive virtual referencing of extracellular spike signals recorded with MEAs has not been previously reported and fills a technical need by enabling low-noise extracellular spike extraction in noisy and challenging environments such as UHF MRI that will enable further study of neuro-vascular coupling at UHF.
Keywords: adaptive filter, common average reference, extracellular recording, MRI, ultrahigh field, virtual reference
1. Introduction
Recording extracellular neural signals with penetrating microelectrodes provides information about local neural activity and communication patterns. Often, the extracellular recording is analyzed in the context of the local field potential (LFP), and the spiking or unit activity. The LFP is comprised of the superposition of all ionic processes, but is primarily attributed to synaptic activity of dendrites in regions where cellular structure and organization generates electric dipoles, for example in the mammalian cortex [1]. LFP signals are usually lowpass filtered with an upper cutoff frequency in the range of 100–300 Hz to remove the high frequency unit activity from the signal. Conversely, extracellular spiking or unit activity is generated by action potentials of multiple (multiple unit activity: MUA), or isolated single (single unit activity: SUA) neurons and is generally band pass filtered in the range of several hundred to several thousand (e.g. 300 – 3000) Hz [2,3].
The extracellularly recorded unit activity (spiking activity) provides direct information about the fundamental ‘unit’ of neural communication, namely individual neurons. The distance over which spiking activity can be recorded is limited and has been estimated to be less than approximately 130–140 microns [3,4]. Therefore, in the general case when neuronal firing is not strongly synchronized, the extracellular spiking signal is spatially local and represents the activity of neurons within a radius of approximately 140 microns from the recording site. Note that synchronous firing of many neurons is possible, for example in response to strong electrical stimulation [5], but this is generally not the case for most physiological conditions. Neurons located very near the recording site are capable of producing extracellular voltage deflections on the order of several hundred microvolts. However, more distant neurons may generate waveforms with peak amplitudes of approximately only tens of microvolts. Therefore, a low background noise level is desired to more clearly observe spiking activity of the local neural population.
The background noise may be made up of physiological and non-physiological sources. For example, distant neuronal firing contributes to the background noise level [3], but electromagnetic noise from nearby hardware and equipment, high order harmonics of powerline (50/60 Hz) noise, and motion or other artifacts can contribute as well. For example, we observed strong electromagnetic noise from gradient amplifier hardware in the bore of a 16.4T animal research magnetic resonance imaging (MRI) scanner, and MRI scanner operation introduces large artifacts due to time-varying magnetic fields. Researchers aiming to record high quality extracellular spiking activity must dedicate significant effort to denoising their extracellular recording setup, and such effort is warranted. However, researchers would also benefit from intelligent filtering methods to reduce the noise level in cases of data acquired with an imperfect setup, and to achieve lower noise levels than possible from experimental setup refinement alone.
Several noise reduction approaches for extracellular spike data recorded using multi-electrode arrays (MEAs) that have been previously reported in the literature deserve introduction. One simple approach is differential referencing, where the signal recorded on a nearby reference electrode is subtracted from the extracellular spike signal recorded on the recording electrode. This method is available in some commercial neural recording software packages, with the option of allowing adaptation on the reference signal to better fit the data recorded on the recording electrode. In general, this approach involves trial-and-error and is somewhat problematic; only one channel is used as a noise reference. If the reference contains neural signal that is present on the channel of interest, it will be reduced or removed from the recording; conversely, if it contains neural signals that are not present on the recording electrode, they will be flipped and ‘added’ to the recording.
A better approach for reducing noise from extracellular spike recordings MEAs is virtual referencing (VR) [6]. A virtual reference is formed by averaging the information from all the available recording sites, generating a common mode signal. Assuming adequate inter-electrode spacing, the common mode signal is unlikely to contain neural spiking information [6]. The virtual reference has been used as a differential reference to subtract common mode noise from the data. This is essentially an implementation of the common average reference (CAR) [7] which improves on simple differential referencing and works well when the noise amplitude is consistent across the recording channels, but suffers from the drawback of providing a single reference for all channels, rather than a unique one for each channel. Therefore, if the noise level varies across the channels, VR/CAR will subtract too much noise from some channels, and not enough noise from others.
This paper presents a new method for denoising extracellularly recorded spikes and shows its utility on both the benchtop and in the magnet bore of a 16.4T MRI animal research scanner and during a functional MRI (fMRI) scan using inner volume-gradient and spin echo (iv-GRASE) MRI sequence [8]. The motivation for simultaneous recording of extracellular spike waveforms and fMRI at 16.4T is to enable further study of the neuro-vascular relationship with high spatial resolution at ultrahigh field. A virtual reference is computed as the spatial average from 16-channel MEAs with 150-micron inter-site spacing. In agreement with the arguments made in [6] and from estimates of the recording radius of spike activity with a microelectrode [3,4], the virtual reference is unlikely to contain significant extracellular spiking activity information. The virtual reference is used as the input to an adaptive filter using a least-mean-squares (LMS) update equation to generate a unique reference from the common mode signal for each individual channel. The computations are done in matrix form on all channels at once to improve computational efficiency. Keeping the previously used terminology within the field of extracellular spike recording [6], we refer to this new method as adaptive virtual referencing (AVR). This idea has been reported previously for physiological recordings including electrocorticographic (ECoG) [9], electromyographic (EMG) [10], and even LFP recordings [11], and referred to as adaptive common average referencing (ACAR). However, such an approach has not been reported in the case of extracellular spike activity and not in the context of MRI-related noise removal from spiking activity. In order to apply AVR/ACAR, the noise and artifacts should be common mode and the underlying neurophysiological process should not be synchronous across channels. We found these conditions to hold for the extracellular recordings of spontaneous unit activity in the rat cortex under anesthesia with electrode inter-site spacing of 150 microns.
The methods presented in this paper could also benefit additional experimental conditions and applications beyond recordings made in UHF MRI, such as recording electrophysiological signals from MEAs in freely moving animals, real-time denoising of neural activity in human surgical operating theaters, and real-time brain machine interface (BMI) applications.
Real-time applications will require suitable online spike extraction and classification approaches, which have been developed by others [12–15]. Fast spike signal detection and classification by template matching with suitable basis functions was demonstrated for MUA recorded with a single microwire electrode many decades ago [12]. Methods suitable for unsupervised neural spike sorting in real-time from high-density MEAs have also been previously reported. Aksenova et al. demonstrated a method based on phase space trajectory estimation [13], which was later applied to neural recordings in the subthalamic nucleus (STN) of Parkinsonian patients during deep brain stimulation (DBS) surgery [14]. More recently, a discriminative template matching approach capable of suppressing interfering spikes was shown to provide superior signal-to-peak-interference ratio (SPIR), with aim towards online sorting of high-density neural probe recordings taken from MEAs of ever-increasing density [15].
The trend of increasing neural probe site density and number of recording channels requires continuous improvements in methods for processing and analyzing the multi-channel recording data, specifically methods with low computational complexity that can be implemented in real-time for applications such as human surgical theatre recordings and BMIs. The method presented in this paper is a computationally efficient implementation of adaptive filtering which is suitable for real-time use. Adaptive filters have been used extensively in the field active noise cancellation (ANC), which requires rapid computation and estimation in order to generate anti-noise signals to cancel incoming noise in real-time [16].
2. Methods
2.1. Animal Preparation
Acute benchtop experiments were performed in 5 rats (N = 5, Sprague-Dawley, female, 294 ± 28 g). Anesthesia was induced using 5% isoflurane in an induction chamber followed by oral intubation. Afterwards, a femoral venous line was placed, and the wound was closed. Subsequently, rats were placed in a stereotaxic frame and anesthesia was reduced to 2% isoflurane. Animals were mechanically ventilated, and their EtCO2 levels and body temperature were closely monitored and maintained. A craniotomy (bilateral in 4 of 5 rats) was made over the sensory/motor cortex (approximately 0 mm anterior, 3 mm lateral from bregma). Electrodes (NeuroNexus – 1×16, recording site diameter 15 or 30 microns, site spacing 150 microns) were advanced into the cortex using a manual mechanical microdrive. Reference and ground wires were positioned in either an additional craniotomy several mm posterior to bregma, or in the exposed tissue around the skull, depending on which arrangement provided better noise reduction. In 4 of the 5 rats, pancuronium muscle paralyzer (0.1mg/kg bolus + 0.1mg/kg/h infusion) was administered followed by 50 mg/kg bolus of morphine and 25 mg/kg/hr infusion to transition from isoflurane to morphine anesthetic for brain activity modulation. At the end of the experiment, the rats were terminated by potassium chloride (KCl) injection.
Chronic implantations were performed in 2 rats (N = 2, Sprague-Dawley, female, 252 g and 267 g at surgery) following typical aseptic procedures. Prior to surgery, electrodes and surgical instruments were sterilized by ethylene oxide gas or autoclave. Anesthesia was induced with 5% isoflurane in an induction chamber. Afterwards, rats were orally intubated and placed in a stereotaxic frame. Anesthesia was reduced to 2% isoflurane for the duration of the surgery, and animal respiration and body temperature were monitored and controlled by a ventilator and heated water bath. Hair was removed, the surgical site was cleaned, and the skull was exposed. A craniotomy (0.5 mm diameter) was performed over the sensory/motor area of the cortex (approximately 0 mm anterior, 3 mm lateral from bregma) and a second craniotomy was made several mm posterior to the first for reference and/or ground wire contact. An MR-compatible multielectrode array (NeuroNexus – 1×16, recording site diameter 15 microns, site spacing 150 microns) was advanced into the cortex approximately 2 to 2.5 mm from the brain surface and fixed in place using dental cement. Analgesics were given prior to and for 3 days post-surgery. A one-week recovery period was allowed prior to subsequent experiments.
For subsequent experiments in chronically implanted rats, anesthesia was induced with 5% isoflurane in an induction chamber, followed by fixing the head by bite bar and ear bars and providing isoflurane anesthesia through a nosecone. Anesthesia was reduced for the duration of the experiment and was varied between 1% and 2% to alter brain activity. Again, animal breathing and body temperature were monitored and controlled.
All animal procedures were approved by the Institutional Animal Care and Use Committee (IACUC) at the University of Minnesota.
2.2. Benchtop Testing
Benchtop recordings were taken in both acute and chronically implanted rats in a stereotaxic frame with the head fixed by ear bars and a bite bar. Recordings were referenced to a local reference wire on the implanted electrodes and the stereotaxic frame served as ground. Data were acquired at 30 kHz with a Cerebus system (Blackrock Microsystems) with 0.25 microvolt/bit resolution. Brain activity was modulated by altering the anesthetic depth during the experiment. This was accomplished by changing the concentration of isoflurane provided, or in several acute studies by transitioning from isoflurane to morphine. In one acutely implanted rat, the electrode was advanced in 50 micron increments over a 600-micron range to observe the spatial localization of multi-unit activity waveforms.
2.3. Recording in a 16.4T MRI Scanner
Multiple experiments were performed to test MUA recording capabilities in the bore of a 16.4T MRI scanner (Varian/Magnex 26cm bore). Recordings were again made with a Cerebus system using 0.25 microvolt/bit or 2 microvolt/bit resolution depending on the experiment being performed. One of the chronically implanted rats (N = 1) underwent multiple recording and MRI scanning sessions over a period of several months. For each experiment, the rat was anesthetized with isoflurane (1–2%) and placed in an MRI-compatible cradle with the head fixed. The RF shield of the MRI scanner room served as ground for the recording system.
A variety of experiments were performed that included testing the recording capabilities of the system on the benchtop inside the scanner room but outside of the magnet bore at 0.25 microvolt/bit and 2 microvolt/bit resolution immediately prior to testing inside the bore. These recordings provided a reference for analyzing signal quality in the bore. Similar testing was performed inside the scanner bore at 16.4T, with and without power supplied to various scanner hardware including radiofrequency (RF) and gradient amplifiers. Finally, recordings were made during scanning using inner volume-gradient and spin echo (iv-GRASE) method with (TR = 2000ms, TE = 14.34ms, FOV = 16×12×8mm3, matrix = 64×48×16, and two segments along first phase encoding direction, repetition = 206) as a proxy for fMRI scanning.
2.4. The Adaptive Virtual Reference Filter
An adaptive virtual (common average) reference filter was implemented in data post-processing to reduce common mode noise and artifacts in multi-channel MUA data. The 16-channel neural recording data obtained from a single 16-channel multi-electrode array were processed together. First, data were filtered into the unit activity frequency range (generally 300 – 6000 Hz) using high-order zero-phase FIR filtering. Subsequently, a virtual (common average) reference was generated by taking the spatial average of the filtered 16-channel data. The virtual reference was used in a multi-input multi-output (MIMO) adaptive filtering algorithm to estimate common mode signal (including artifacts and noise) on each of the 16 channels and remove it to generate a cleaned signal from each channel. The necessary equations are presented in Equations (1) – (5), and are a matrix-form implementation of the standard adaptive LMS filter algorithm presented by Widrow et al. [17] and discussed in detail in the book by Kuo and Morgan [16]. A block diagram of the approach is presented in Figure 1a, where D is an input matrix containing the multi-channel data, Y is the channel-specific noise (common mode signal) estimate, and E is an output matrix containing the multi-channel data after common mode signal removal.
Figure 1.
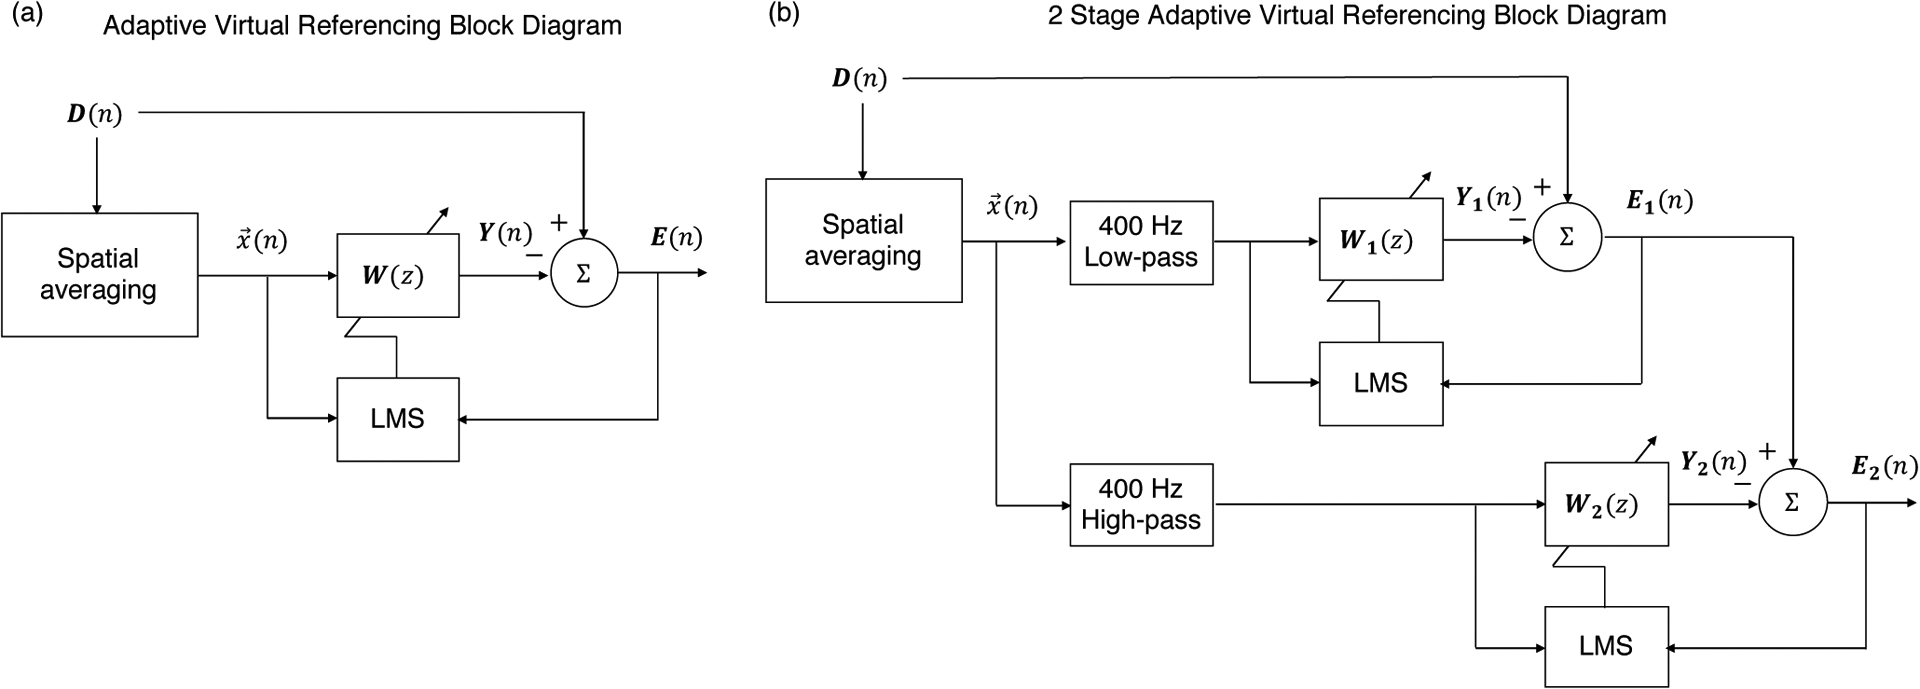
(a) Block diagram of adaptive virtual reference filter where D is a matrix containing the multi-channel data, x(n) is the spatial average (virtual reference). W is a matrix of weights transforming the spatial average x(n) into the estimated noise signal on each channel Y(n). Y(n) is subtracted from D(n) to generate the neural MUA signal estimate on each channel E(n). W(z) is updated by an LMS algorithm using x(n) and E(n). (b) Block diagram for 2 stage filtering arrangement.
D is the [N×K] matrix of multi-channel data with each channel a column vector of length N where N is the number of samples and K is the number of channels.
| (1) |
Note that D is [N×K] and D(n) are the [1×K] rows of D. Y, and E are similar to D in this sense.
is a L×1 vector containing the L most recent spatial averages of the K channels
| (2) |
W(n) is an [L×K] matrix of coefficients to transform into Y(n) [1×K], the estimate of the common mode signal on each channel.
| (3) |
The filtered data E(n) [1×K] is computed by:
| (4) |
W [L×K] is updated by:
| (5) |
where μ is the step size scalar that controls filter convergence speed and steady state error. A MATLAB script containing our implementation of these equations is available at https://github.com/ccruttenden/adaptive-virtual-referencing.
For benchtop recording data we used a 12-coefficient filter (12 coefficients per channel) with step-size 1e-6. For recording in the bore of the 16.4T MRI scanner, we used 2 adaptive filter stages each with 12 coefficients per channel and step-size of 1e-6. The first stage used the virtual reference after low-pass filtering at 400 Hz, and the second stage used the virtual reference after high-pass filtering at 400 Hz. This was done to separate the filtering of distinct interferences (respectively below and above approximately 400 Hz) observed in the bore of the 16.4T scanner. This arrangement is depicted in Figure 1b.
The use of 2-stage filtering with the reference signal separated into two different frequency bands (below 400 Hz and between 400 – 3000 Hz) provides two advantages compared to a single-stage filter:
Each stage needs only a 12-tap length filter. Combining removal of both the high and low frequency artifacts at one filter would need a much longer length filter resulting in slow convergence time.
Different time steps (adaptation gain) can be used in the two filters with each gain optimized for the different amplitudes of the two types of artifacts (motion artifacts at low frequencies and the gradient artifacts at the high frequencies).
Finally, when recording with 2 microvolt/bit resolution in the magnet bore with all scanner hardware powered on and enabled, we first filtered MUA activity into a passband of 300–3000 Hz rather than 300–6000 Hz due to additional high frequency noise in the recorded signal. This modification is discussed in the subsequent results and discussion sections of this paper.
2.5. Comparison with Other Denoising Methods
Several alternative denoising approaches were performed for comparison with adaptive virtual referencing. After zero-phase high-pass FIR filtering the data, virtual referencing, scaled virtual referencing (SVR), and zero-phase component analysis (ZCA) whitening were also performed.
Virtual referencing was implemented by direct subtraction of the common average signal from the 16-channel recording. SVR followed the same approach, but the virtual reference was uniquely scaled to each channel. A single unique scalar multiple, stored in the vector , was applied for the two-minute recording duration. The scalars were computed to minimize the LMS error by Equation (6), where is the 16-channel virtual reference for all samples in the two-minute trial.
| (6) |
ZCA whitening was performed on two-minute data segments as well. The variables (16 MEA channels) were centered by removing their mean values and subsequently the covariance matrix was formed. Then, eigenvalue decomposition of the covariance matrix was used to generate the PCA whitening matrix, which transforms the data by rotation to align the basis with the principal axes (given by the eigenvectors of the covariance matrix), and scaling to create unit variance of each variable (principal component) in the new orthogonal basis. ZCA whitening is accomplished by undoing the rotation after scaling to unit variance, such that the ZCA whitened data are decorrelated with unit variance but are as close to the original data basis (variables) as possible.
ZCA whitening involves scaling the data such that noise level comparison with the virtual referencing based denoising techniques is not appropriate. Therefore, rather than comparing noise level, we normalized the datasets σn by given by Equation (8) to have the same unity noise levels and then compared the spike waveform peak heights. This provides a way to evaluate peak-to-noise ratio fairly by normalizing the noise levels.
2.6. Spike Detection, Feature Extraction, and Clustering
Spikes were detected using a threshold based on the signal noise level as in Equation (7), with σn the estimated signal noise level and a as a scaling factor typically 3–5 (we used a = 3.5) [18,19].
| (7) |
| (8) |
A short window of data (2 ms) around each detected spike was saved for feature extraction and clustering. Principal component analysis (PCA) was used to extract waveform features for subsequent k-means clustering (50 replicates, randomly initialized centroids, squared Euclidean distance). The first five principal components were considered. Clustering was semi-supervised, with manual selection of the number of clusters in each data trial (generally two-minutes). The output clusters were manually combined when multiple clusters were separated by k-means corresponding to small amplitude waveforms that substantially overlapped. More details about this approach, as well as alternatives, are presented in the review papers by Lewicki [2] and Rey et al. [3].
3. Results
3.1. Spatial Localization of Extracellular MUA
The spatial localization of the extracellularly recorded MUA signal is critical to our adaptive virtual referencing approach of denoising the MUA signal. The recording radius of microelectrodes used for extracellular recording of spikes has been estimated to be less than 130–140 microns [3,4]. While this estimate may be based on tetrode-style microelectrodes [4], we assume that it is approximately accurate for multi-electrode arrays with small recording site diameters, e.g. 15 microns, such as used in this study.
We demonstrate the spatial localization properties of MUA signals from the cortex of an anesthetized rat in Figures 2 – 4. The 16-channel MUA signal (band-pass filtered 300–6000 Hz) is presented as a function of distance from a datum near the skull surface in Figure 2 (a). The figure shows that in this case, most of the MUA is located on the channels from 1850 to 2900 microns from the datum. Figure 2 (b) shows a zoomed view of 3 of the channels with large amplitude MUA. From this view, we can see that the shape and timing of recorded spikes are different across the 3 adjacent channels that are separated by 150 microns.
Figure 2.
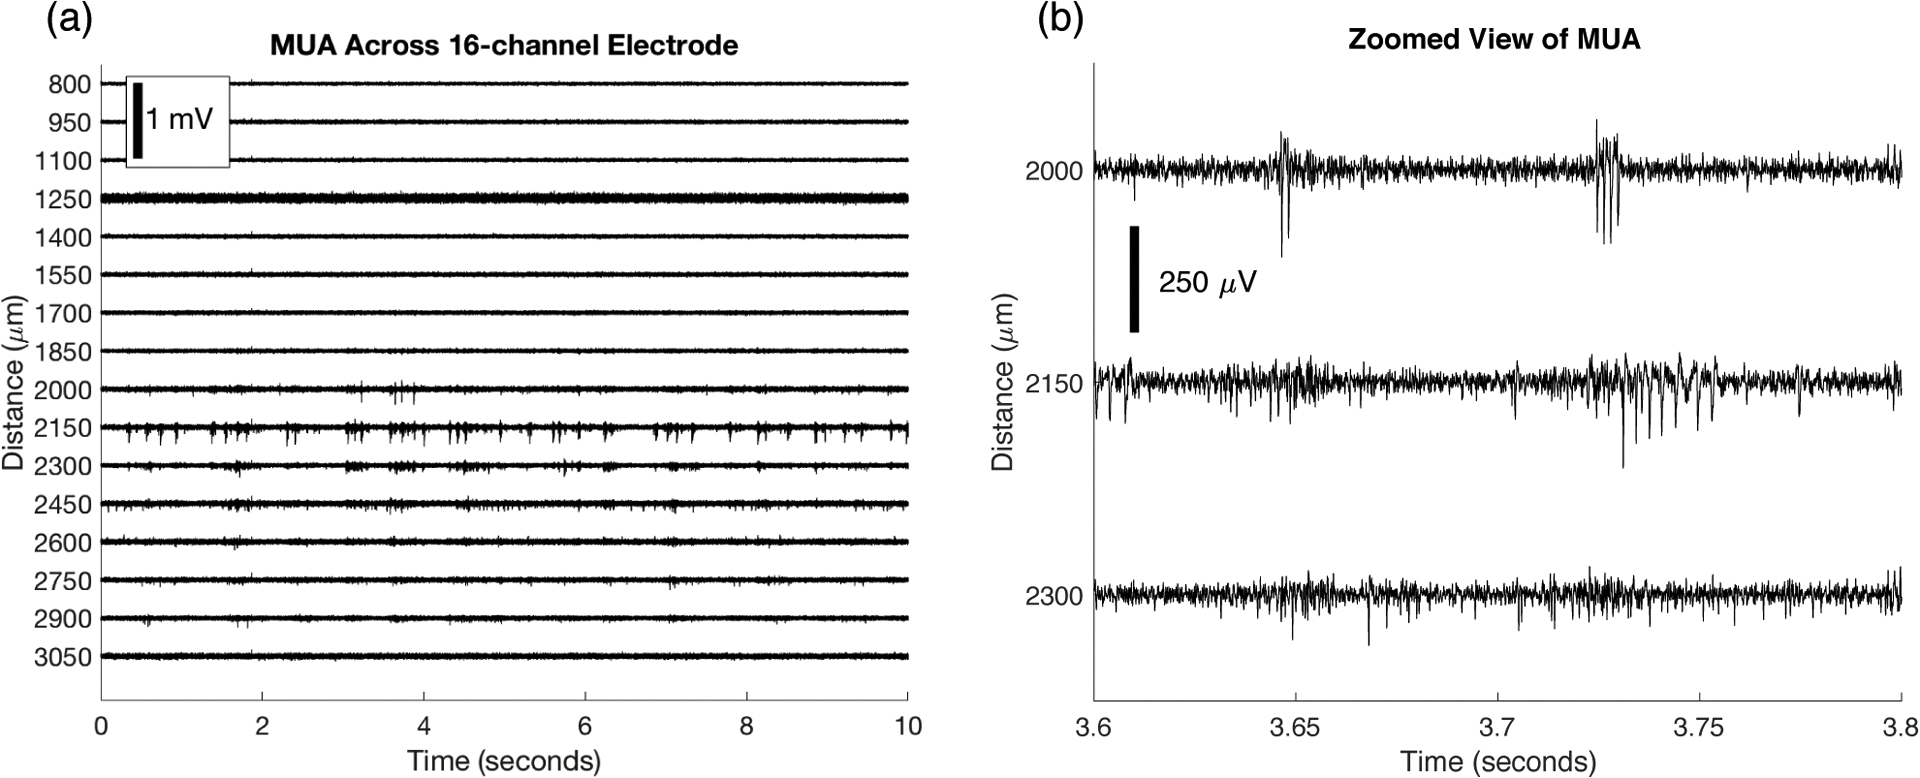
(a) Multi-unit activity (MUA) recorded across a 16 channel multi-electrode array with site spacing 150 microns. The y-axis indicates the distance of each recording site from a datum near the skull surface. (b) Zoomed view of 3 channels with large amplitude spikes shows that the MUA is localized to each channel (MUA spike timing and shape differs across the channels).
Figure 4.
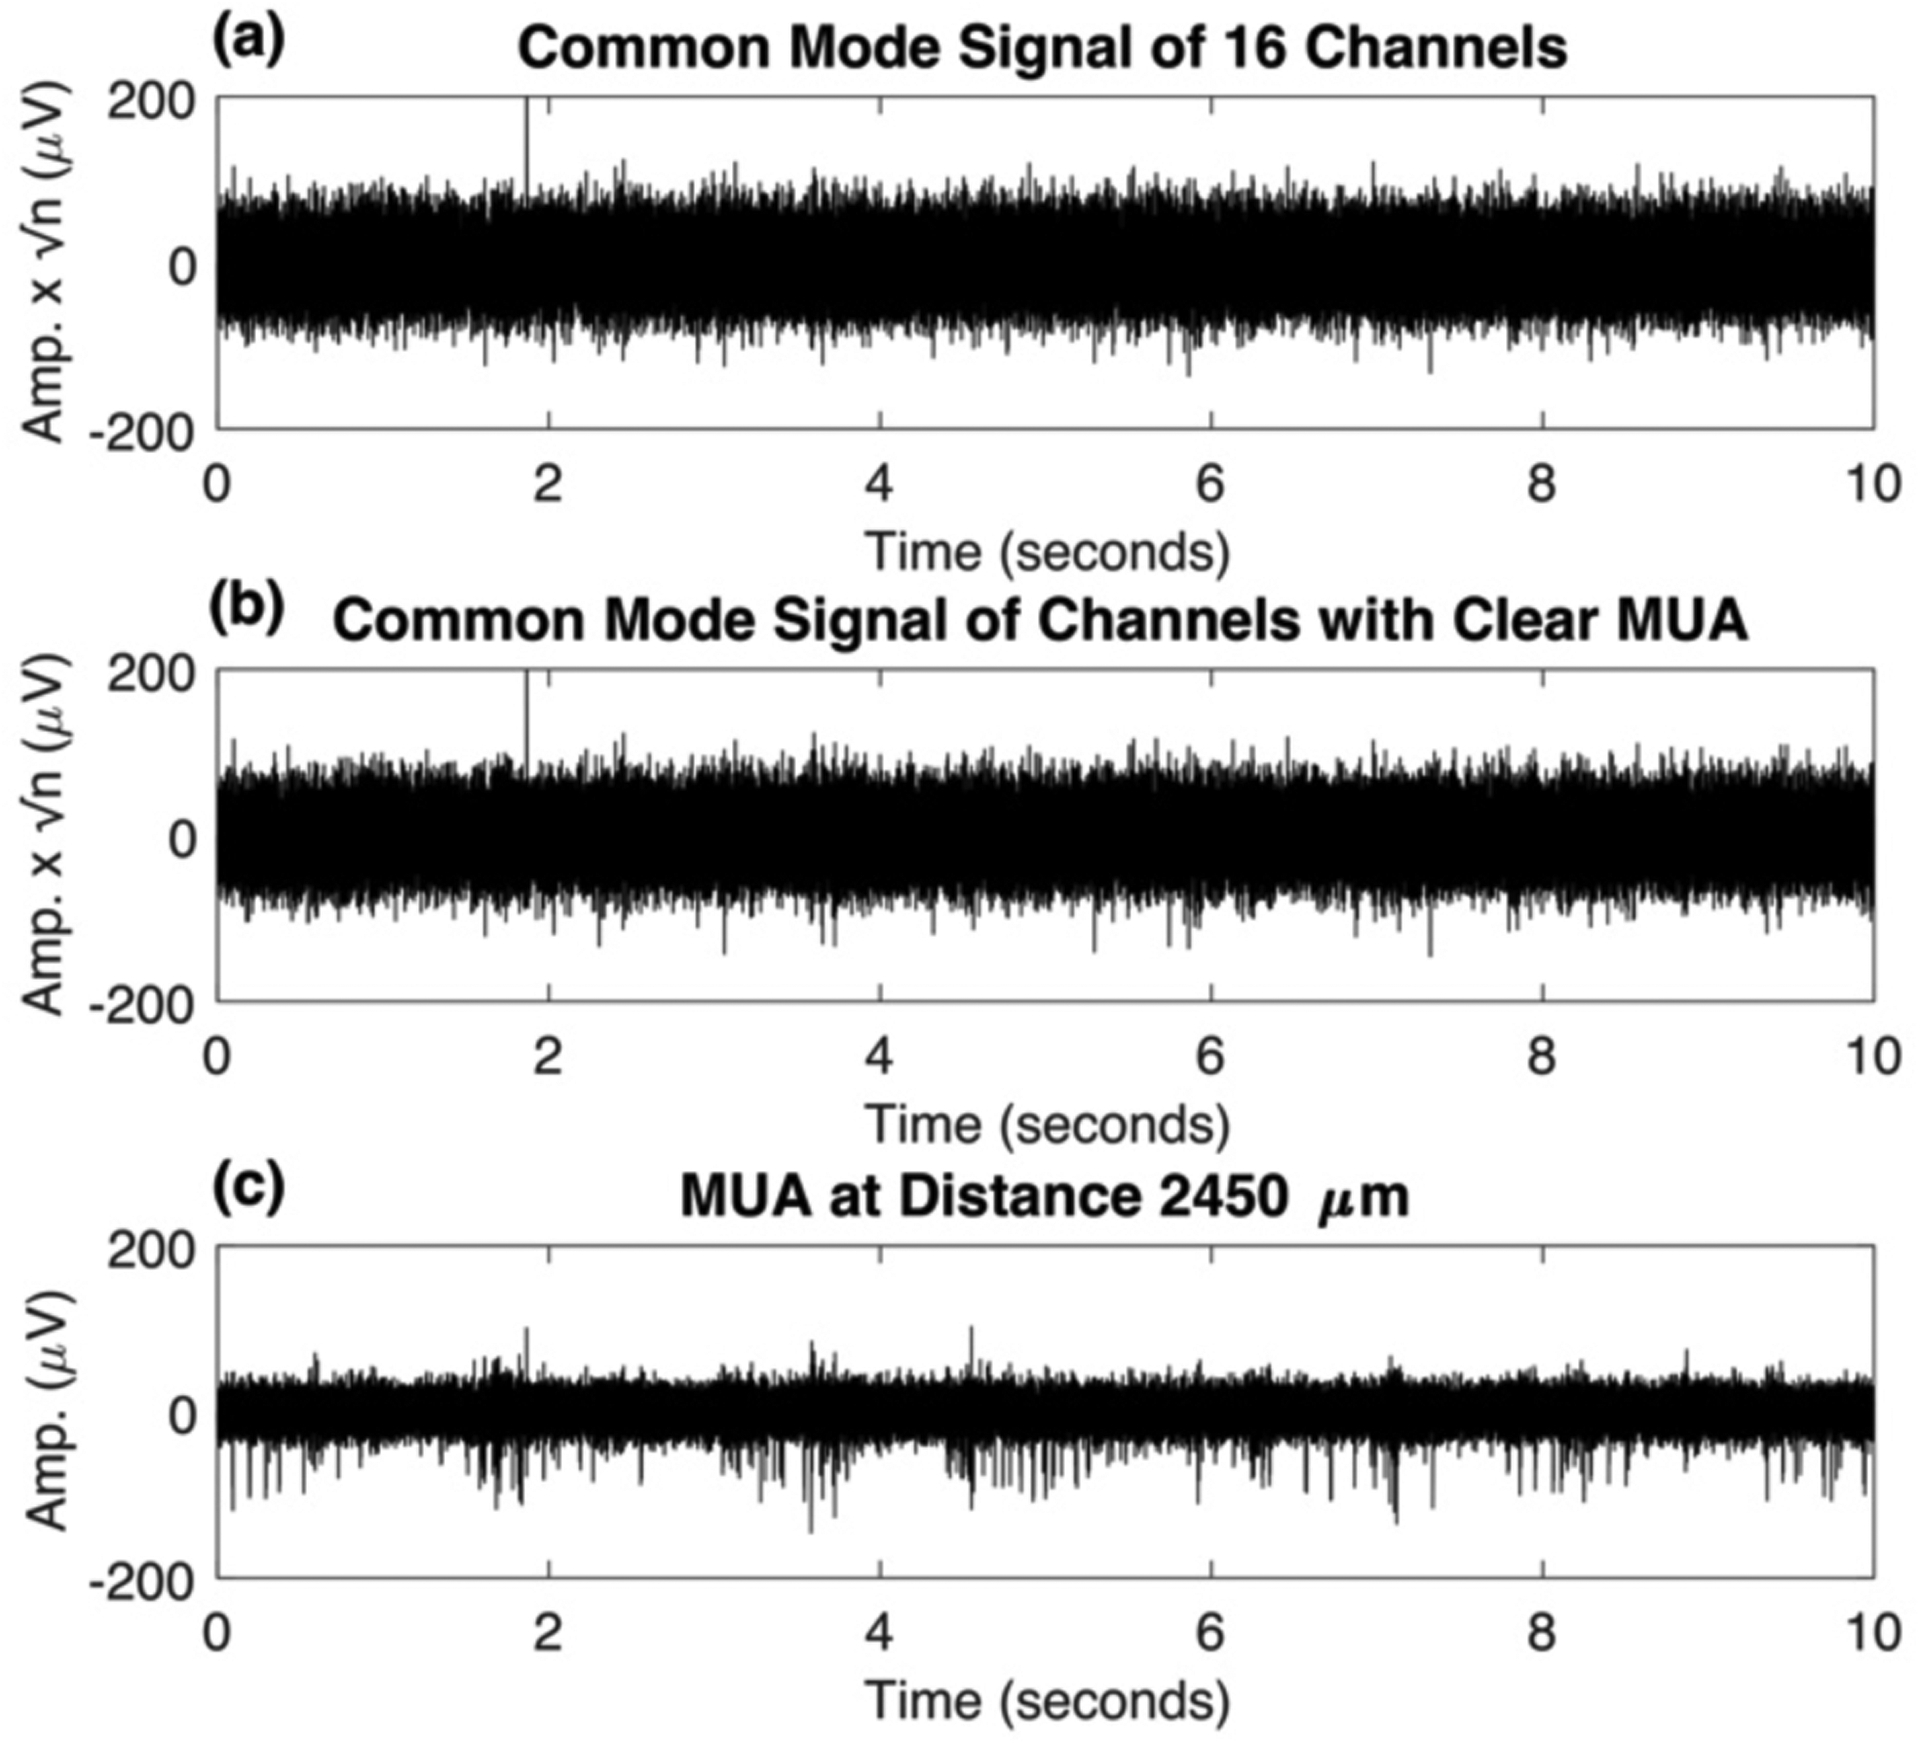
(a) Common mode signal across 16 channels – averaging across 16 channels removes spikes from the signal. (b) Common mode signal of 9 channels with clear MUA – even if all channels used for averaging have MUA, the spikes will be removed so long as enough channels are averaged. In general, all available channels should be included to isolate common mode noise and artifacts from MUA. (c) MUA from a single channel for comparison.
Figure 3 provides more insight about the spatial localization of the MUA waveforms. The multi-electrode array was advanced through the cortex in 50-micron increments and recordings were made at each electrode placement. The largest amplitude waveforms recorded on each site within the tissue located from 1900 – 2400 microns from the datum are plotted for 4 different electrode placements in Figure 3 (a) – (d). The results show that even moving the electrode 50 microns dramatically alters the amplitude of a recorded spike, which is depicted in Figure 3 (e) by plotting the absolute peak height as a function of recording depth. After moving the electrode by 150 microns (the recording site spacing), we see the same waveforms (d) as in the initial position (a), at the same depths but on the next electrode recording site (i.e. site 6 in (d) matches site 5 in (a), etc.).
Figure 3.
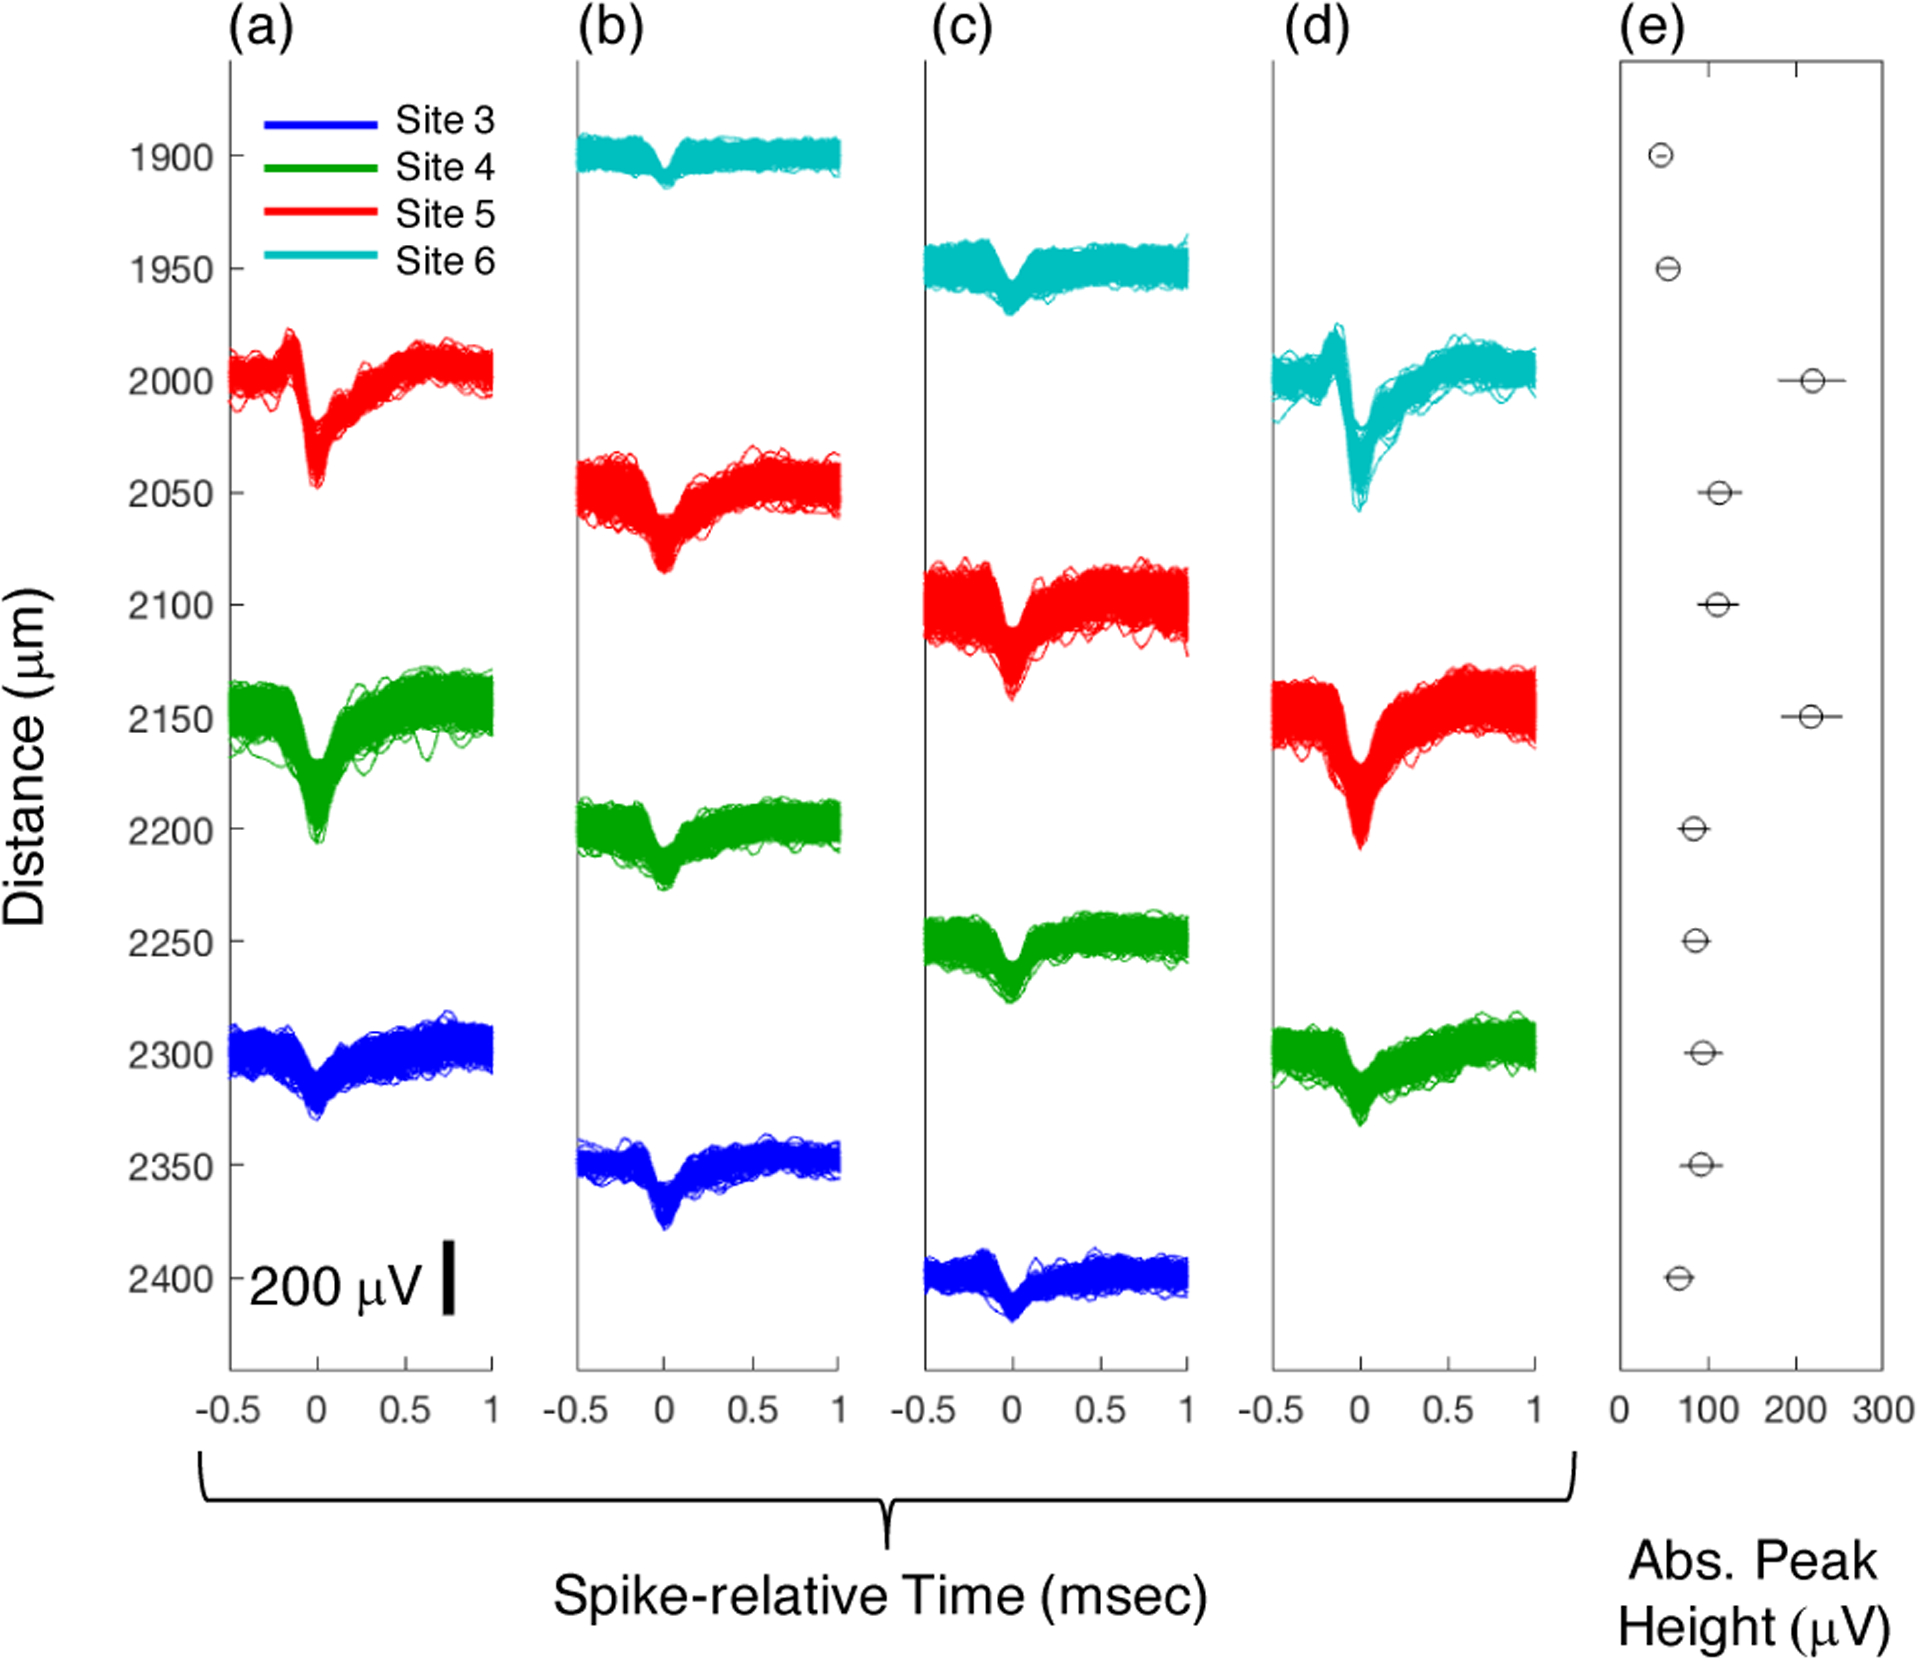
(a-d) Aligned spike waveforms of the largest amplitude spikes at different cortical depths. Color coding indicates electrode recording site. The multi-electrode array was advanced in 50-micron increments. As the electrode was advanced, the largest waveform observed on each channel changed, demonstrating the limited distance over which spikes can be recorded from individual neurons. After 150 microns of advancement (from a to d) the original waveforms are observed at the same depths, but on different electrode recording sites. (e) The mean and standard deviation of the absolute peak height for the largest waveforms across the cortical depths. The largest amplitude spikes were observed at 2000 and 2150 microns from the datum.
Finally, in Figure 4 we show that taking the spatial average of the 16-channels from the multi-electrode array reduces the signal from 300–6000 Hz dramatically to the point that it appears to contain only noise. Specifically, it contains the common mode noise and artifacts that are present across the 16 channels. Even if only channels containing MUA are averaged as in Figure 4 (b), the MUA signal is still removed. Generally, all available channels should be included in the spatial average unless there is a clear reason to exclude it (e.g. an outlier containing significantly different noise/signal). The MUA signal from a single channel at the same voltage and time scale is shown in Figure 4 (c) for comparison.
3.2. Benchtop Testing
Adaptive virtual referencing on benchtop data using the algorithm depicted in Figure 1 (a) generally resulted in a reduction in spike detection threshold (noise reduction), as well as an increase in the number of detected spikes based on thresholding. Reduction in spike detection threshold that is based on the estimate of the background noise level is expected since our goal is to reduce the level of common mode noise and artifacts in the multi-channel recording. A consequence of the lower spike detection threshold is that additional spikes with small amplitude waveforms are detected, increasing the total number of detected spikes. Before filtering, these spikes were below the detection threshold and perhaps even below the noise floor. These results are presented in Figures 5–8.
Figure 5.
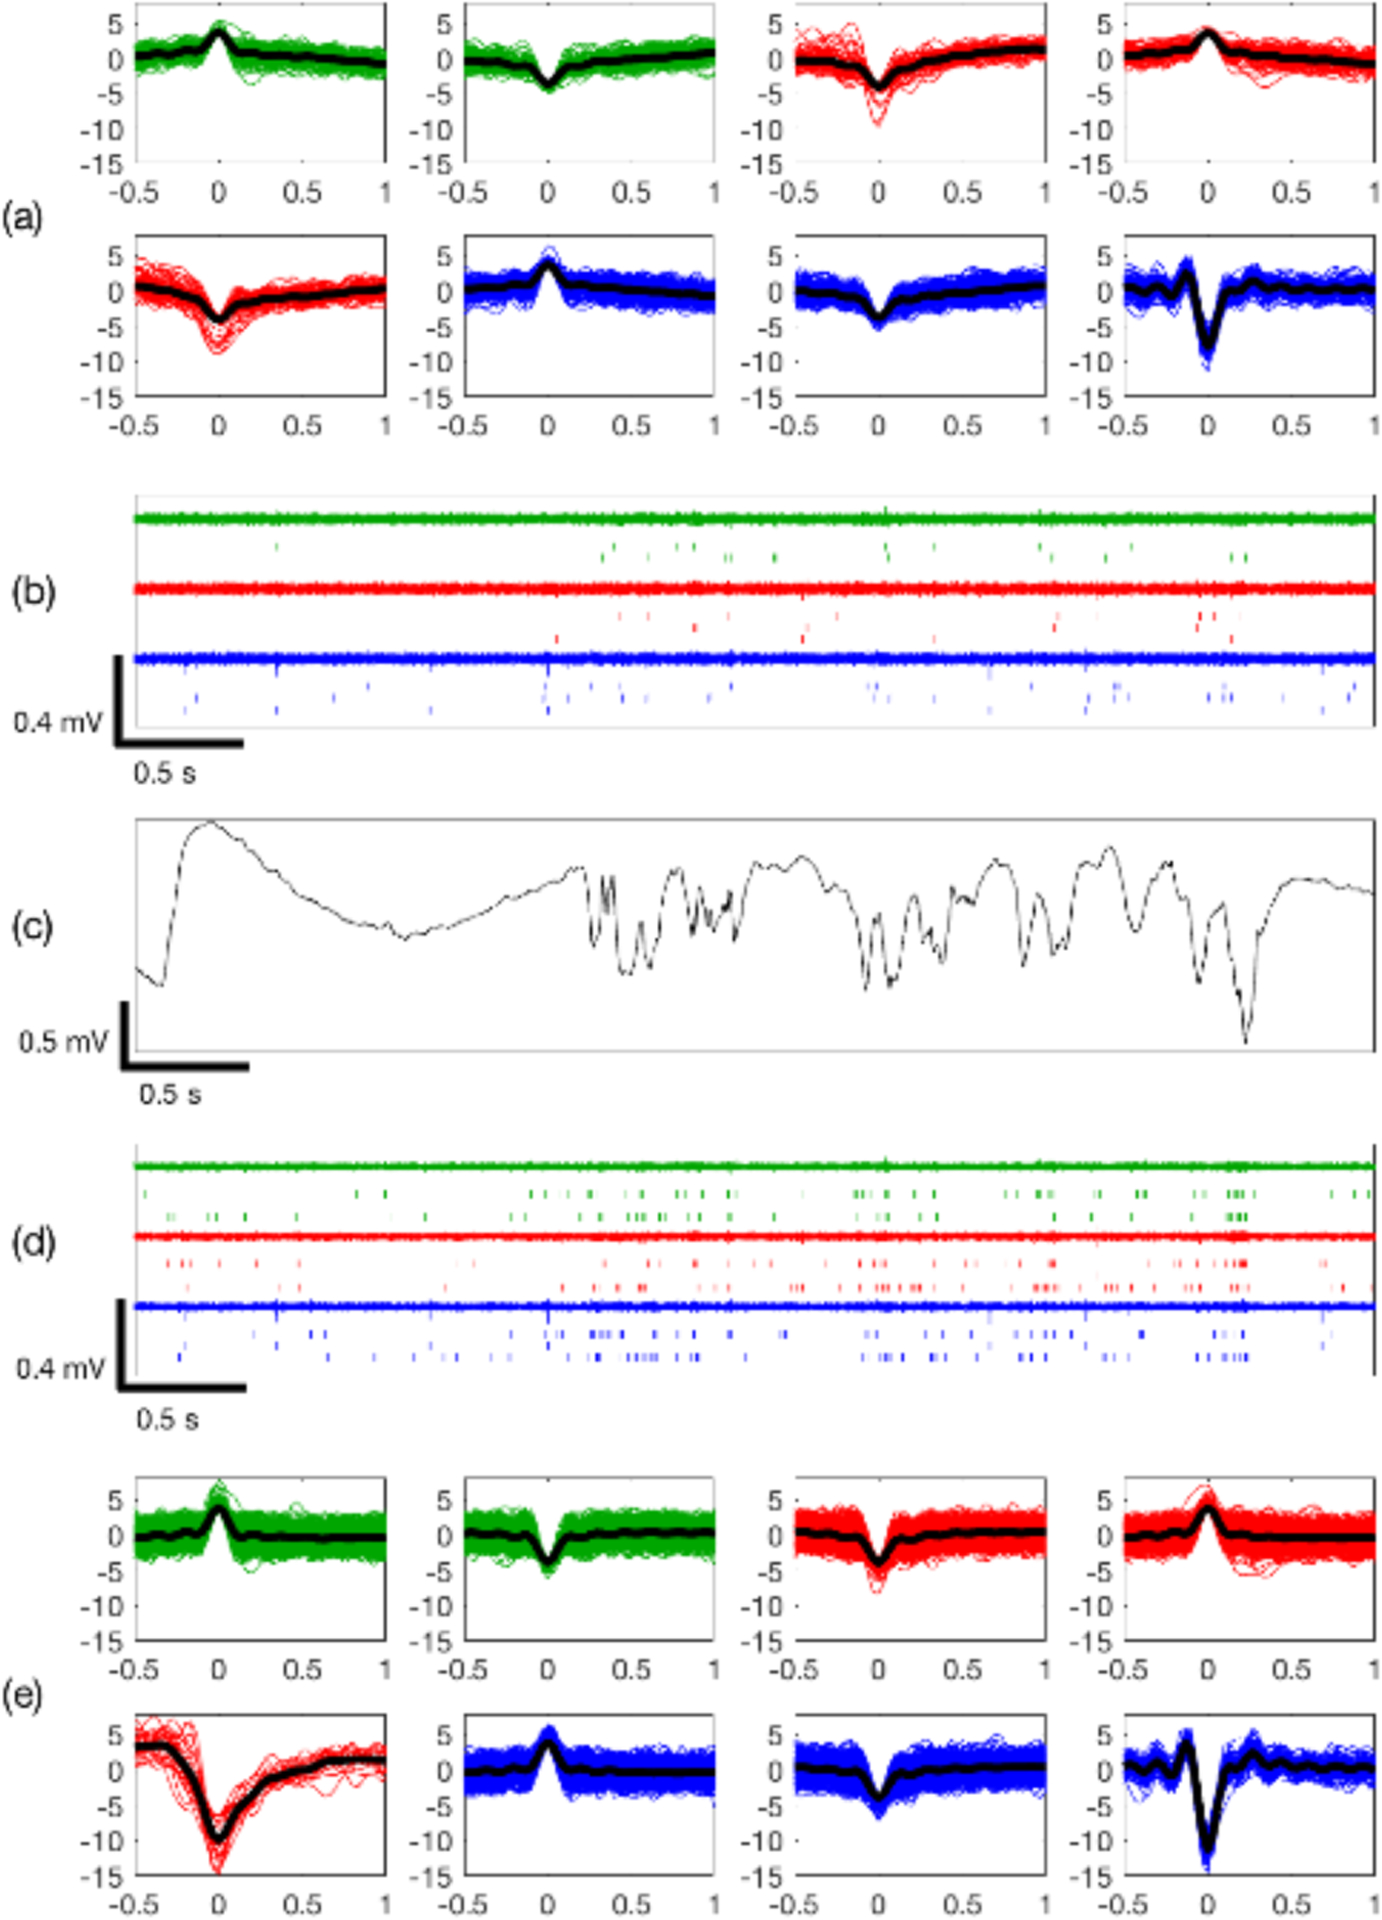
Comparison of adaptive virtual referencing on benchtop data recorded from three adjacent electrode channels. Electrode recording sites indicated by color coding. (a) Clustered spike waveforms and (b) raster plot of detected spikes before adaptive virtual referencing. (c) Local field potential. (d) Raster plot and (e) clustered spike waveforms are improved after adaptive virtual referencing to remove noise. Classification was performed on two-minute duration recordings.
Figure 8.
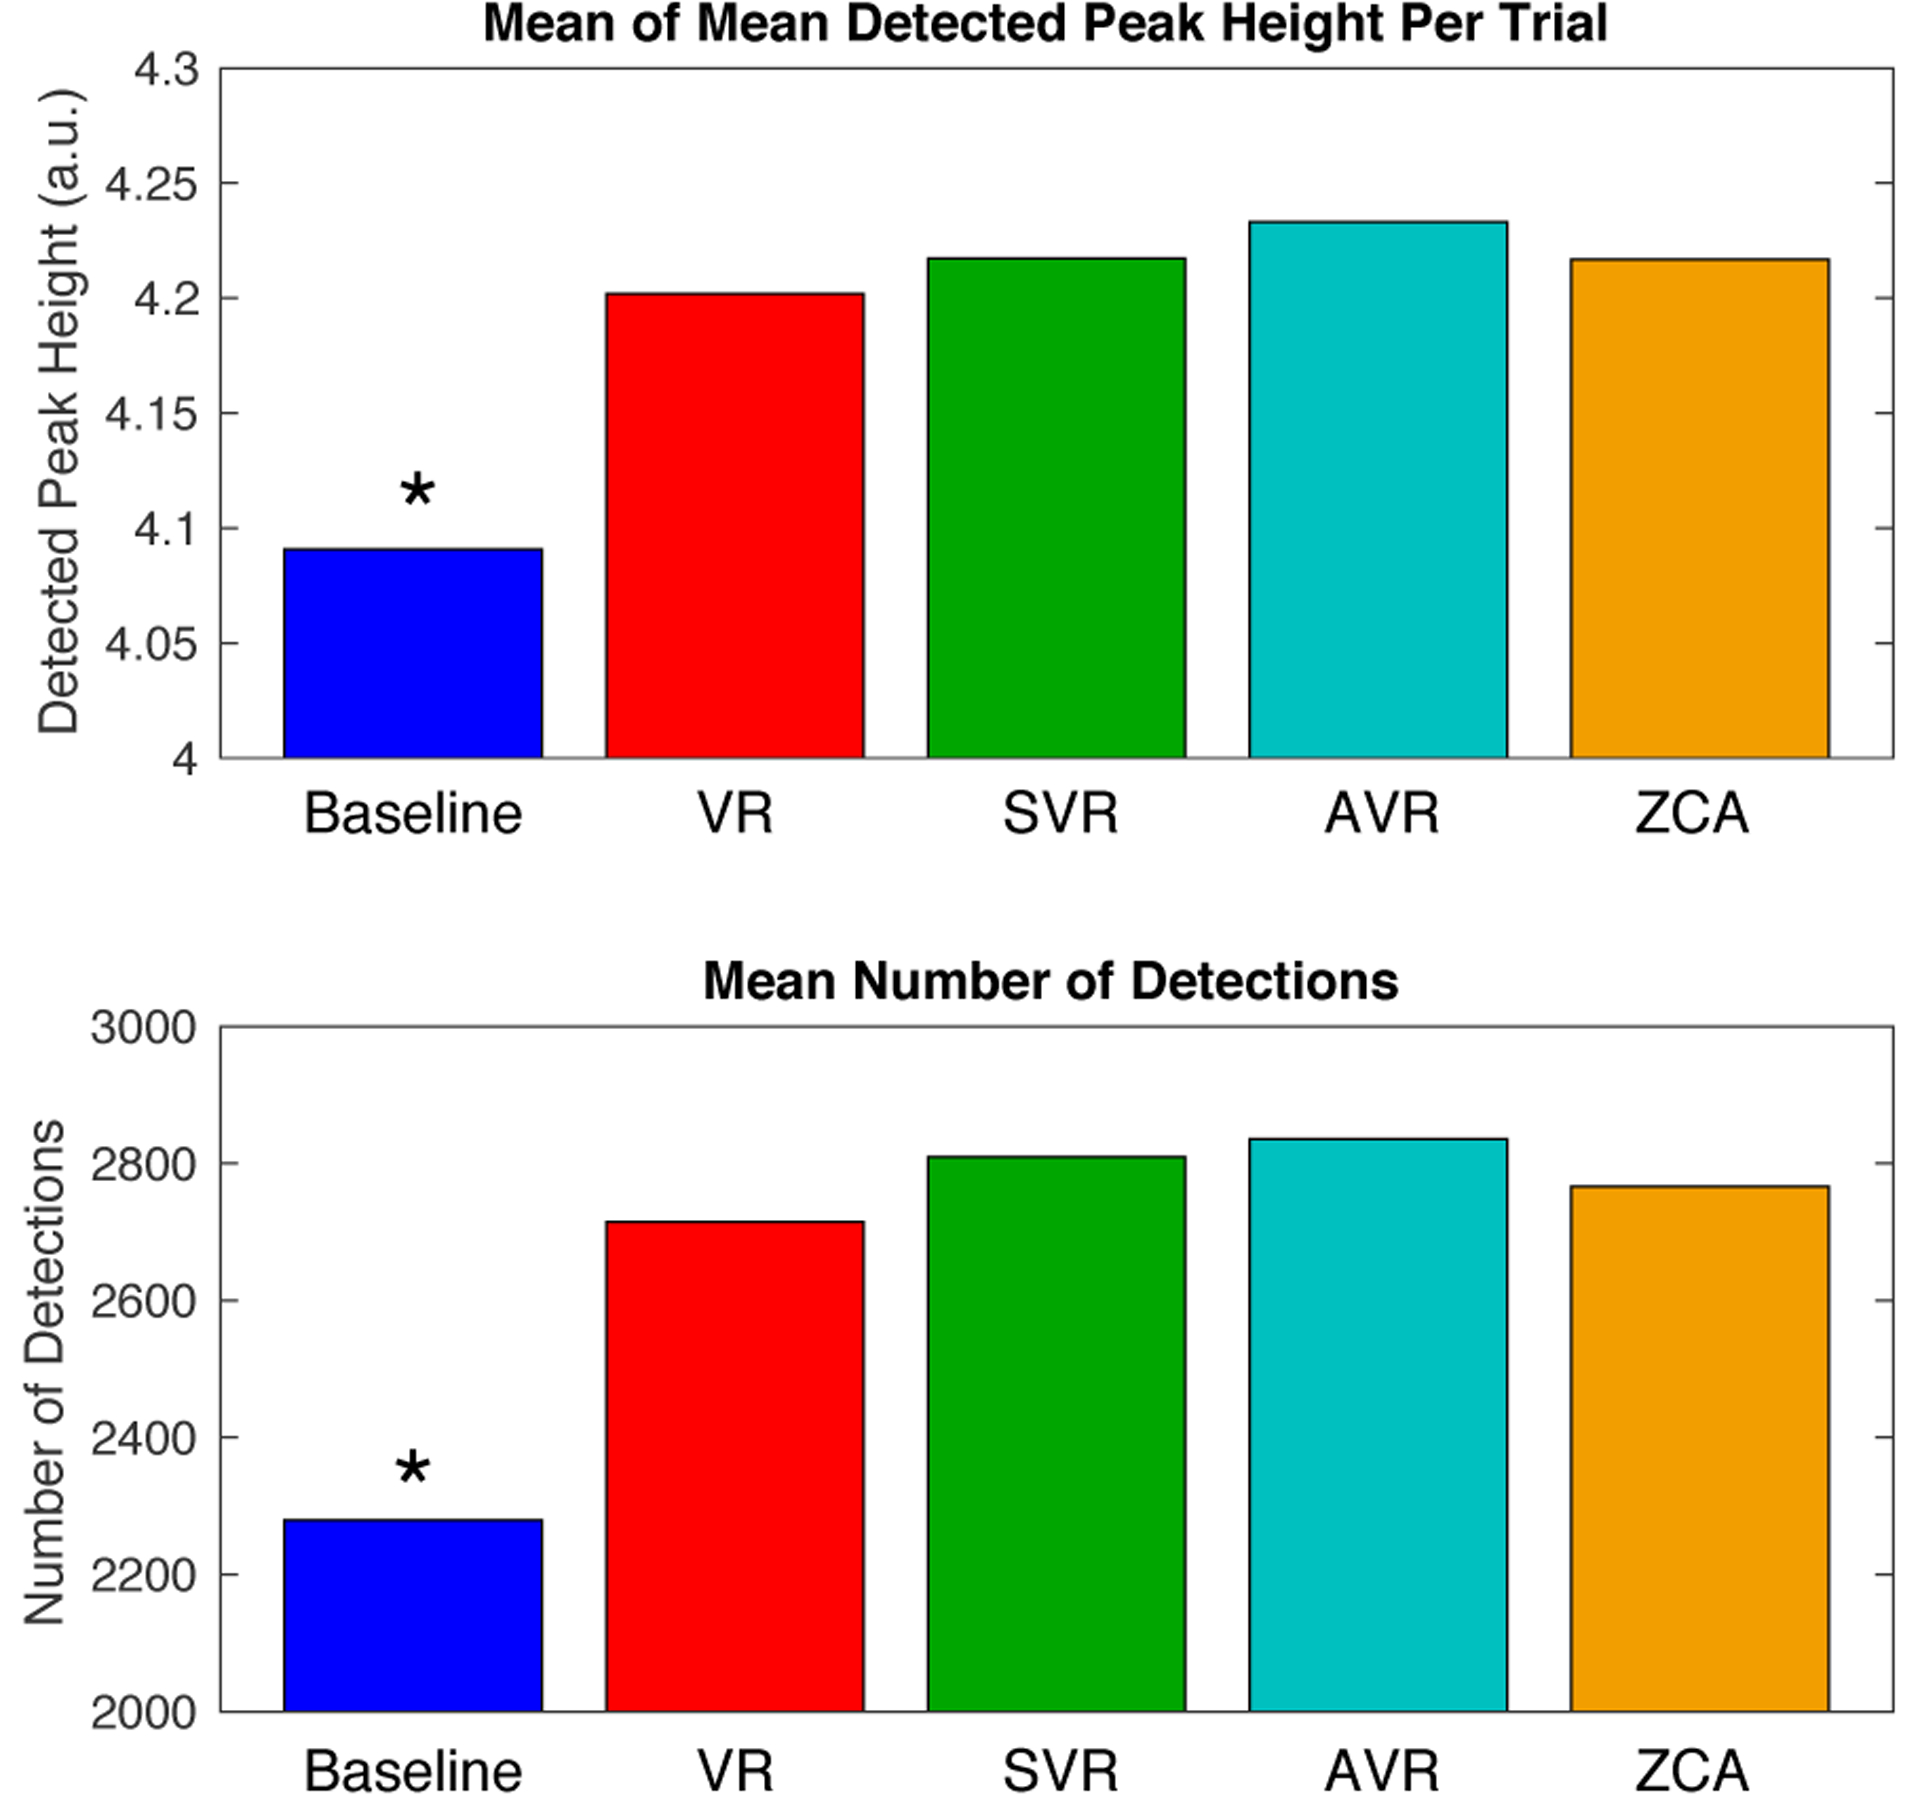
Comparison of mean of mean peak heights per channel (indicative of channel SNR) and mean number of detected waveforms per two-minute trial averaged across 16 channels and 81 trials taken in a total of 7 rats (trials not evenly distributed between individuals). Virtual referencing (VR), scaled virtual referencing (SVR), adaptive virtual referencing (AVR), and zero-phase component analysis whitening (ZCA) all offered statistically significant improvements over the baseline recording results (ANOVA followed by Tukey’s HSD with alpha = 0.05). AVR provided the best result, although statistical significance compared with other methods (VR, SVR, ZCA) was not reached.
Figure 5 compares the MUA on 3 adjacent recording sites before and after adaptive virtual referencing. The MUA and clustered spikes before adaptive virtual referencing is shown in panels (a-b), and threshold crossings (detected spikes) are shown as raster marks. The LFP signal is shown in panel (c). The same data after adaptive virtual referencing are shown in panels (d) and (e). After adaptive virtual referencing, the background noise level is reduced in (d) compared to (b). This allows the detection of many more spikes as seen by raster marks, and the clustering of spikes was also improved (e) compared to (a). The timing of spikes is correlated with the LFP activity in panel (c).
Next, the influence of adaptive virtual referencing on PCA feature extraction and waveform clustering is studied for two cases of different noise levels. The extracted spikes are mapped onto a lower-dimensional space centered at the sample mean and the principal axes with the highest variances are extracted [2,3,20]. The PC scores of the extracted spikes for the first few principal axes are plotted in Figures 6 and 7. The data organize themselves into clusters and each cluster is likely to represent neural spike signals from one specific location (i.e. a specific neuron). In Figure 6, a comparison of before adaptive virtual referencing (top row) and after adaptive virtual referencing (bottom row) is made for data that were recorded with low noise and good signal-to-noise ratio (SNR). The feature extraction is similar between the two cases. Additionally, adaptive virtual referencing does not alter the shape of recorded waveforms. As previously mentioned, more small amplitude spikes were detected after adaptive virtual referencing (cluster 4: 1744 before, 1843 after; cluster 5: 1038 before, 1105 after). Furthermore, the cross-correlation and autocorrelation plots of the clustered waveform time courses are not influenced by AVR.
Figure 6.
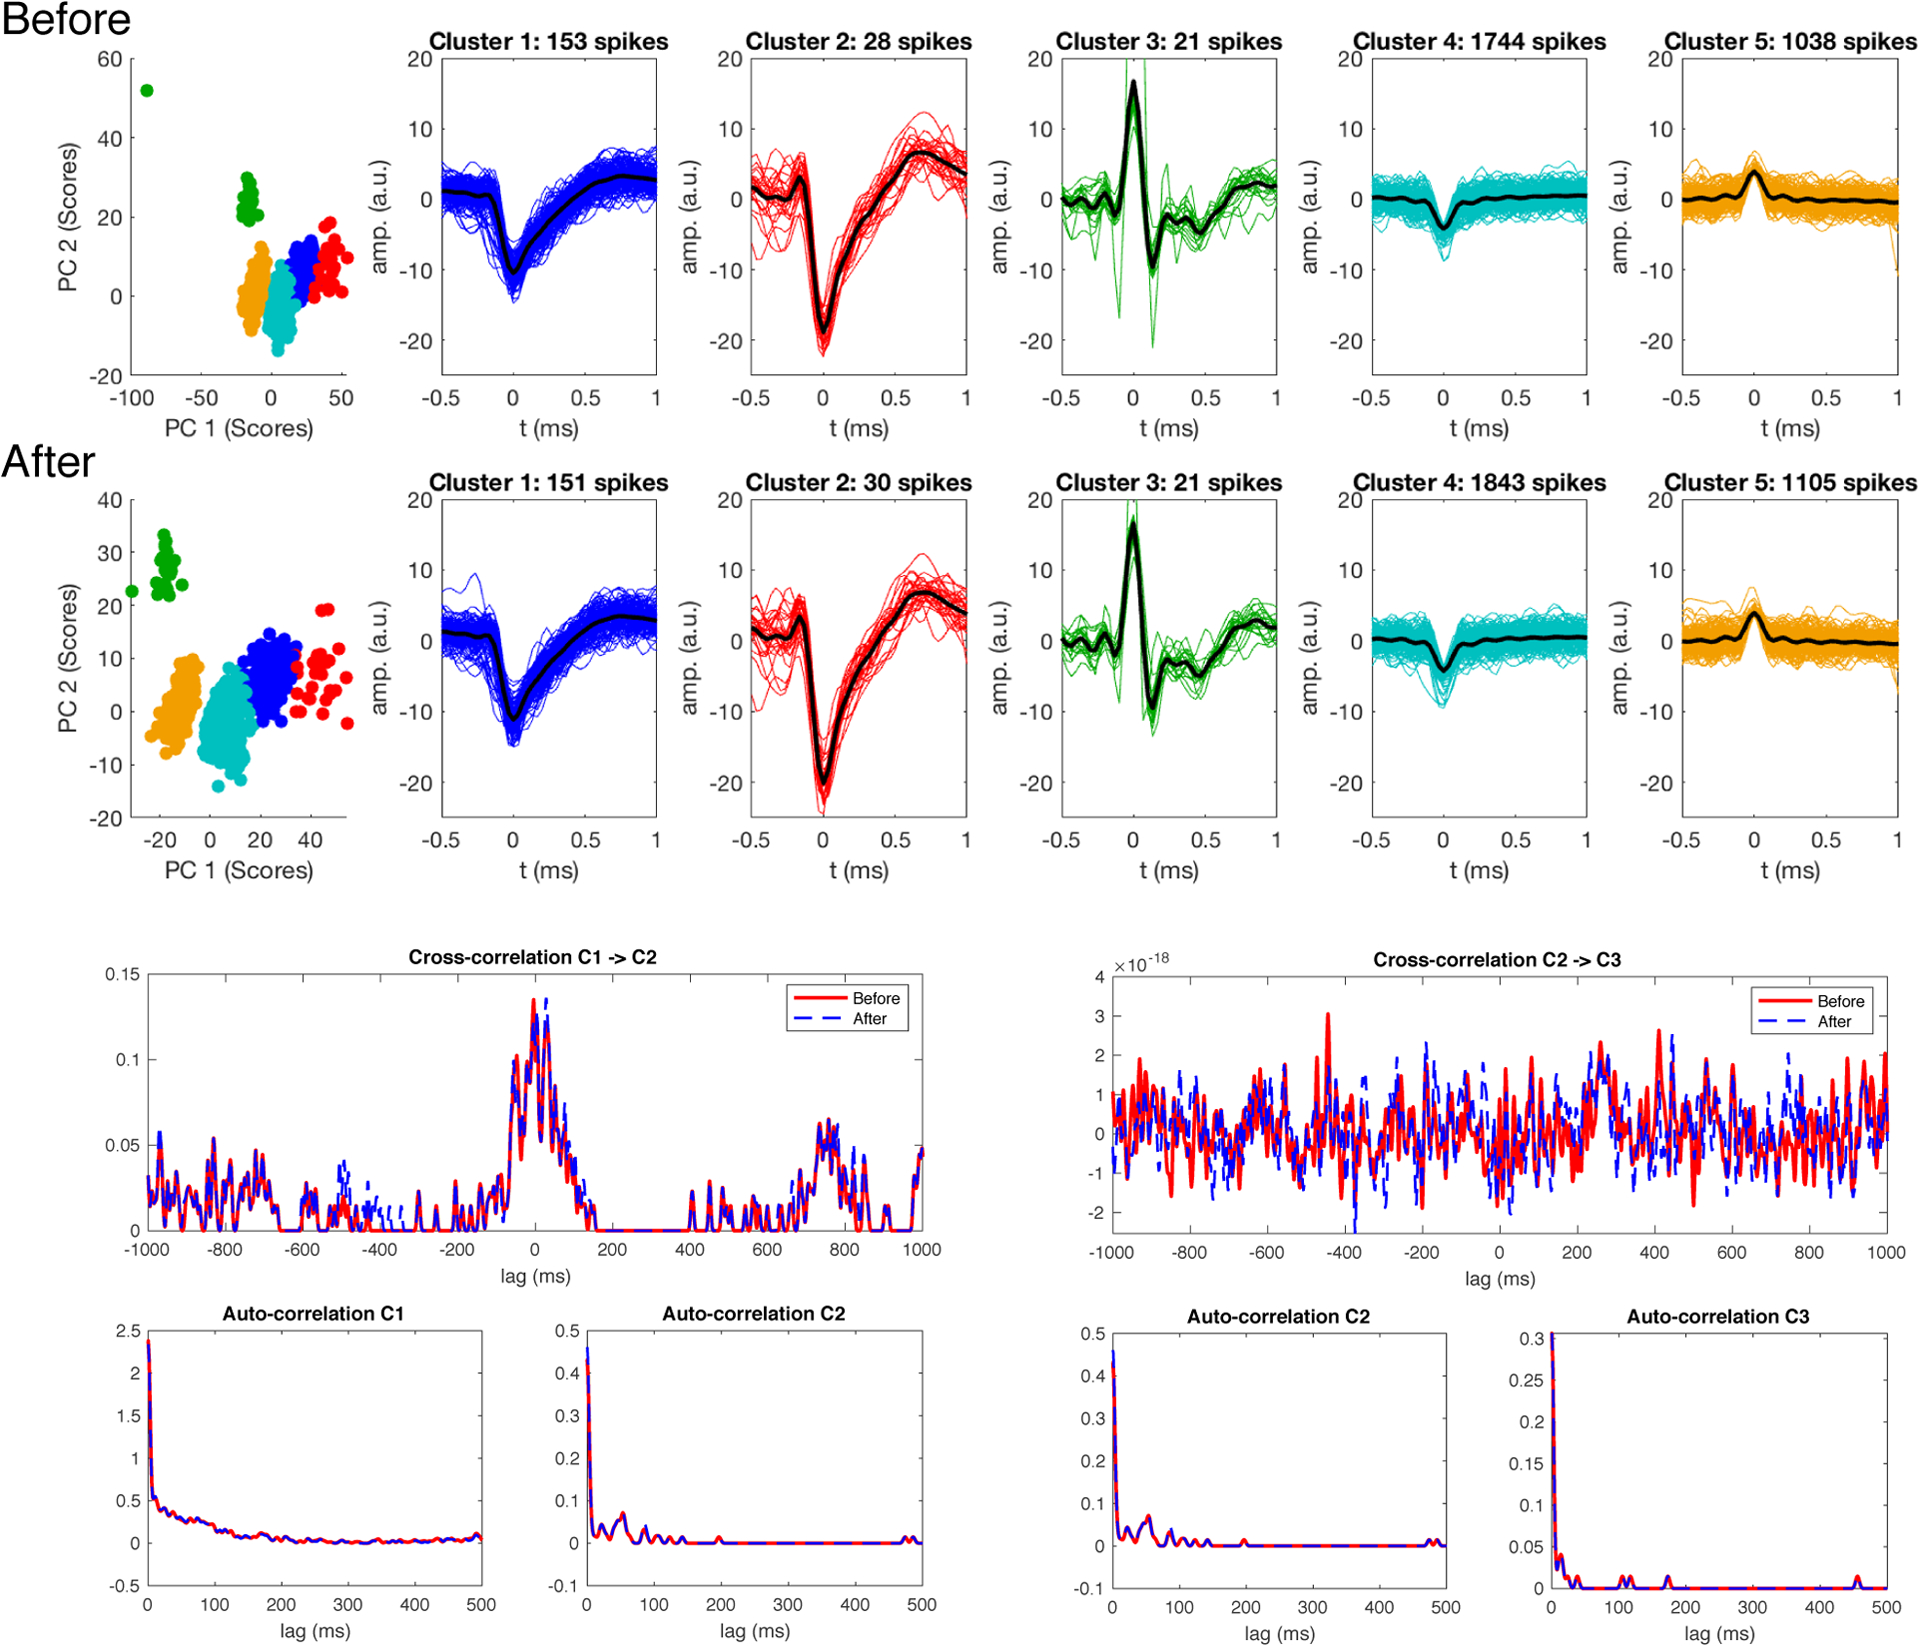
Clustering of high SNR data before (top row) and after adaptive virtual referencing (bottom row). Adaptive virtual referencing did not alter spike waveforms. An increased number of small waveforms was observed due to noise reduction. Clusters formed from two minutes of data. Cross-correlations and autocorrelations of the clustered spike point processes are presented below the clustered data. Note the correlation between cells 1 and 2, and lack of correlation between cells 2 and 3. These cells had low firing rates due to spontaneously recorded activity under relatively strong anesthesia. Adaptive virtual referencing did not influence the autocorrelations or cross-correlations.
Figure 7.
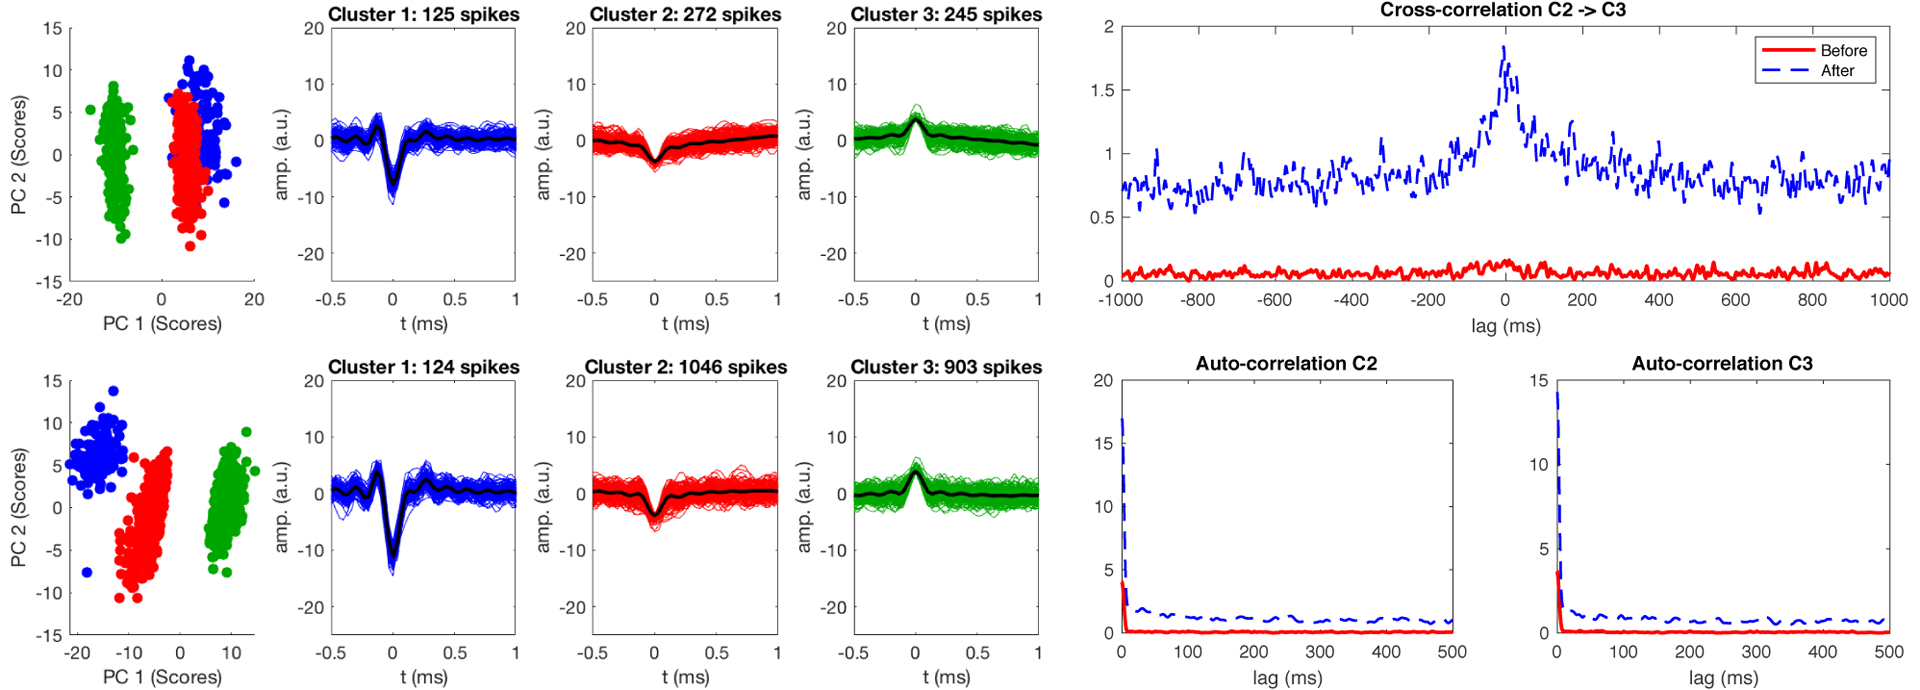
Clustering of lower SNR data before (top row) and after (bottom row) adaptive virtual referencing. The adaptive virtual reference reduces noise in spike waveforms (resulting in increased peak height due to noise level normalization), and a higher number of small spikes from multiple units (clusters 2 and 3) are detected after adaptive virtual referencing. Clusters formed from two minutes of recording data. The autocorrelation and cross-correlation of the small clusters is influenced by adaptive virtual referencing, as many more occurrences of spikes in the small amplitude clusters become measured and the underlying dynamics are better observed. Note that clusters 2 and 3 likely still contain multiple contributing neurons, as neurons farther from the recording site will generate smaller and less-distinguishable waveforms in comparison to neurons closer to the electrode (e.g. cluster 1).
Figure 7 shows the results for data that initially had a higher noise floor and lower SNR compared to Figure 6. Adaptive virtual referencing significantly improves feature extraction and sensitivity for detecting spike activity in this case. Before filtering, the projections of clusters 1 and 2 overlap in span(PC 1, PC 2). After filtering, the cluster projections are distinct in span(PC 1, PC 2). Note that in both cases, the clustering was performed using the first 5 PCs as features and in segments of two-minute data trials. After AVR, many more low-amplitude spikes belonging to clusters 2 and 3 are detected (cluster 2: 272 before, 1046 after; cluster 3: 245 before, 903 after), which correspondingly alters the cross-correlation and autocorrelation of the units to better represent the neuronal dynamics in the noisy recording.
The combined results from adaptive virtual referencing on the benchtop from 5 acutely implanted and 2 chronically implanted rats are presented in Figure 8 and compared with alternative methods including virtual referencing (VR), scaled virtual referencing (SVR), and zero-phase component analysis (ZCA) whitening. The results from 81 trials across 16 channels were averaged and the techniques were compared in terms of the mean of mean detected peak height per trial (in each trial the average detected peak height is computed, and subsequently the average of the averages is computed across trials), and the mean number of detections per trial. These comparisons provide insight about the signal-to-noise level and detection thresholds considering that each method was scaled to unity noise level for fair evaluation. VR, SVR, AVR, and ZCA whitening all improved the mean of mean peak heights and the number of detections per trial in comparison to the baseline recorded data. The improvements were significant at α = 0.05 as determined by ANOVA and Tukey’s HSD. The best results were obtained from adaptive virtual referencing, although the improvement did not reach statistical significance in comparison to the other techniques.
The methods were further compared by averaging the covariance matrix of the 16-channels before (baseline) and after the VR, SVR, and AVR denoising methods as well as ZCA data whitening. These comparisons are presented in Figure 9. VR and SVR were observed to substantially decorrelate the channels in comparison to the baseline recording. Further improvements are noticed for AVR and ZCA whitening. ZCA whitening provided the best decorrelation of channels due to change of basis with the requirement of orthogonality.
Figure 9.

Normalized covariance matrices of 16-channel recordings averaged across 81 trials recorded in 7 rats for the compared noise reduction methods. Baseline covariance matrix shows substantial noise correlation across channels, which is dramatically reduced by VR and SVR. AVR provides noticeably improved channel decorrelation. ZCA whitening provides the best channel decorrelation due to change of basis. However, superior channel decorrelation does not necessarily imply better denoising.
3.3. Recording in a 16.4T MRI Scanner
Figure 10 compares recordings made on the benchtop outside the scanner bore (a) with those made inside the scanner bore before adaptive virtual referencing (b) and (c). Panel (b) shows periodic interferences caused by mechanical vibration of the magnet due to helium pump operation. The magnitude of these interferences depends on the quality of mechanical isolation of the hardware from the magnet, if perfectly isolated these interferences are not observed. Panel (c) shows a large increase in noise that occurs when enabling the MRI gradient amplifier hardware. Note that these are not ‘scanning’ artifacts, but rather an increased noise that is observed when hardware necessary for MRI image acquisition are powered on and enabled. Both the vibration artifacts and the increased noise from gradient amplifier hardware can be effectively removed using the adaptive virtual reference. Panel (d) in Figure 10 shows the benchtop data from panel (a) after adaptive virtual referencing, note that the noise floor is reduced, consistent with the results from the previous section on benchtop recording. Panel (e) shows that the interferences present in (b) can be removed without removing MUA activity that was also recorded. Finally, panel (f) shows that the noise floor can be dramatically reduced to uncover MUA that was below the noise floor in panel (c). This is possible because the mechanical vibrations and increased noise floor are common mode and therefore preserved in the spatial average used as a virtual reference. Meanwhile, the MUA on each channel is not common mode due to adequate spacing of the recording channels, therefore the MUA is not removed by the adaptive virtual reference.
Figure 10.
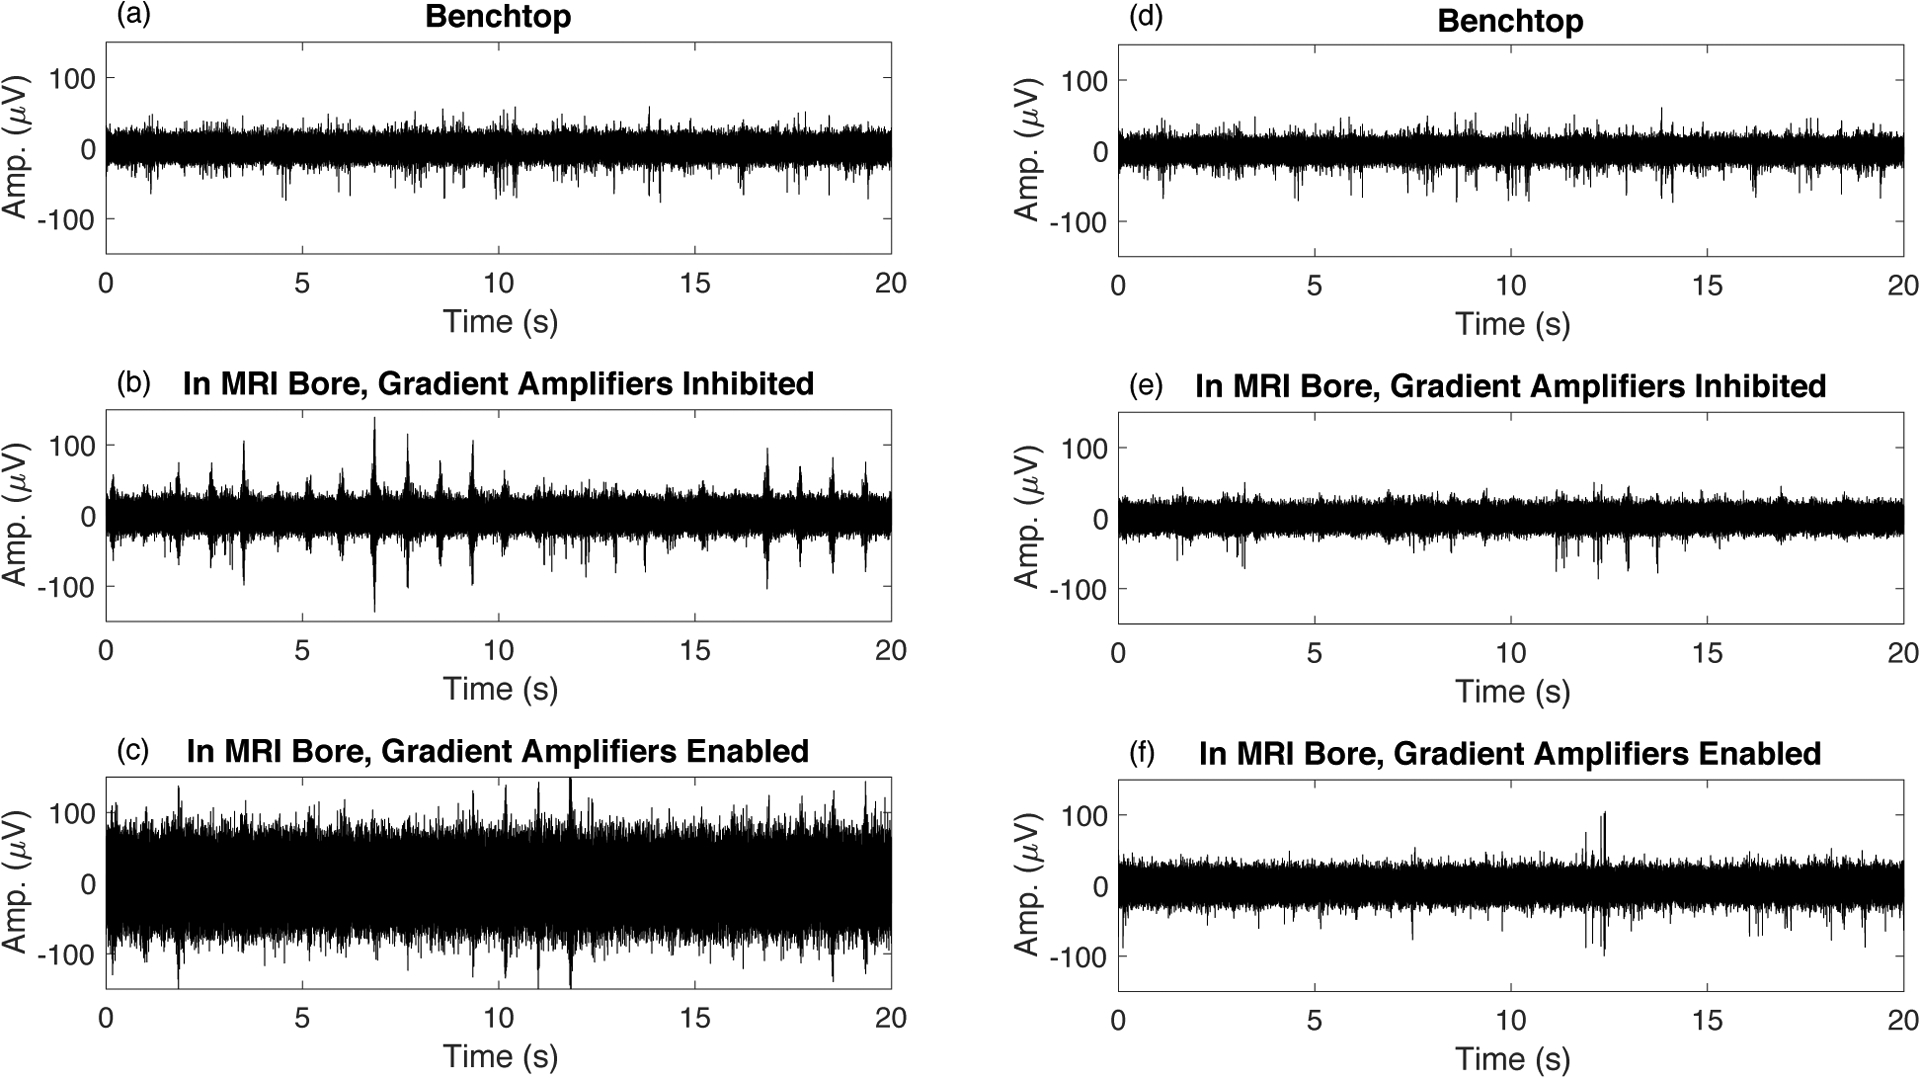
Recording spikes inside the bore of the 16.4T MRI scanner introduces additional interferences. (a) Recording on the benchtop outside the bore shows clean MUA signal. (b) After inserting the rat into the bore, periodic interferences caused by mechanical vibration are observed – these interferences depend on the quality of hardware isolation from mechanical vibration - here we have displayed the case of poor isolation. (c) Enabling the MRI gradient amplifier hardware substantially increases the noise floor. (d,e,f) The signals corresponding to (a,b,c) after adaptive virtual referencing.
Figure 11 emphasizes that it is possible to obtain similar data quality in the bore of the 16.4T scanner to what is recorded on the benchtop outside the magnet bore. Panel (a) shows the MUA recorded on the benchtop, and panel (b) shows data recorded on the same channel after placing the rat into the 16.4T bore with all hardware ready for scanning. The noise floor is dramatically increased in panel (b). After adaptive virtual referencing, the noise is effectively removed and underlying MUA is clearly visible in panel (c).
Figure 11.
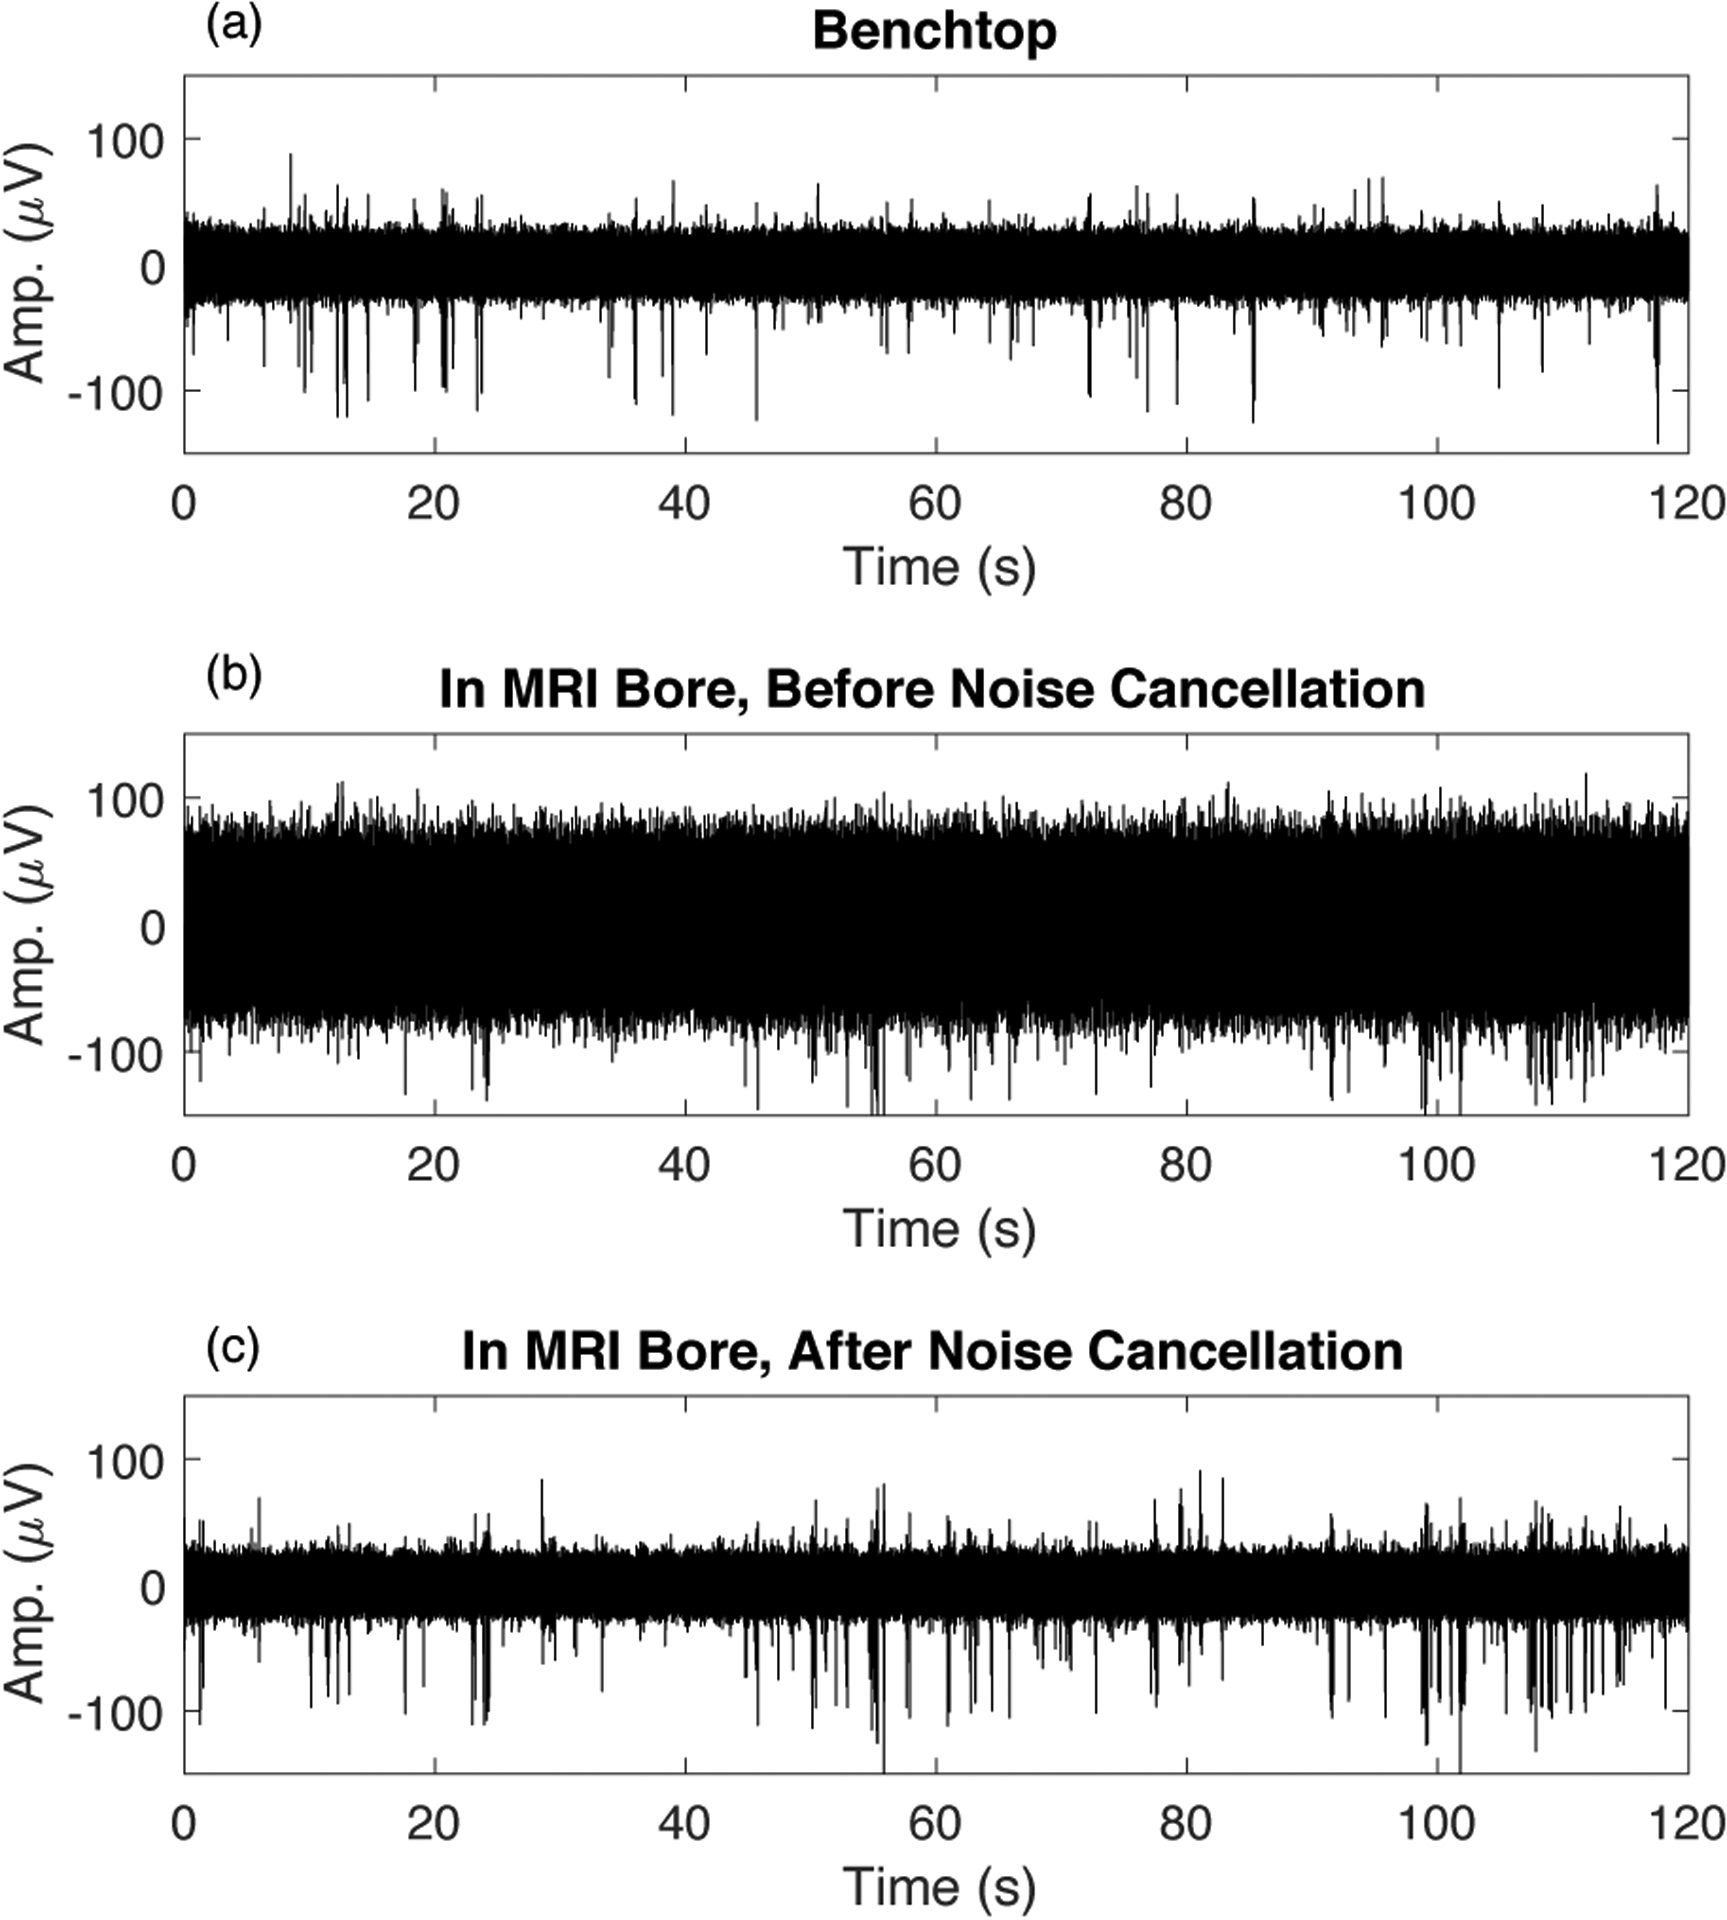
Data quality comparison for benchtop vs. in-bore recording. (a) Data recorded on the benchtop (after adaptive virtual referencing). (b) Data recorded in the bore of the 16.4T MRI scanner before removal of additional interferences. (c) The data presented in (b) after adaptive virtual referencing to remove noise. Adaptive virtual referencing reduces the noise level dramatically and uncovers the MUA activity.
Figure 12 compares MUA clusters after feature extraction and clustering on the benchtop and inside the 16.4T scanner after adaptive virtual referencing. Similar features and clusters are obtained for the two datasets. Adaptive virtual referencing can remove noise and artifacts that are observed when recording MUA in the bore of the 16.4T MRI scanner, and subsequently we can perform feature extraction with PCA and clustering to obtain approximately the same information in the magnet as was available on the benchtop for the same channel.
Figure 12.
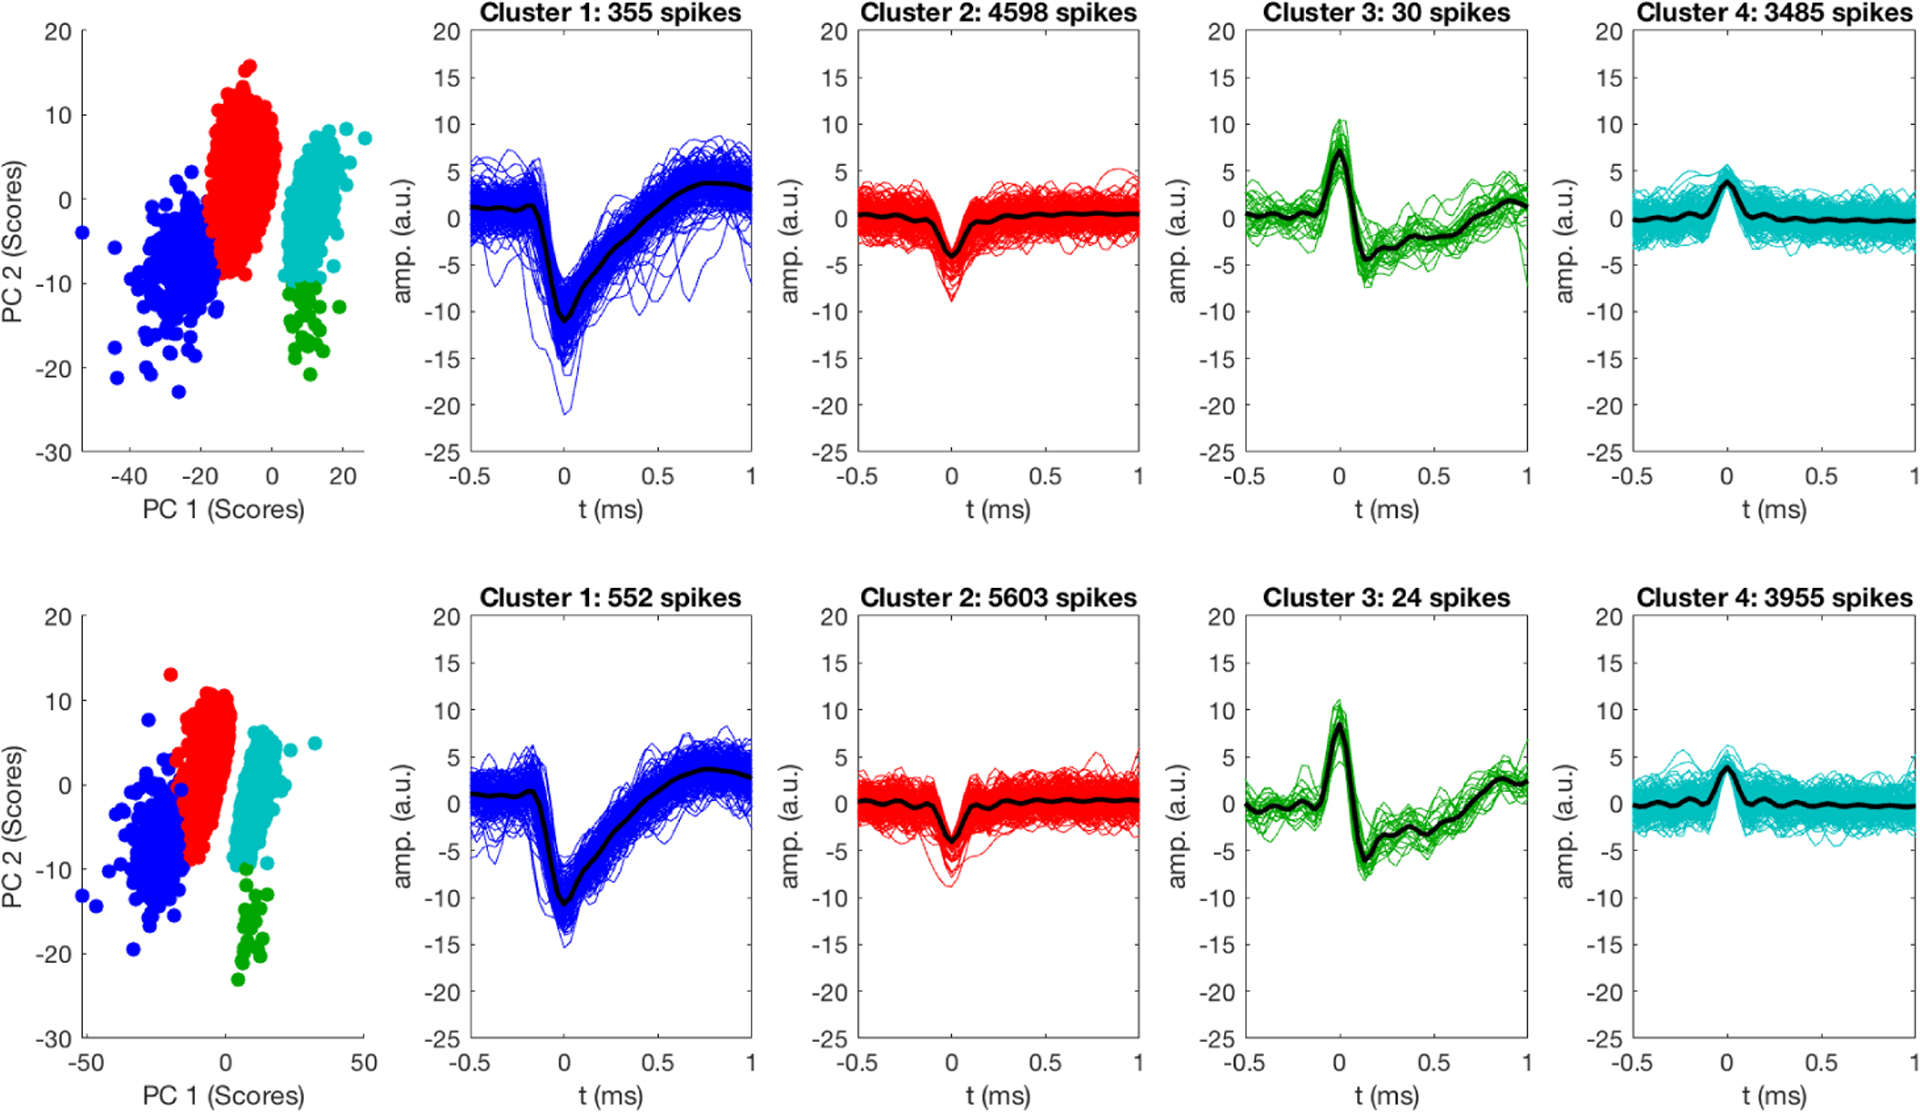
Comparison of spike clusters recorded on the benchtop (top) and inside the bore of the UHF MRI scanner (bottom) after adaptive virtual referencing. AVR was able to reduce noise enabling the extraction of extracellular spikes waveforms without distortion. Classification was performed on eight minutes of data.
Another issue to address is amplifier saturation during fMRI scanning. To this point, all the data presented were acquired with 0.25 microvolt/bit resolution with 16 bits. This provides an input range of approximately ± 8 mV. Unfortunately, this range was not large enough to prevent saturation during our experiments. Therefore, we switched to a lower resolution of 2 microvolts/bit, with input range of approximately ± 64 mV to avoid amplifier saturation. Figure 13 compares the benchtop data to data acquired inside the bore of the 16.4T MRI scanner after adaptive virtual referencing. Visually, the data quality in the bore is similar to that obtained on the benchtop. However, in the 2 microvolt/bit gain setting, we observed much more noise from 3–6 kHz compared to in the 0.25 microvolt/bit setting. Therefore, we had to bandpass the MUA signal from 300–3000 Hz instead of from 300–6000 Hz that was used in the 0.25 microvolt/bit setting.
Figure 13.
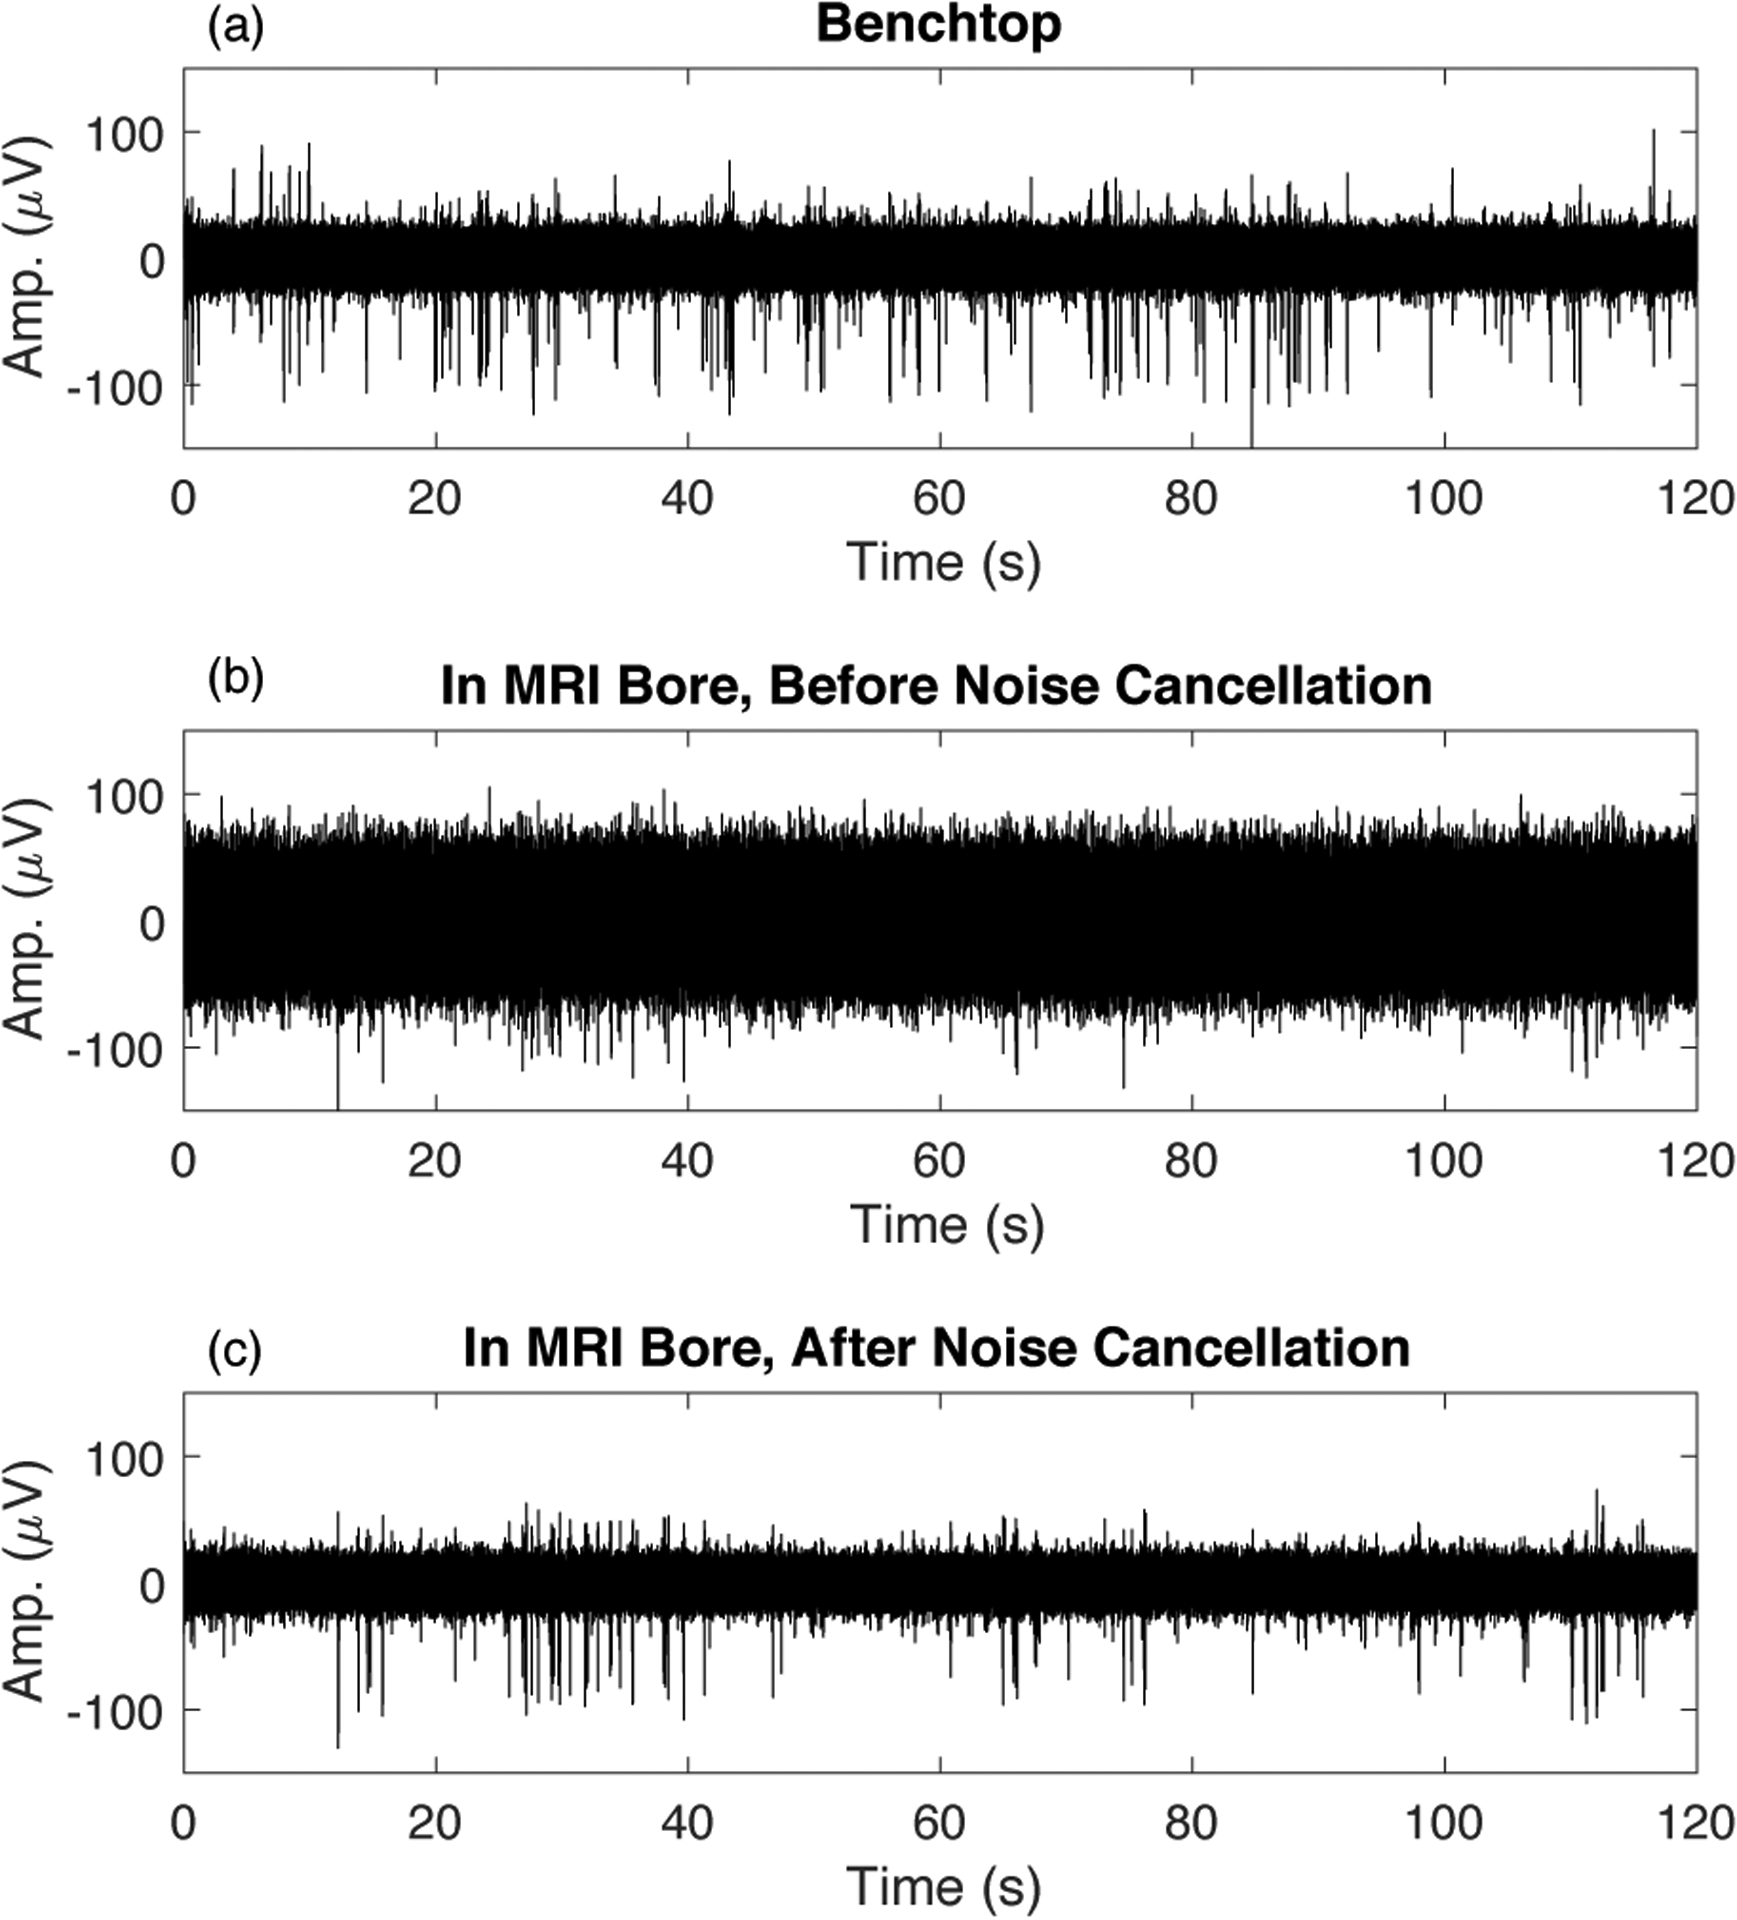
Data quality comparison for benchtop vs. in-bore recording at 2 microvolt/bit resolution. (a) Data recorded on the benchtop (after adaptive virtual referencing) (b) Data recorded in the bore of the 16.4T MRI scanner before removal of additional interferences. (c) The data presented in (b) after adaptive virtual referencing to cancel noise.
One result of this is seen in Figure 14, which compares clustering of the data with 2 microvolt/bit resolution on the benchtop (top row) and inside the scanner bore after filtering (bottom row). Despite using 2 microvolt/bit resolution, different clusters can still be observed in the 2-dimensional feature-space provided by PCA of the benchtop data (top row). However, after using a 3 kHz lowpass cutoff for our bandpass filter on data acquired inside the scanner bore, we see that spike waveforms are distorted and cluster 3 is no longer separable from cluster 4. This is at least in part due to the 3000 Hz lowpass reducing the amplitude of the relatively narrow cluster 3 waveforms observed on the benchtop. Therefore, with 2 microvolt/bit resolution we are able to avoid amplifier saturation and record MUA activity, but our feature extraction and clustering of MUA waveforms is negatively affected.
Figure 14.
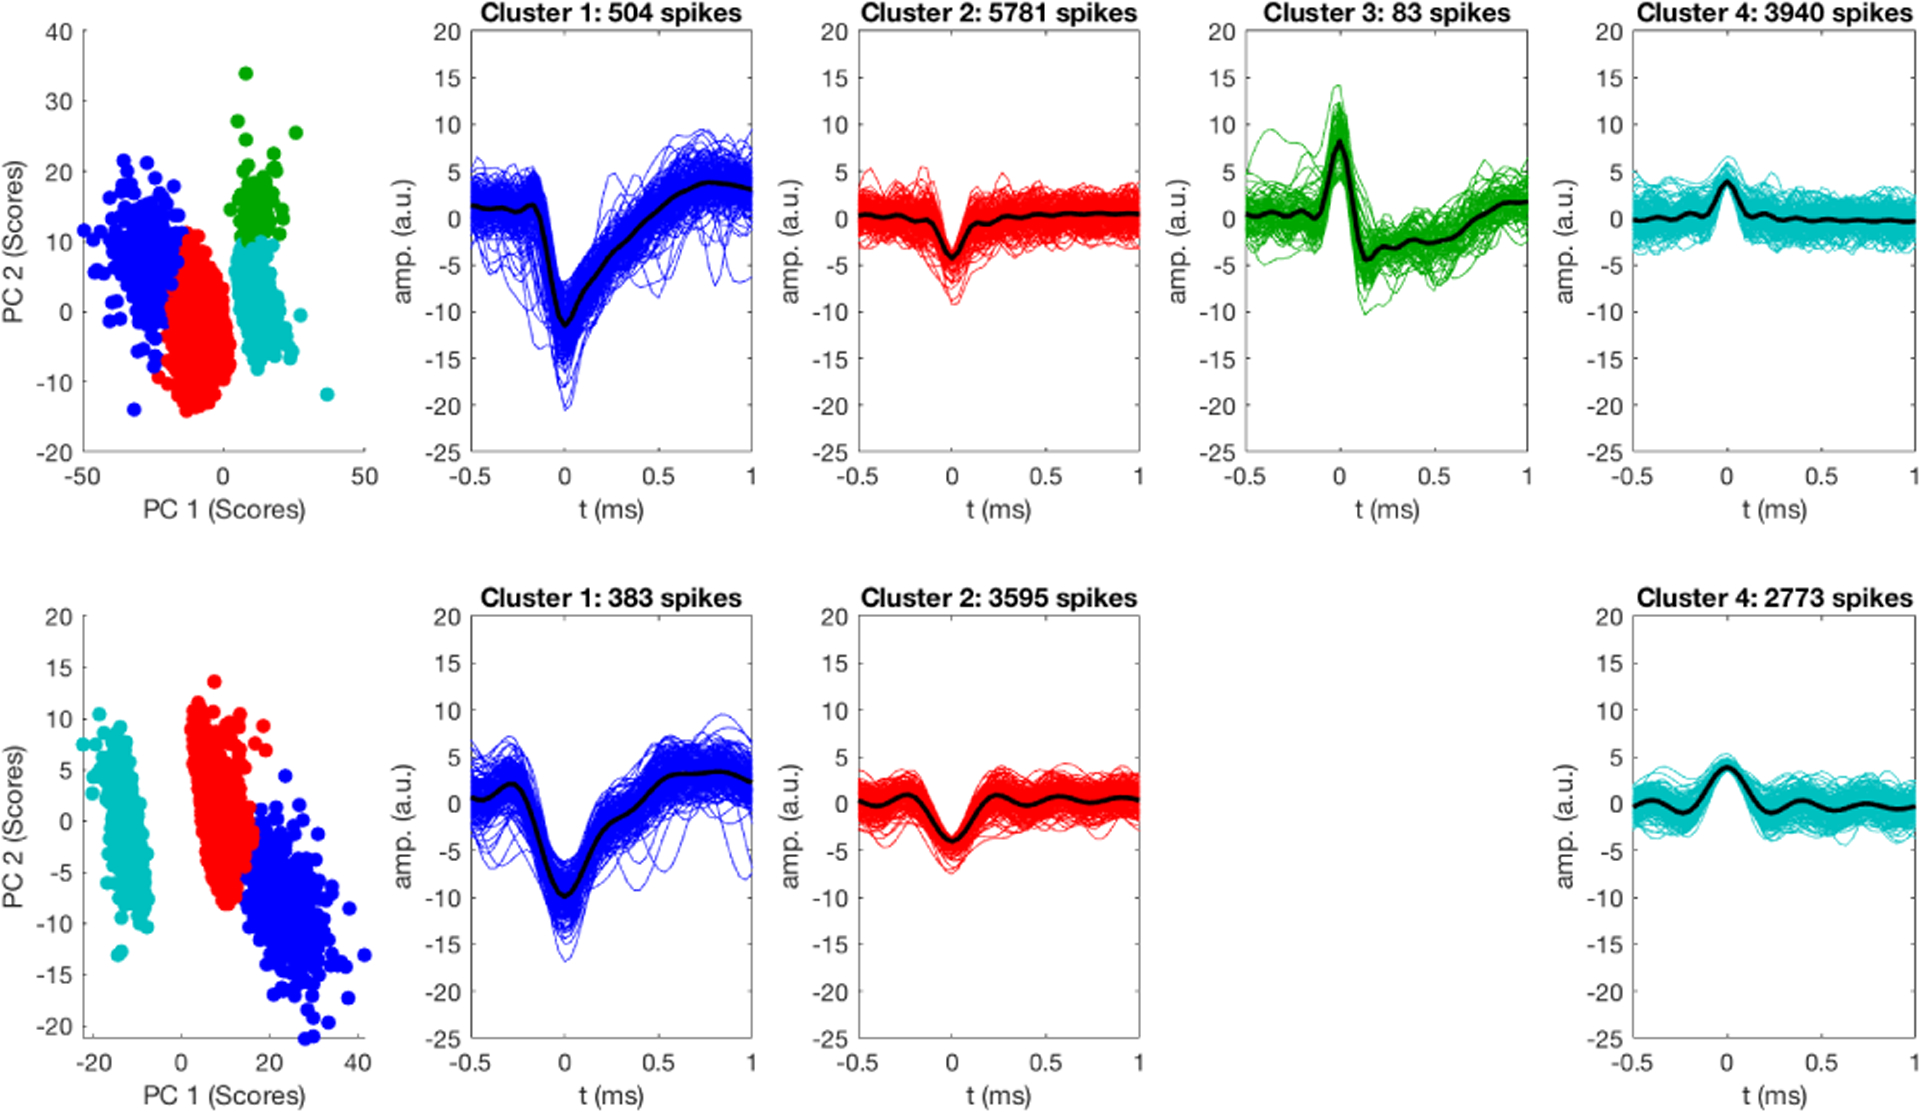
Amplifier in low gain mode - clustering MUA recorded on the benchtop (top row) compared to in the bore of the 16.4T MRI scanner after adaptive noise removal (bottom row). In low gain mode we observed increased noise in the 3–6 kHz range inside the scanner, so we used a narrower bandpass filter (300–3000 Hz instead of 300–6000 Hz). The performance and clustering in low gain mode in the MRI scanner bore is not as good as on the benchtop, but we can still identify MUA activity. Classification was based on eight minutes of data.
An illustrative comparison of common mode artifact denoising between the various methods (VR, SVR, AVR, and ZCA whitening) is presented in Figure 15. Mechanical vibration artifacts caused by the helium pump in the 16.4T MRI scanner are visible in the extracellular recording data. These artifacts are especially apparent in the baseline time course around 24.5 and 25.3 seconds. AVR was able to remove these artifacts from the recording while preserving the extracellular spike signal where the other methods failed. This example shows the superiority of AVR for denoising in comparison to VR and SVR. Additionally, it highlights that superior decorrelation of channels after ZCA whitening does not always provide superior noise/artifact cancellation.
Figure 15.
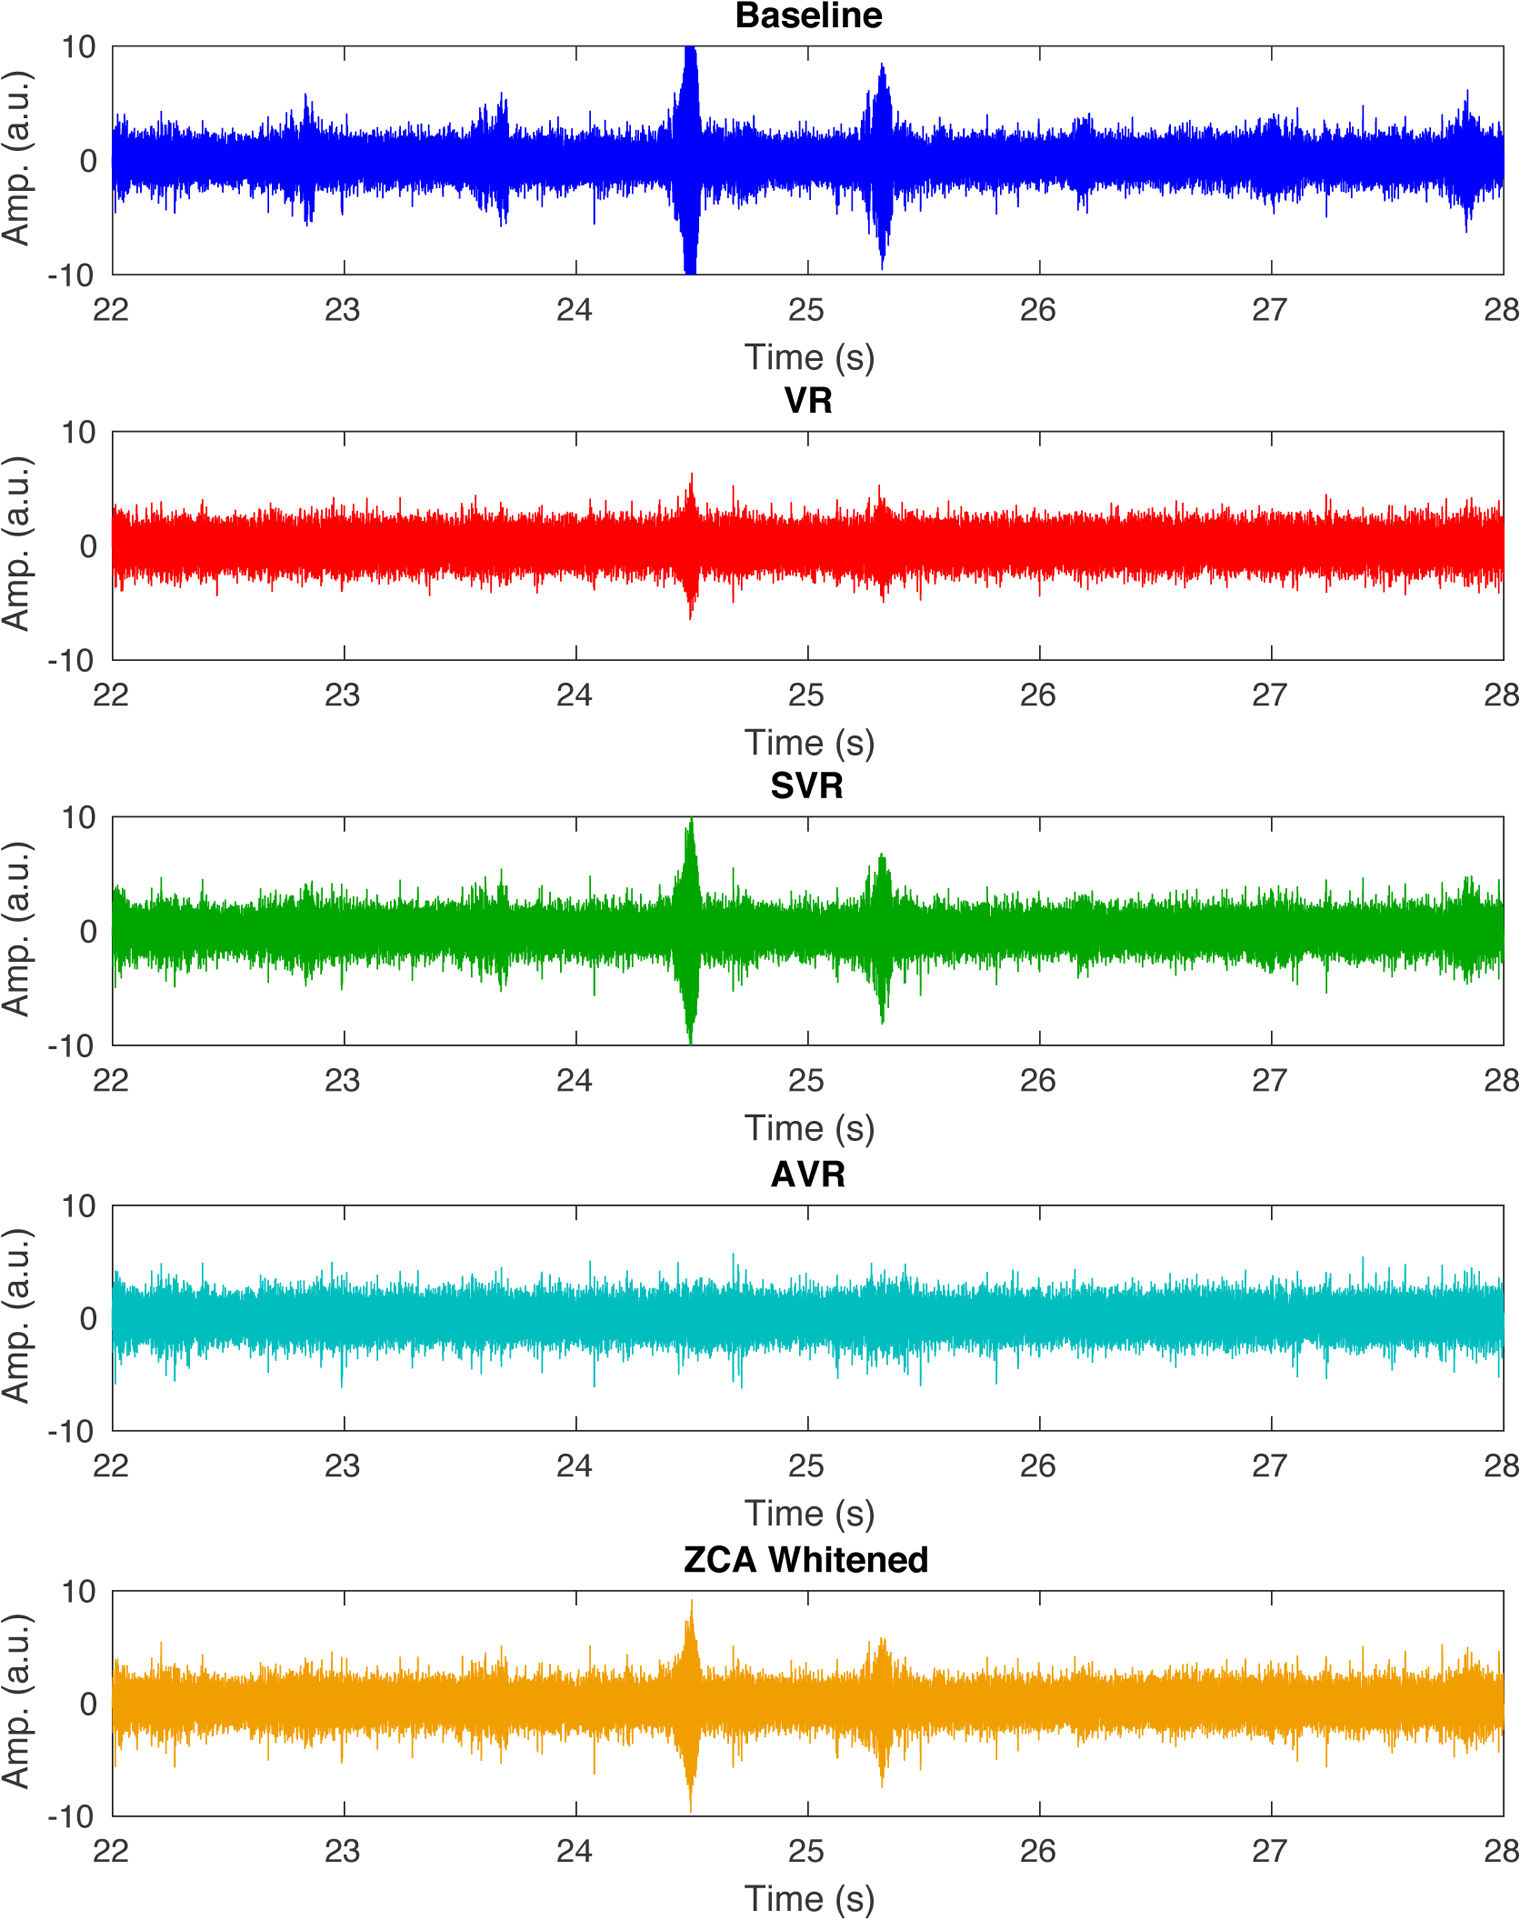
Illustrative example of denoising mechanical vibration artifacts using the various methods compared in this work. Adaptive virtual referencing provides the best removal of the vibration artifacts from the extracellular neural recording in the UHF MRI scanner. VR, SVR, and ZCA whitening all show noticeable residual artifacts.
Finally, we show in Figure 16 that we can observe MUA inside the 16.4T scanner during iv-GRASE fMRI scanning in between image acquisitions by using the adaptive virtual reference to reduce noise, and nulling the data during the image acquisition periods. On a long timescale as in Figure 16 (a), we cannot distinguish the scanning periods from non-scanning periods (the scanning period is indicated by a red line on the x-axis). Panel (b) shows a smaller time window where nulled signal portions are visible. The amount of signal to be nulled relative to the repetition time depends on imaging parameters. In this case, we nulled approximately 20% of the data. This can be accounted for in computing the spike rate by using an adequately large bin width or window for spike rate computation (e.g. at least double the null duration) and tracking the amount of nulled data within each bin or window to compute spikes/seconds for each bin or window.
Figure 16.
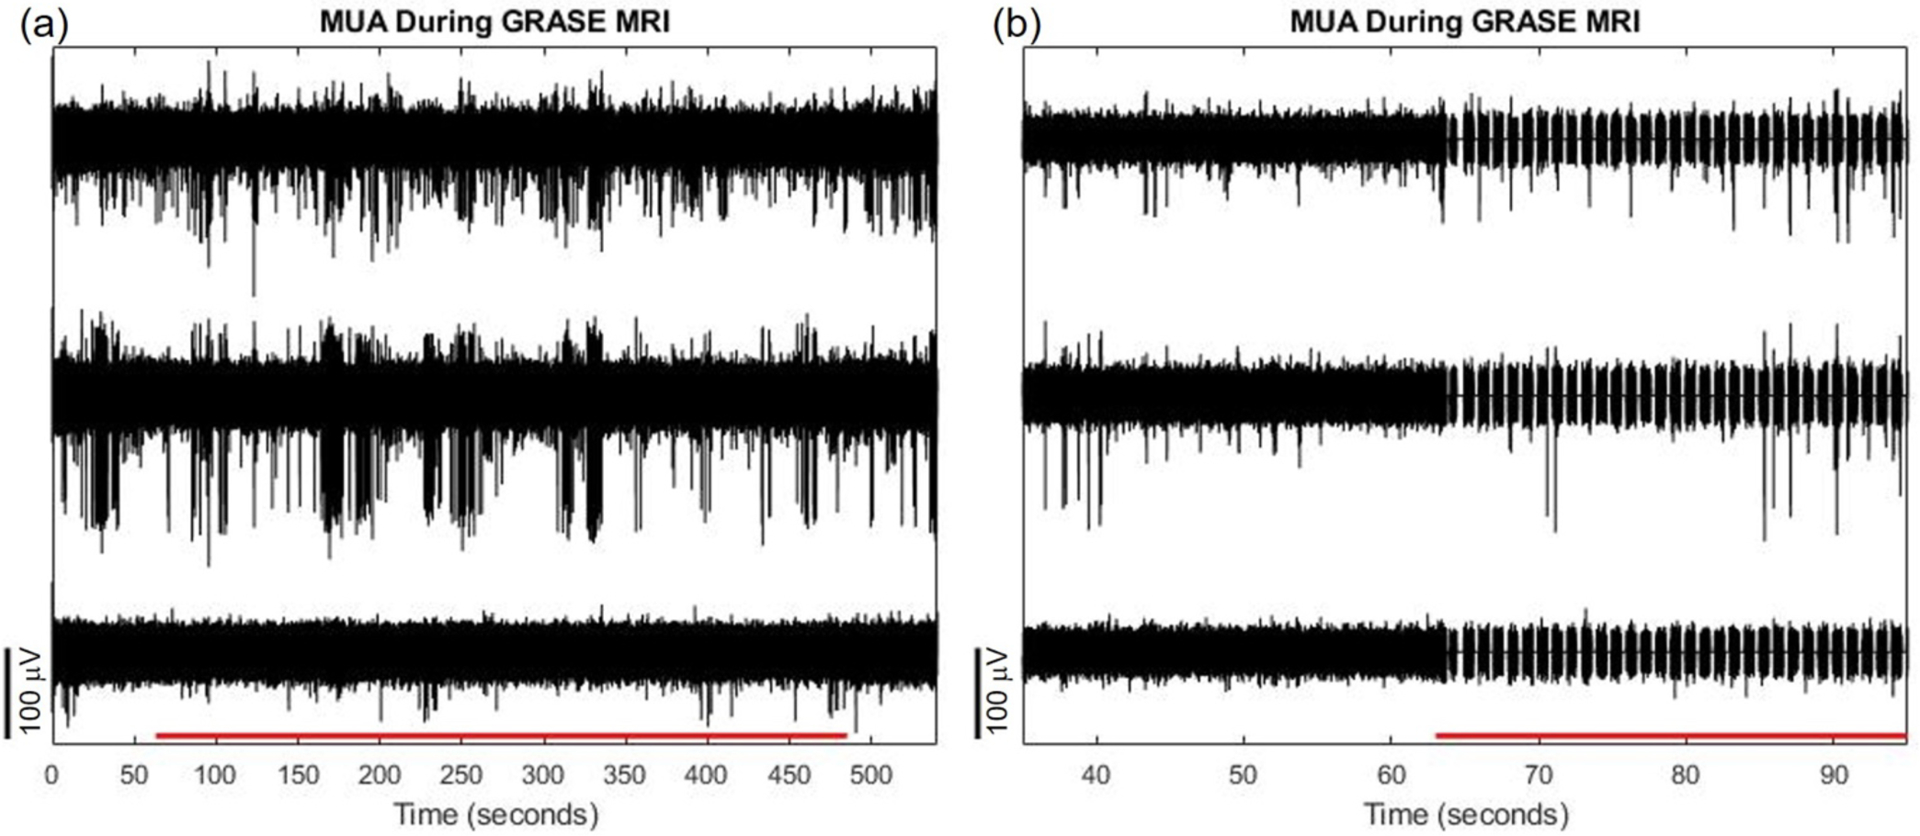
(a) Multi unit activity on 3 adjacent recording channels uncovered after filtering during GRASE fMRI scanning. GRASE acquisition period indicated by red horizontal line on x-axis. The observed signal and noise amplitudes are similar between scanning and non-scanning conditions. (b) Same as (a) but depicting a smaller temporal window. The signal is nulled where gradient switching interferences occur. Nonetheless, adaptive filtering can still remove common mode noise and uncover multi-unit activity between gradient switching interferences.
The iv-GRASE fMRI data acquired during electrophysiological recording were analyzed to generate a resting state fMRI network in the somatomotor area, presented in Figure 17. The seed-based method was used, with the seed placed contralateral to the implanted electrode. Voxels around the implanted electrode location, signified by the circle in Figure 17 subplot (d), are included in the resting state network, demonstrating the ability to acquire fMRI signal at the electrode location using iv-GRASE.
Figure 17.
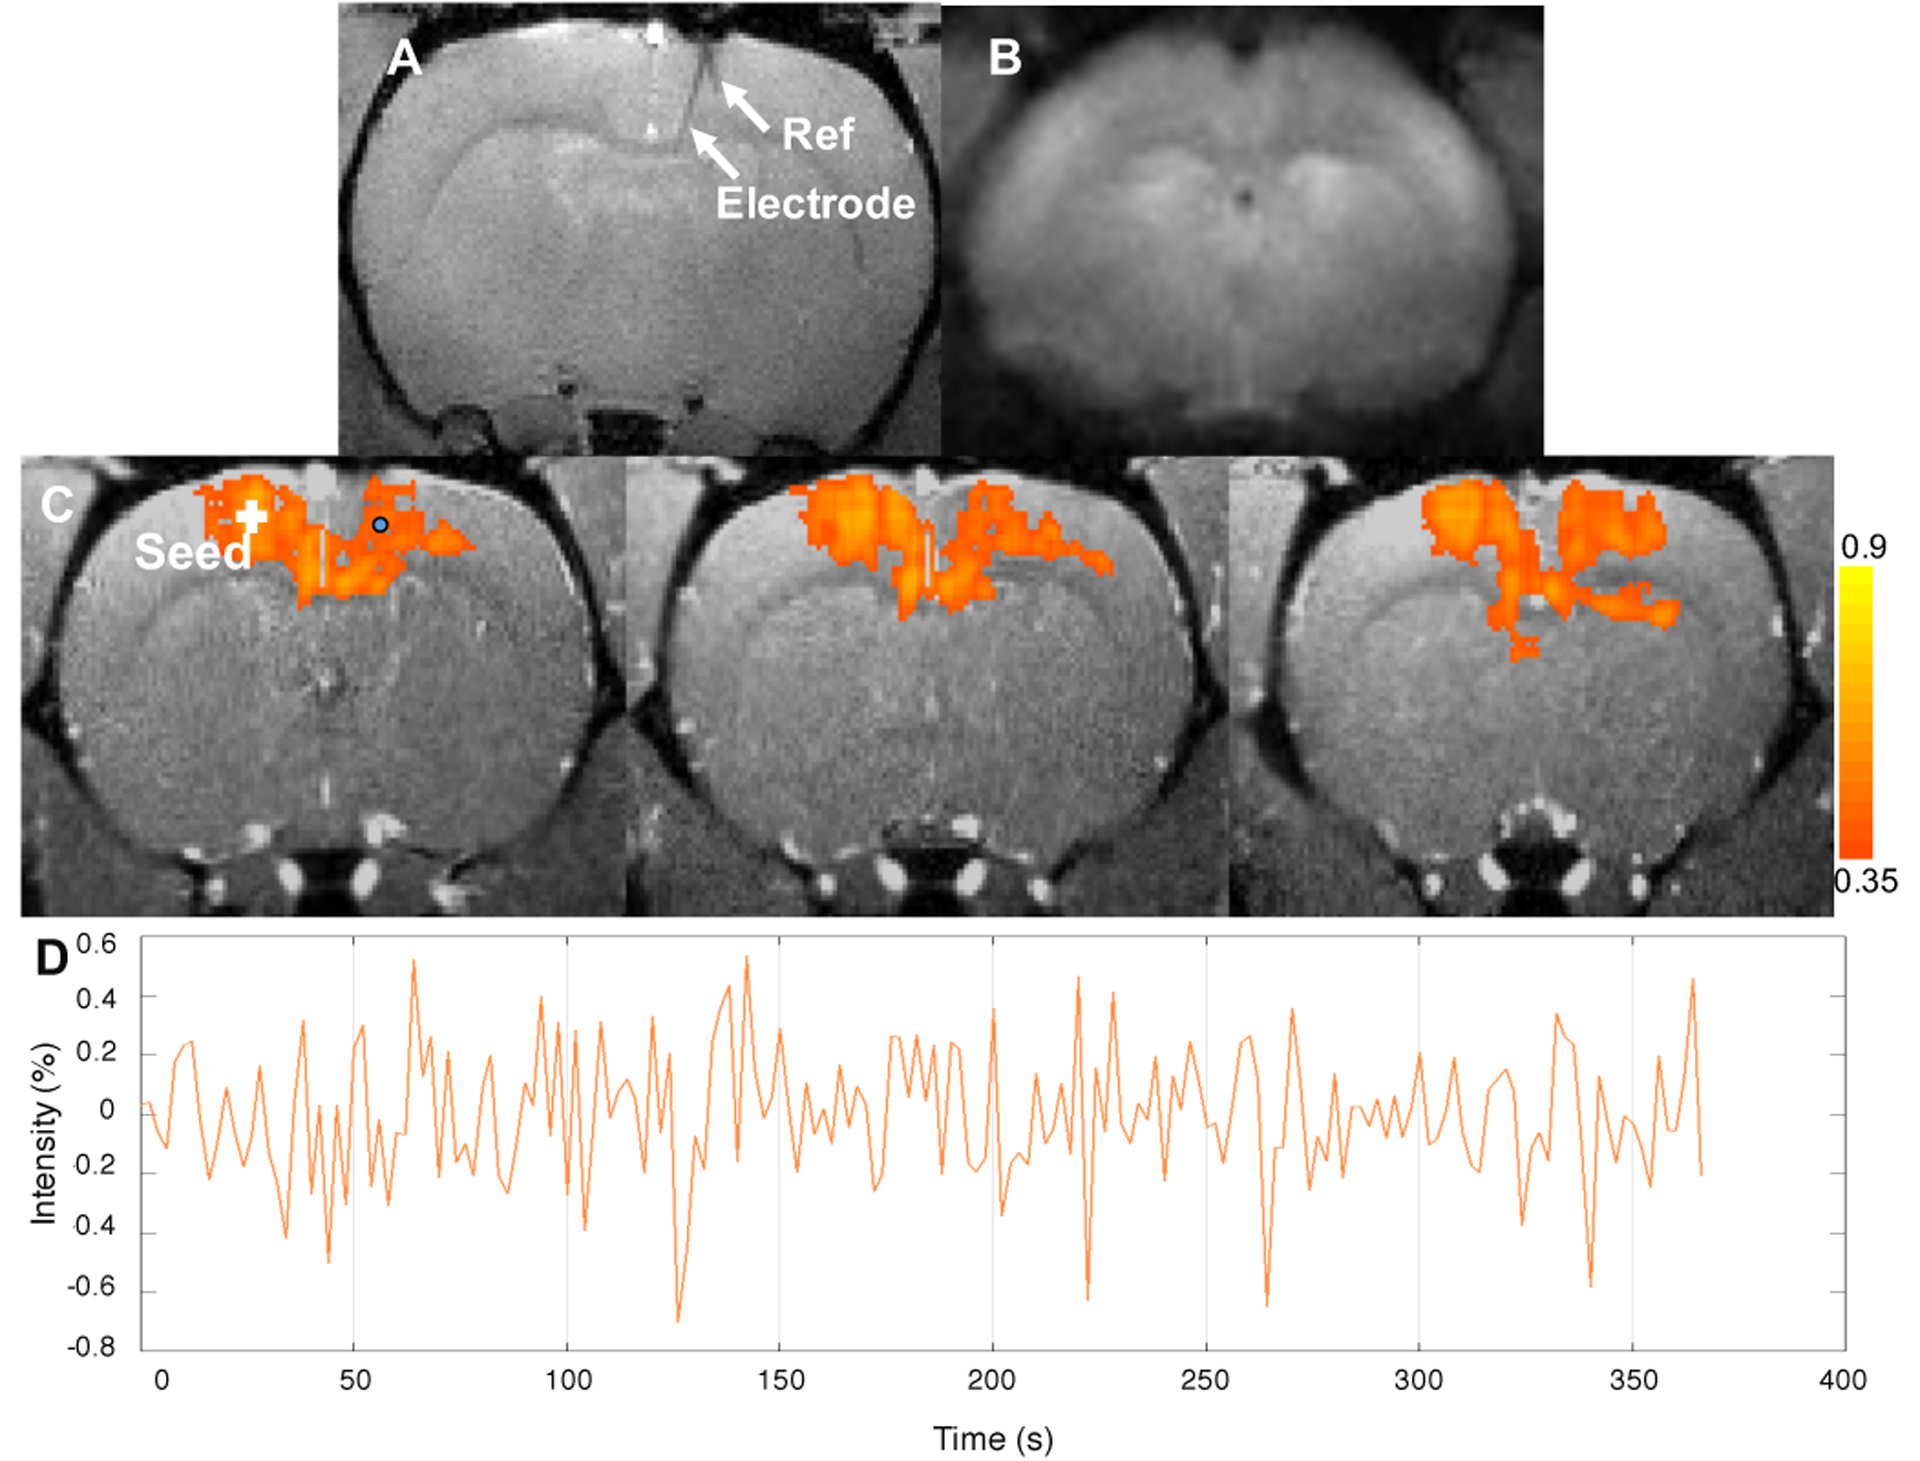
(a) Anatomical image of the rat brain with implanted electrode using gradient echo sequence. Image resolution: 125μm × 125μm × 500μm. Electrode shank and reference wire are clearly seen. (b) Raw fMRI image using GRASE sequence with image resolution 375μm × 375μm × 1000μm. (c) Resting state fMRI network with seeding in contralateral MO overlaid on anatomical images. (d) Time course of the BOLD signal for a voxel near the electrode in the middle layer of the cortex (circular point in c).
4. Discussion
Adaptive virtual referencing is able to remove common mode signals from multi-channel extracellular recording data. In order to be useful, there should be common mode noise and/or artifacts that are observable across many or all of the channels, and the underlying neurophysiological process of interest should not be synchronous across many channels. We found these conditions to exist for spontaneous extracellular recordings of unit activity (i.e. above 300 Hz) in the cortex of anesthetized rats made with multielectrode arrays with inter-site spacing of 150 microns, and Paralikar et al. reported a similar finding in unanesthetized rats [6].
We demonstrated the spatial localization of the extracellular spike signal by comparing signals across adjacent channels spaced by 150 microns (Figure 2), by advancing an electrode through the cortex in 50 micron increments (Figure 3), and by computing the spatial average of multiple channels and comparing it to spiking activity on a single channel (Figure 4). Our results indicate that for adequate spacing of electrode recording sites (e.g. 150 microns), the spatial average or virtual reference is unlikely to contain neural unit activity. This agrees with estimates that the recording radius of extracellular unit activity is approximately 130–140 microns [3,4]. In the case when the recording radius and electrode site spacing are approximately equal, large waveforms generated by a single neuron are unlikely to be observed on more than one recording site. Small waveforms generated by a single neuron are expected to be observed on no more than 2 recording sites.
The reasoning is depicted in Figure 18 which shows the normalized extracellular potentials of point sources overlaid on a sketch of a microelectrode array with inter-site spacing of 150 microns (5 recording sites depicted). The extracellular potential of a point source can be calculated from Equation (9), where I is a transmembrane current point source, σ is the electrical conductivity of the tissue, and r is the distance from the point source [21–23]. Equation (9) assumes an infinite volume conductor with homogenous and isotropic conductivity. If we define φ1 as in Equation (10), we can rewrite Equation (9) in the form of Equation (11) which shows the 1/r scaling of the extracellular potential with distance from the point source. In Figure 18, the normalized extracellular potentials of multiple point sources are plotted, assuming the transmembrane current source to be equal for each point source.
| (9) |
| (10) |
| (11) |
Figure 18.
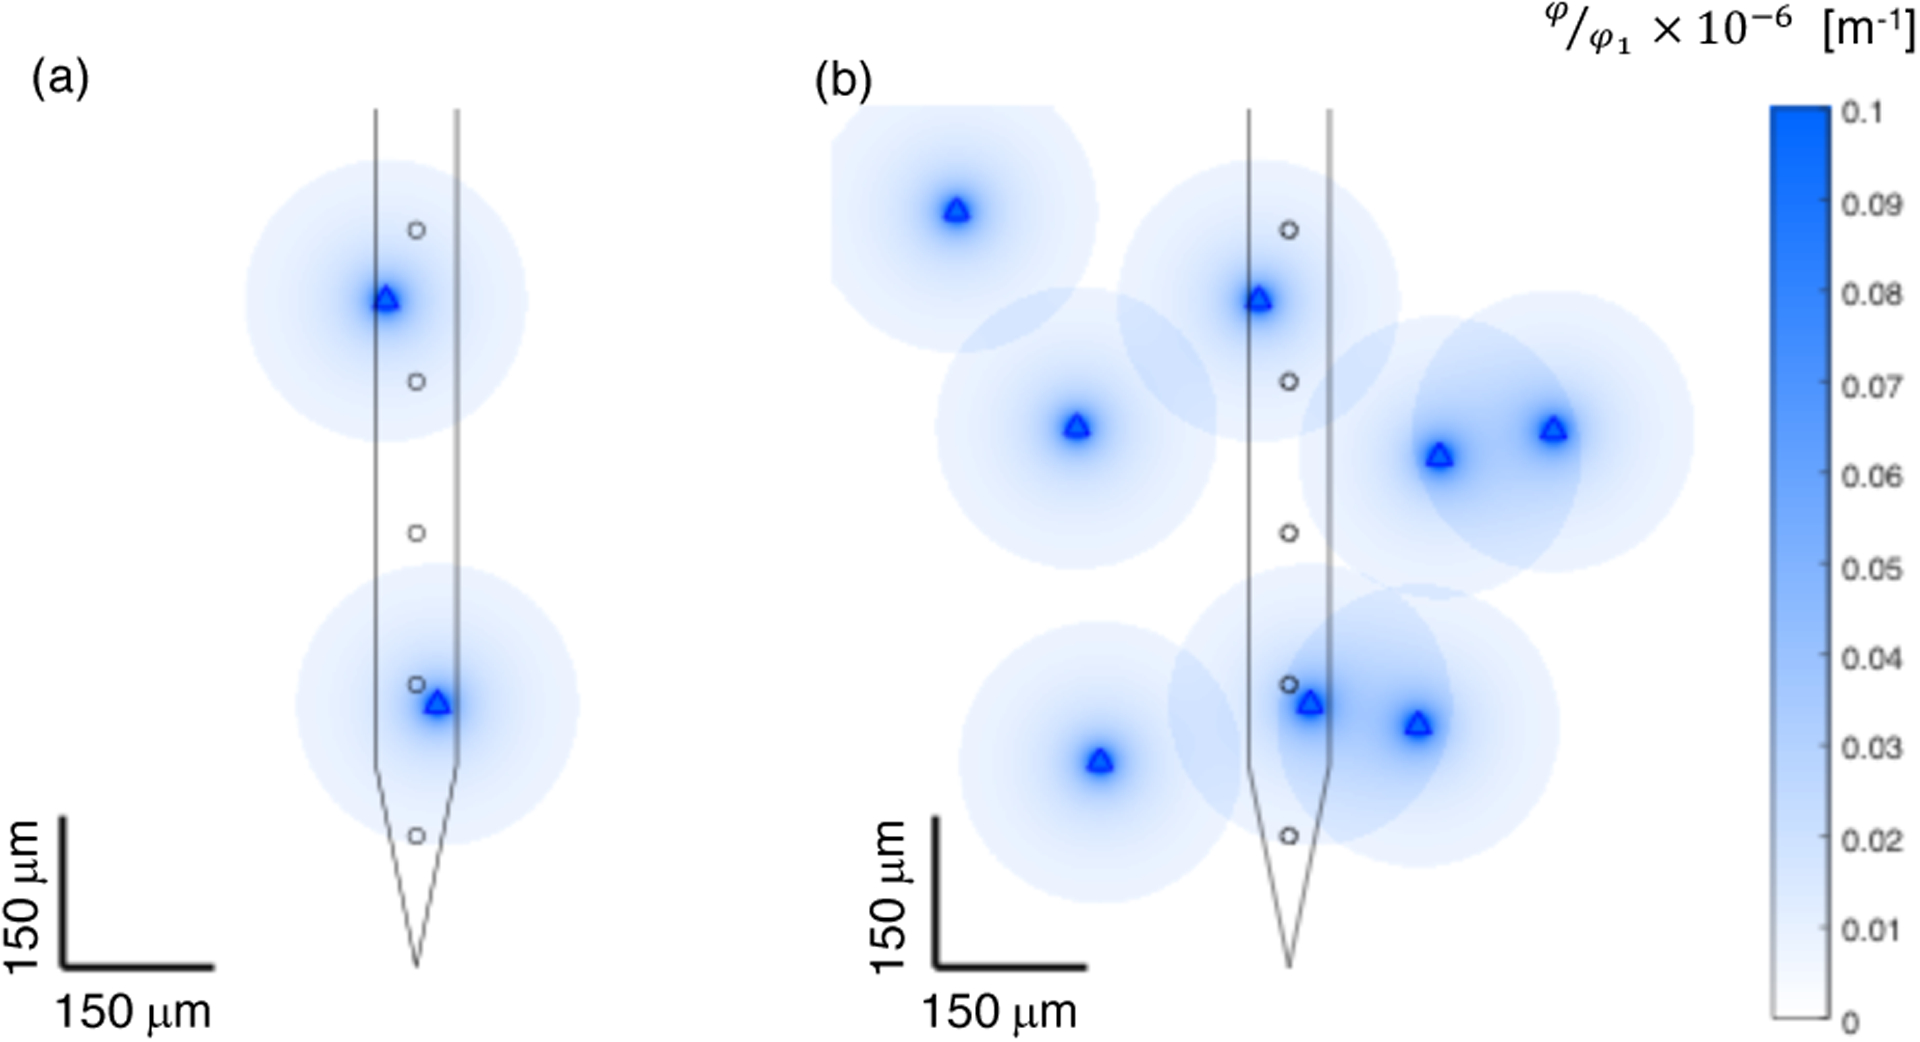
Simplified depiction of recording radius and 1/r extracellular potential decay from point sources overlaid with sketch of microelectrode array with inter-site spacing of 150 microns. (a) Two point sources depicted, one nearly equidistant from two recording sites, the other very close to one recording site. (b) Eight point sources overlaid. Each point sources is assumed to be detectable at a distance of 140 microns from the source, and the strength of the extracellular potential is assumed to decrease as 1/r. Each source is detectable on at most 2 electrode recording sites, and will be observed with large amplitude on at most 1 electrode recording site.
In this situation, the spatial average of K channels will scale the amplitude of waveforms observed on a single channel by ~ 1/K, or by ~2/K for waveforms observed on two channels. For example, for 16 channels, an extracellular spike waveform with peak amplitude 200 microvolts (which is quite large) will be reduced to approximately 12.5 microvolts if it is observed on a single channel, or 25 microvolts if it is observed (synchronously and in-phase) on 2 channels (assuming zero-mean and independence of waveforms on other channels). However, if the waveform is observed on 2 channels, it is unlikely to be observed as a 200-microvolt peak waveform, because the peak amplitude decreases with distance of the neuron from the recording site by at least 1/r for monopolar contributions (1/r2 for dipole) [1]. Regardless, the noise floor achieved in multi-channel recording with silicon microelectrodes is often in the range of 20–40 microvolts, so even a very large waveform is reduced to below the noise floor for 16 channel recording.
The removal of neural spike activity by spatial averaging to create a virtual reference is an important advantage of the method in comparison to simple differential referencing. Differential referencing to a single channel works well if a ‘quiet’ channel possessing no neural activity of interest but containing a similar noise profile to the recording channel is available. If the amplitude and phase of the noise/artifacts are the same, it can be simply subtracted from the recording channel. Alternatively, adaptation of the quiet channel can be used to match the noise magnitude and phase on the recording channel. Such approaches are available in some commercial neural recording software packages. However, this requires searching for an appropriate ‘quiet’ channel to serve as a reference channel, which may not be available. Additionally, if a channel that is observing spiking activity is used as a reference, the inverse of the reference signal will be added to each recording site that is referenced to it, which is obviously undesirable.
Using a virtual reference [6], or CAR as a differential reference helps resolve these issues by guaranteeing the availability of a ‘quiet’ channel provided that the following conditions exists: adequate channel count and spacing, and asynchronous neurophysiological activity of interest. Still, the virtual reference has drawbacks if the noise amplitude or phase are inconsistent across channels. Therefore, others have proposed the adaptive CAR (ACAR) for ECoG [9], EMG [10], and even LFP recordings [11]. Using an adaptive virtual reference solves the issue of inconsistent amplitude or phase of noise across channels, because an adaptive filtering algorithm is used to match the magnitude and phase of the virtual reference to each channel. To the authors’ knowledge, this approach has not been previously reported for extracellular recording of neuronal spikes.
In comparison to the clever IEC approach which was previously used to reject common mode signals that appeared ‘spike-like’ and were detected using the common σn based threshold detection method [6], our adaptive virtual referencing approach has a clear advantage: it reduces the noise floor and spike detection threshold. Therefore, we are able to detect spike activity that was below the σn based detection threshold or even below the noise floor before adaptive virtual referencing.
We demonstrated the use of adaptive virtual referencing of extracellularly recorded spiking activity in both acute and chronic electrode implantation experiments, and on the benchtop and in the bore of a 16.4T MRI scanner. All of our recordings were made in anesthetized rats with relatively quiet spiking activity. On the benchtop, we showed that we could reduce the noise floor and detect more small amplitude (distant) neuron spikes. Furthermore, AVR provided superior results in comparison to VR, SVR, and ZCA whitening in terms of noise reduction and spike detection. Meanwhile, AVR has low computational complexity and is realizable in real-time. The results in the bore of a 16.4T MRI scanner were even more impressive than on the benchtop, because the noise and interference were substantially larger than on the benchtop. The adaptive virtual reference was able to remove mechanical vibration artifacts and significantly reduce the increased noise floor that was created by enabling magnet hardware (the gradient amplifiers). Unfortunately, with 2 microvolt/bit resolution in the bore of the 16.4T scanner, we were forced to use a bandpass of 300–3000 Hz for spike activity, rather than 300–6000 Hz which we used in most situations. We saw that this negatively impacted spike waveform shapes, but we were still able to identify unit activity and perform basic clustering of units into subgroups (that may still contain more than single units). On the other hand, the use of a high-resolution digital recording system should overcome this drawback.
The recording environments of the benchtop and inside the 16.4T MRI bore are quite different, with significantly increased technical difficulty for performing extracellular recording inside the MRI bore, yet adaptive virtual referencing was beneficial in both cases. This advancement offers an opportunity for conducting simultaneous fMRI and neural recording studies aiming to investigate the neuro-vascular relation, even at UHF. In addition, adaptive virtual referencing is likely to be useful in a variety of situations, for example in recordings from awake behaving subjects that are prone to motion artifacts, in neural recordings from humans during surgery, and in brain computer interface (BCI) applications. The extension of AVR to these applications, particularly BCI, will require validation of the approach with real-time spike sorting methods such as template matching based sorting.
Additionally, further study is needed to determine the effects of AVR, if any, for extraction and classification of extracellularly recorded spikes with respect to neuronal dynamics and precise cell firing patterns. Precise firing sequences detected in cell assemblies are likely to play a key role in neural communication, and the detection of such firing sequences has been considered [24,25]. The importance of such precise firing sequences in neural dynamics is further considered in [26,27]. Due to the importance of firing sequences in neural encoding, the influence of AVR on precise firing sequences should be studied to evaluate the potential for BCI applications that rely on neural encoding/decoding.
With the ever-increasing availability of higher channel counts and recording site densities in multielectrode arrays [28–30], one might wonder how adaptive virtual referencing can be applied to data recorded from these new high-density arrays. We have emphasized in this paper that the virtual reference requires adequately spaced electrode sites so that neurophysiologically interesting signals are removed from the reference. We propose that for high density electrodes that have inter-site spacing smaller than the approximate recording radius of extracellular spike activity, but still span an adequately large distance, that data be processed in subsets. That is if the site spacing is 50 microns and the recording radius is conservatively estimated as 150 microns, the data could be processed in 3 subsets for generating common mode signals such that in each subset the site spacing is 150 microns. Researchers should consider the inter-site spacing, recording range, and the number of sites available for creating the virtual referencing in applying our adaptive virtual referencing technique to extracellularly recorded spike activity.
Acknowledgements
This work was supported in part by NIH grant R01 MH111413, P41 EB027061, P30 NS076408, S10 RR025031, and by the University of Minnesota’s MnDRIVE (Minnesota’s Discovery, Research and Innovation Economy) initiative.
References
- [1].Buzsáki G, Anastassiou CA and Koch C 2012. The origin of extracellular fields and currents-EEG, ECoG, LFP and spikes Nat. Rev. Neurosci 13 407–20 [DOI] [PMC free article] [PubMed] [Google Scholar]
- [2].Lewicki MS 1998. A review of methods for spike sorting : the detection and classification of neural action potentials Netw. Comput. Neural Syst 9 R53–78 [PubMed] [Google Scholar]
- [3].Rey HG, Pedreira C and Quian Quiroga R 2015. Past, present and future of spike sorting techniques Brain Res. Bull 119 106–17 [DOI] [PMC free article] [PubMed] [Google Scholar]
- [4].Mechler F, Victor JD, Ohiorhenuan I, Schmid AM and Hu Q 2011. Three-dimensional localization of neurons in cortical tetrode recordings J. Neurophysiol 106 828–48 [DOI] [PMC free article] [PubMed] [Google Scholar]
- [5].Andersen P, Bliss TVP and Skrede KK 1971. Unit analysis of hippocampal population spikes Exp. Brain Res 13 208–21 [DOI] [PubMed] [Google Scholar]
- [6].Paralikar KJ, Rao CR and Clement RS 2009. New approaches to eliminating common-noise artifacts in recordings from intracortical microelectrode arrays: inter-electrode correlation and virtual referencing J Neurosci Methods 181 27–35 [DOI] [PMC free article] [PubMed] [Google Scholar]
- [7].Dien J 1998. Issues in the application of the average reference: Review, critiques, and recommendations Behav. Res. Methods, Instruments, Comput 30 34–43 [Google Scholar]
- [8].Idiyatullin D, Zhu W, Zhang Y, Zhu X, Chen W and Ugurbil K 2018. Novel multi-slab GRASE sequences for fMRI. Comparison with EPI. Proc Intl Soc Mag Reson Med (Paris, France: ) p 5457 [Google Scholar]
- [9].Kelly JW, Siewiorek DP, Smailagic A and Wang W 2013. Automated filtering of common-mode artifacts in multichannel physiological recordings IEEE Trans. Biomed. Eng 60 2760–70 [DOI] [PMC free article] [PubMed] [Google Scholar]
- [10].Rehbaum H and Farina D 2015. Adaptive common average filtering for myocontrol applications Med. Biol. Eng. Comput 53 179–86 [DOI] [PubMed] [Google Scholar]
- [11].Xinyu L, Hong W, Shan L, Yan C and Li S 2017. Adaptive common average reference for in vivo multichannel local field potentials Biomed. Eng. Lett 7 7–15 [DOI] [PMC free article] [PubMed] [Google Scholar]
- [12].Abeles M and Goldstein MH 1977. Multispike Train Analysis Proc. IEEE 65 762–73 [Google Scholar]
- [13].Aksenova TI, Chibirova OK, Dryga OA, Tetko IV, Benabid AL and Villa AEP 2003. An unsupervised automatic method for sorting neuronal spike waveforms in awake and freely moving animals Methods 30 178–87 [DOI] [PubMed] [Google Scholar]
- [14].Chibirova OK, Aksenova TI, Benabid AL, Chabardes S, Larouche S, Rouat J and Villa AEP 2005. Unsupervised Spike Sorting of extracellular electrophysiological recording in subthalamic nucleus of Parkinsonian patients BioSystems 79 159–71 [DOI] [PubMed] [Google Scholar]
- [15].Wouters J, Kloosterman F and Bertrand A 2018. Towards online spike sorting for high-density neural probes using discriminative template matching with suppression of interfering spikes J. Neural Eng 15 [DOI] [PubMed] [Google Scholar]
- [16].Kuo SM and Morgan DR 1996. Active noise control systems (New York: Wiley; ) [Google Scholar]
- [17].Widrow B, Glover JR, McCool JM, Kaunitz J, Williams CS, Hearn RH, Zeidler JR, Dong E and Goodlin RC 1975. Adaptive Noise Cancelling: Principles and Applications Proc. IEEE 63 1692–716 [Google Scholar]
- [18].Quian Quiroga R, Nadasdy Z and Ben-Shaul Y 2004. Unsupervised spike detection and sorting with wavelets and superparamagnetic clustering Neural Comput 16 1661–87 [DOI] [PubMed] [Google Scholar]
- [19].Donoho DL and Johnstone JM 1994. Ideal spatial adaptation by wavelet shrinkage Biometrika 81 425–55 [Google Scholar]
- [20].Orfanidis SJ 2007. SVD , PCA , KLT , CCA , and All That Optim. Signal Process 1–77 [Google Scholar]
- [21].Rall W 1962. Electrophysiology of a dendritic neuron model Biophys. J 2 145–67 [DOI] [PMC free article] [PubMed] [Google Scholar]
- [22].Pettersen KH, Lindén H, Dale AM and Einevoll GT 2012. Extracellular spikes and CSD Handb. Neural Act. Meas 1 92–135 [Google Scholar]
- [23].Ness TV, Chintaluri C, Potworowski J, Łęski S, Głąbska H, Wójcik DK and Einevoll GT 2015. Modelling and analysis of electrical potentials recorded in microelectrode arrays (MEAs) Neuroinformatics 13 403–26 [DOI] [PMC free article] [PubMed] [Google Scholar]
- [24].Tetko IV and Villa AEP 2001. A pattern grouping algorithm for analysis of spatiotemporal patterns in neuronal spike trains. 2. Application to simultaneous single unit recordings J. Neurosci. Methods 105 15–24 [DOI] [PubMed] [Google Scholar]
- [25].Abeles M and Gat I 2001. Detecting precise firing sequences in experimental data J. Neurosci. Methods 107 141–54 [DOI] [PubMed] [Google Scholar]
- [26].Izhikevich EM, Gally JA and Edelman GM 2004. Spike-timing dynamics of neuronal groups Cereb. Cortex 14 933–44 [DOI] [PubMed] [Google Scholar]
- [27].Russo E and Durstewitz D 2017. Cell assemblies at multiple time scales with arbitrary lag constellations Elife 6 1–31 [DOI] [PMC free article] [PubMed] [Google Scholar]
- [28].Miccoli B, Lopez CM, Goikoetxea E, Putzeys J, Sekeri M, Krylychkina O, Chang S-W, Firrincieli A, Andrei A, Reumers V and Braeken D 2019. High-density Electrical Recording and Impedance Imaging With a Multi-Modal CMOS Multi-Electrode Array Chip Front. Neurosci 13 641. [DOI] [PMC free article] [PubMed] [Google Scholar]
- [29].Klein L, Pothof F, Raducanu BC, Klon-Lipok J, Shapcott KA, Musa S, Andrei A, Aarts AAA, Paul O, Singer W and Ruther P 2020. High-density electrophysiological recordings in macaque using a chronically implanted 128-channel passive silicon probe J. Neural Eng [DOI] [PubMed] [Google Scholar]
- [30].Chung JE, Joo HR, Fan JL, Liu DF, Barnett AH, Chen S, Geaghan-Breiner C, Karlsson MP, Karlsson M, Lee KY, Liang H, Magland JF, Mehaffey WH, Tooker AC, Brainard MS, Greengard LF, Tolosa VM and Frank LM 2019. High-density, long-lasting, and multi-region electrophysiological recordings using polymer electrode arrays Neuron 101 21–31 [DOI] [PMC free article] [PubMed] [Google Scholar]


