. 2021 Apr 20;10:e66537. doi: 10.7554/eLife.66537

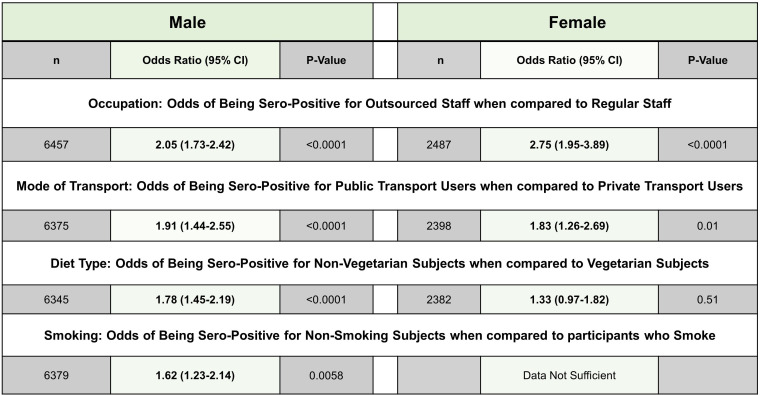
Figure 3. Demographics of data available for different variables.

Figure 3—source data 1. Raw data for Figure 3.
Figure 3—source data 2. Source file for tables show in Figure 3.

Figure 3.

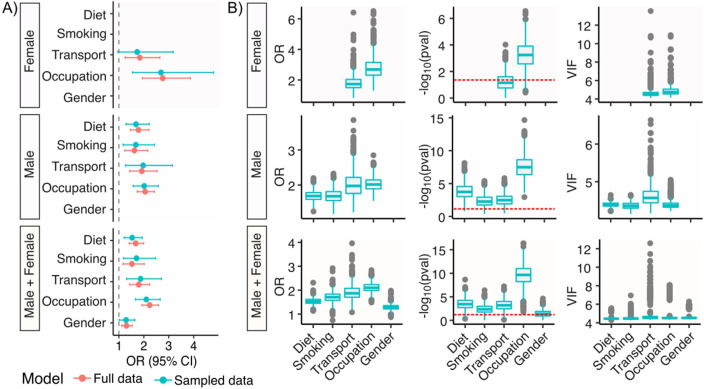
Figure 3—figure supplement 1. Regression model of seropositivity.

Figure 3—figure supplement 1.

(A) Odds ratio of full dataset and sampled dataset obtained from model. (B) Odds ratio, p value, and variance inflation factor (VIF) for sampled dataset with iterations on regression model. For diet: non-vegetarian against vegetarian; for smoking: non-smoking against smoking; for transportation: public against private; for occupation: outsourced staff against staff; for gender: male against female.