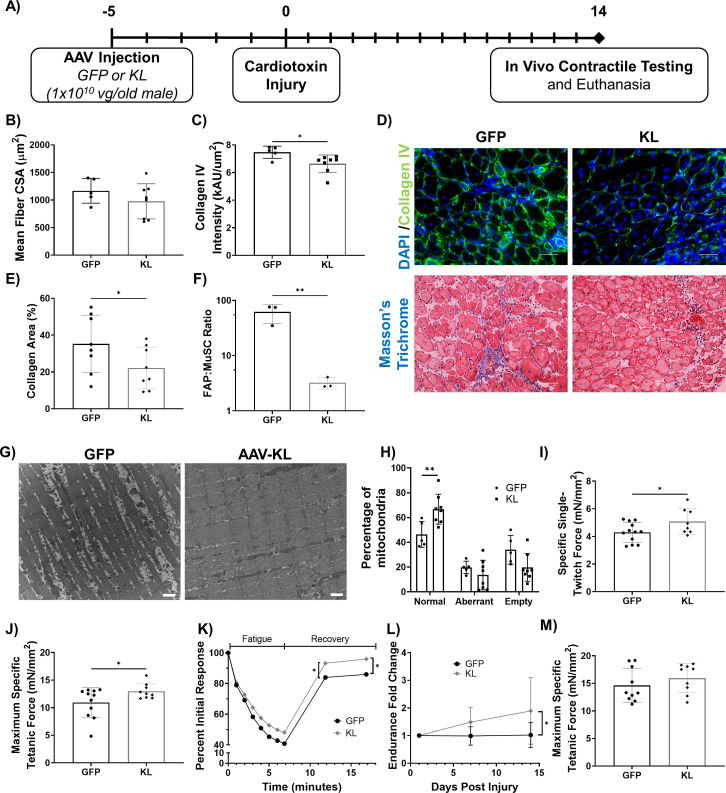
Figure 5. Gene delivery of Klotho enhances functional muscle regeneration following an acute injury.
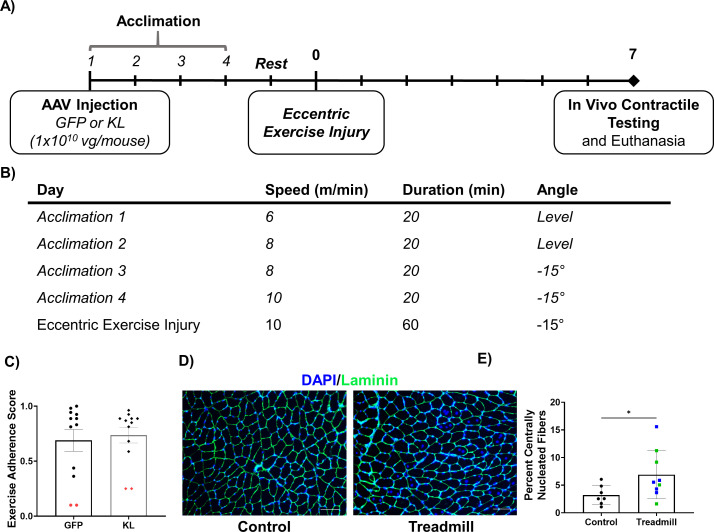
(A) Experimental design using old (21–24 months) male mice. (B) Quantification of TA average myofiber cross-sectional area (N = 13). (C) Collagen IV expression in the TA muscle of GFP- versus KL-treated mice (one-tailed Mann-Whitney test, N = 13). (D) Top: Representative images of injured TA muscles stained for collagen IV (green) and DAPI (blue, scale bars = 50 µm). Bottom: Masson’s Trichrome staining of the TA (scale bars = 50 µm). (E) Collagen area percentage in the TA quantified from Masson’s Trichrome staining (one-tailed student’s t-test, N = 16). (F) FAPs to MuSCs ratio in injured TA muscles, as determined by flow cytometry (N = 6, one-tailed student’s t-test). (G) Representative TEM images showing mitochondria in the TA muscle fibers of AAV-GFP vs. KL-treated mice. Aberrant and empty mitochondria show abnormal shape and high proportion of white space respectively (scale bars = 1μm). (H) Quantification of the quality of mitochondria (two-way ANOVA, N = 13). (I) TA specific twitch force produced 14 days post-injury (dpi) (one-tailed Student’s t-test, N = 20). (J) TA maximum specific tetanic force 14 dpi (one-tailed Student’s t-test, N = 20). (K) Change in force production of the TA over time as mice underwent a fatigue protocol consisting of repeated TA stimulation for a total of 7 min, followed by recovery over two 5-min intervals (two-way ANOVA, N = 19). (L) Fold change in whole body endurance compared to one day post injury hang impulse score (Mixed-effects analysis, N = 16). (M) TA peak tetanic specific force for mice 7 days after an eccentric injury treadmill protocol (N = 19). All data presented as mean ± SD (*p<0.05, **p<0.01).


