

Abstract
BACKGROUND AND PURPOSE: Mild cognitive impairment (MCI) may affect several cognitive domains, including attention and reasoning, but is often first characterized by memory deficits. The purpose of this study was to ask these 2 questions: 1) Can levels of CSF tau proteins and amyloid beta 42 peptide explain thinning of the cerebral cortex in patients with MCI? 2) How are brain morphometry, CSF biomarkers, and apolipoprotein E (APOE) allelic variation related to episodic memory function in MCI?
MATERIALS AND METHODS: Hippocampal volume and cortical thickness were estimated by MR imaging and compared for patients with MCI (n = 18) and healthy controls (n = 18). In addition, regions of interest (ROIs) were selected in areas where the MCI group had atrophy and which overlapped with the episodic memory network (temporal, entorhinal, inferior parietal, precuneus/posterior cingulate, and frontal). Relationships among morphometry, CSF biomarkers, APOE, and memory were tested. The analyses were repeated with an independent sample of patients with MCI (n = 19).
RESULTS: Patients with MCI and pathologic CSF values had hippocampal atrophy. However, both patients with pathologic and patients with nonpathologic CSF had a thinner cortex outside the hippocampal area. CSF pathology was related to hippocampal volume, whereas relationships with cortical thickness were found mainly in one of the samples. Morphometry correlated robustly with memory performance across MCI samples, whereas less stable results were found for tau protein.
CONCLUSION: The differences in hippocampal volume between the MCI and the healthy control groups were only found in patients with pathologic CSF biomarkers, whereas differences in cortical thickness were also found for patients without such pathologic features. Morphometry in areas in the episodic memory network was robustly correlated with memory performance. It is speculated that atrophy in these areas may be associated with the memory problems seen in MCI.
Mild cognitive impairment (MCI) is a condition that greatly increases the likelihood of the development of Alzheimer disease (AD), with an annual conversion rate from MCI to AD of 6% to 25%.1 We undertook this study to investigate the cognitive significance of biomarkers associated with MCI by asking 2 questions:
Can levels of CSF tau proteins and amyloid beta 42 peptide (Aβ42) explain thinning of the cerebral cortex in MCI? It has been argued that volumetric temporal and hippocampal damage in MCI2–5 is secondary to the pathologic depositions of Aβ426–8 and intracellular neurofibrillary tangles9 (tau proteins). Correlations between CSF biomarkers and brain morphometry in the temporal areas have been found in MCI and AD.10–12 Recent results indicate differences in thickness between patients with MCI and healthy controls outside the temporal brain areas (eg, in the frontal and parietal cortex.)5 It has not been tested whether these changes can be explained by levels of CSF biomarkers in AD, only in frontotemporal dementia.13 Furthermore, the number of ε4 alleles of the apolipoprotein E (APOE) gene is an established risk factor for AD14 and is suggested to interact with Aβ to inhibit clearance or stimulate deposition of Aβ,15 enhance Aβ production,16 and initiate cortical thinning.17
How are brain morphometry, CSF biomarkers, and APOE allelic variation related to episodic memory function in MCI? Deficit in episodic memory is the major cognitive symptom of MCI and is related to hippocampal volume in MCI and AD.18–21 However, memory has never been related to detailed measures of cortex in MCI. This is so, despite the fact that cortico-subcortical and cortico-cortical networks for episodic memory have been identified, including the medial temporal lobe structures (ie, hippocampus, entorhinal cortex), medial and lateral parietal areas (ie, precuneus/posterior cingulate, inferior parietal cortex) as well as the prefrontal cortical areas,22–23 and that thickness in the corresponding areas has been found to correlate with verbal memory in healthy controls.24 In our study, episodic memory will be related to hippocampal volume and cortical thickness in areas overlapping with this episodic memory network and where patients with MCI have probable atrophy.
The relevance of tau and Aβ to memory performance in MCI is poorly understood.25 Two studies have found that T-tau, but not Aβ42, was related to episodic memory function,26,27 whereas one found that this depended on the presence of APOE ε4 alleles.28 In none of these studies were the relationships with brain morphometry tested.
Methods
Sample
Sample characteristics are presented in Table 1. The project was approved by a committee for medical research ethics. Patients aged 40 to 79 years with MCI29 established for at least 6 months attending a university-based clinic were assessed for inclusion, all giving informed consent. Patients with no problems with activities of daily living, symptoms lasting 6 months or longer, Global Deterioration Scale score30,31 1 to 3, and Mini-Mental State Examination32 score of 23 or greater were included. Criteria for exclusion were established psychiatric disorder, cancer, drug abuse, solvent exposure, or anoxic brain damage. The first 18 patients (sample 1) were scanned on 1 MR scanner and the next 19 (sample 2), on another. Practical reasons imposed the change of scanner. Neuropsychology data for 2 participants from sample 1 are missing because 1 patient did not wish to participate further after the imaging and lumbar puncture were done, and 1 did not receive this examination because of insufficient coordination in the initial phases of the project. Healthy volunteers without deficits related to memory, emotionality, and tempo (primarily spouses of the patients) were included as controls. All controls were scanned at the same scanner as sample 1, and thus all comparisons between controls and patients with MCI are based on sample 1. In addition, 6 controls were scanned on both scanners. This was done for comparison of data from the 2 scanners. As seen from Tables 1 and 2, the 2 MCI samples were very similar.
Table 1:
Sample characteristics*
| Controls | MCI Sample 1 | MCI Sample 2 | P | |
|---|---|---|---|---|
| (SD) | (SD) | (SD) | ||
| N | 18 | 18 | 19 | |
| Women/Men | 7/11 | 7/11 | 10/9 | .63 |
| Age (43–77 y) | 63.7 (6.3) | 61.6 (9.0) | 61.8 (7.1) | .66 |
| Education | 10.8 (2.7) | 13.1 (3.3) | 11.6 (2.7) | .06 |
| GDS | NA | 2.94 (0.24) | 2.95 (0.23) | .97 |
| MMSE (23–30) | NA | 27.4 (1.9) | 27.9 (1.7) | .47 |
| Symptom duration | NA | 2.11 (1.40) | 2.98 (1.57) | .95 |
Note:—MCI indicates mild cognitive impairment; GDS, Global Deterioration Scale; MMSE, Mini-Mental State Examination.
The Pvalues are from an ANOVA with a group factor of 3 levels. Post hoc analyses confirmed that none of the contrast between the groups was significant. The MMSE was not administered to the controls. SD is presented in parentheses where relevant.
Table 2:
CSF markers and APOE status in the MCI groups
| MCI Sample 1 | MCI Sample 2 | P | |
|---|---|---|---|
| N | N | ||
| Aβ42 (pathologic/not pathologic) | 3/14 | 3/16 | .89 |
| Tau (pathologic/not pathologic) | 7/10 | 6/13 | .56 |
| Any CSF pathologic features (pathologic/not pathologic) | 8/9 | 7/12 | .55 |
| APOE ε4 alleles (0/1/2) | 8/6/4 | 10/6/3 | .58 |
Note:—MCI indicates mild cognitive impairment; Aβ42, amyloid beta 42 peptide; APOE ε4, apolipoprotein E.
P denotes the P values from an independent samples t test.
Lumbar Puncture and Laboratory Analyses
Patients, but not controls, underwent lumbar puncture, examined for CSF biomarkers for degenerative brain disease (T-tau, P-tau, and Aβ42) with commercially available kits (Innogenetics, Belgium) adapted to a Robotic Microplate 150 Processor (Tecan, Switzerland). Lumbar puncture was not performed in 1 patient in sample 1 because of recent back surgery and low back pain. The criteria for pathologic values were as follows: T-tau, 300 ng/L or more for <50 years, 450 ng/L or more for 50 to 69 years, and 500 ng/L or more for >70 years,33 P-tau, >80 ng/L, and Aβ42 < 550 ng/L. The participants were tested for APOE ε4 alleles, and scored as presence of 0, 1, or 2 ε4 alleles. The number of patients with pathologic CSF biomarkers and distribution of APOE ε4 alleles is presented in Table 2. There was large overlap between pathologic features for P-tau and T-tau, and the 2 variables were combined to 1 tau score (pathologic versus nonpathologic).
MR Imaging Scanning and Analyses
Sample 1.
A Symphony 1.5T MR scanner (syngo MR 2004A 4VA25A software) with a conventional quadrature head coil was used (Siemens, New York, NY). The pulse sequences used for morphometric analysis were two 3D magnetization-prepared rapid acquisition of gradient echo (MPRAGE), T1-weighted sequences in succession (TR, 2730 ms; TE, 3.19 ms; TI, 1100 ms; FA, 15 °; matrix, 256 × 192). Each volume consisted of 128 sagittal sections with a thickness of 1.33 mm and in-plane resolution of 1.0 mm × 1.33 mm.
Sample 2.
An Espree 1.5T MR scanner (syngo MR B13 4VB13A software) (Siemens) was used, with the following sequences: Two 3D MPRAGE, T1-weighted sequences in succession (TR, 2400 ms; TE, 3.65 ms; TI, 1000 ms; FA, 8 °; matrix, 240 × 192), 160 sagittal sections with thickness of 1.2 mm, and in-plane resolution of 1 × 1.2 mm. The 2 MPRAGES were averaged to increase the signal-to-noise ratio. MR segmentations were performed with FreeSurfer software (http://surfer.nmr.mgh.harvard.edu/). The procedures for automated thickness measurement are described elsewhere34–40 and are validated by histology and MR.41–42 Scans were also segmented to yield volumetric data for the hippocampal formation,43 including the dentate gyrus, cornu ammonis (CA) fields, subiculum/parasubiculum, and the fimbria.44 Hippocampal volume was calculated as the sum of the left and right hippocampal volume, regressed on intracranial volume (ICV). SPSS 15.0 (SPSS, Chicago, Ill) was used for the rest of the analyses.
Memory Testing
The Rey Auditory-Verbal Test (RAVLT)45–47 was used to measure episodic memory in the patients. A total of 15 words are read aloud to the patient, who subsequently recalls as many words as possible. This is repeated 5 times with the same list (learning trials). Next, an interference list is presented and to be recalled before the patient is requested to recall the first list without its being read again. After 30 minutes, the patient is asked to recall the first list of words again with no re-reading. This trial is termed 30 minutes recall. The number of correct responses on the 5 learning trials is summed to 1 learning score. To limit the number of statistical tests performed, we analyzed only the learning score and the 30 minutes recall score.
Statistical Analyses
First, ICV-corrected hippocampal volume was compared between the control and MCI groups from sample 1 by an independent samples t test. Next, cortical thickness across the brain surface was compared between the groups by use of a general linear model approach. This was done to identify areas where those with MCI have probable atrophy, and additional analyses were restricted to areas of difference, which also overlapped reasonably well with the above-described episodic memory network. To control for false-positives as a result of multiple comparisons, the distribution of P values were computed, and the degree of shift relatively to the midline was inspected. The regions of interest (ROIs) were first entered as dependent variables into 1-way analyses of variance (ANOVAs) with a group factor consisting of 3 levels: controls, MCIs from sample 1 without pathologic CSF biomarker, and MCI group from sample 1 with at least 1 pathologic CSF biomarker. This was done to test whether probable atrophy also existed in patients without pathologic CSF biomarkers. Next, the morphometry ROIs were entered into separate ANOVAs to directly test the relationship with pathologic CSF biomarker and APOE status. These analyses were performed for sample 1 and 2 separately. Because there were only 2 participants in sample 1 and 3 in sample 2 with pathologic Aβ42 values, Pearson correlations and actual Aβ42 values were used for these analyses. Finally, the morphometry variables, pathologic CSF biomarker, and APOE were correlated with RAVLT learning and 30 minutes recall in the 2 MCI samples independently. The significant relationships were then retested by partial correlations controlling for the effects of age. All analyses were run separately in sample 1 and sample 2, and the results compared. This was done to test the stability of the results and the validity of the method.
Results
Correlations Across Scanners
Volumes of hippocampus, cortex, and the lateral ventricles were estimated for the 6 healthy controls who were scanned on both scanners and correlated across scanners. The Pearson coefficients were of 0.99, 0.90, and 0.999 (all P < .05), respectively. Mean differences in cortical thickness were generally within ± 0.1 mm across the brain surface. This indicates that change of scanner did not introduce much bias in the data.
Morphometry Comparisons Between MCI and Healthy Control Groups
Both ICV-corrected (t [34] = 2.70; P = .011; MCI, −0.41; controls, 0.41) and raw (t [34] = 2.24; P = .032; MCI, 7689 mm3; SD, 1550; controls, 8615 mm3; SD, 828) hippocampal volumes were significantly smaller in MCI sample 1 than in the healthy controls. Additional analyses were done with ICV-corrected volume. Figure 1 shows a scatterplot with hippocampal volume for patients and controls. Figure 2 shows the results of the cortical comparisons, and scatterplots are presented in Fig 3. There was bilateral thinning of the cerebral cortex in MCI in large areas, especially in the temporal cortex, inferior parietal, and medial parietal areas, and partly in the superior and inferior frontal areas. A strong effect was observed in the right and a weaker in the left hemisphere extending from the posterior cingulate to precuneus. As can be seen from Fig 4, the distribution of P values is shifted to the left (thicker cortex in controls), with almost no voxels to the right of the midline (thicker cortex in MCI). This indicates that it is very unlikely that the effect of MCI on cortical thickness is a result of false-positives from multiple statistical comparisons.
Fig 1.
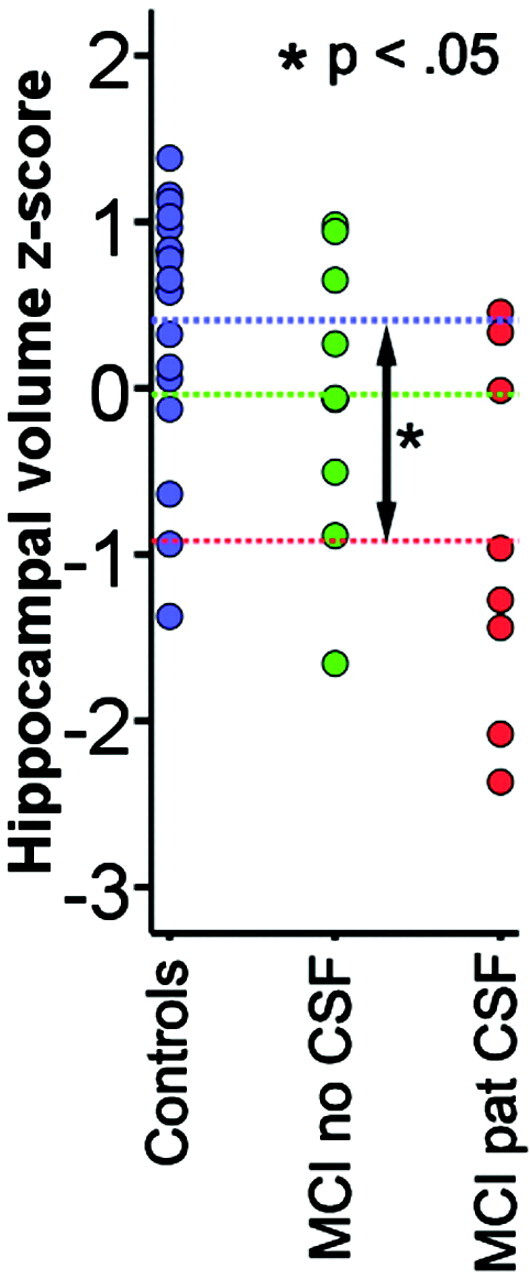
Hippocampal volume in patients with MCI versus controls. Hippocampal volume is calculated as the total volume of the right and left hippocampus and regressed on ICV. The standardized residuals are shown on the y-axis (z-scores). The patients are grouped according to whether they have pathologic (MCI pat CSF) or nonpathologic (MCI no CSF) values of tau or Aβ42. The blue-dotted lines indicate the mean value for each group. Independent samples t tests (Bonferroni corrected for multiple comparisons) showed that the patients with pathologic CSF biomarkers had significantly smaller hippocampal volume than the controls, whereas the other contrasts did not reach significance.
Fig 2.

Effects of diagnosis on cortical thickness. Points where patients with MCI have a significantly thinner cortex than normal controls are color coded as blue-green, whereas points showing the opposite pattern are coded as red-yellow. The P maps are projected onto the inflated mean brain of the total sample. From left to right is shown the right and left lateral view, and left and right medial view, respectively.
Fig 3.

Scatterplots of cortical thickness in patients versus controls. ROIs were chosen on the basis of the results from the cortical thickness comparisons. The ROIs are defined by the red lines. Mean thickness for each participant within each ROI was calculated.
Fig 4.

Distribution of P values. This figure shows the number of voxels for any given P value from the cortical comparisons illustrated in Fig 2. The left side of each chart (blue-green colors) represents a thicker cortex in healthy controls; the right side (red-yellow colors) represents a thicker cortex in the patients. As can be seen, the distribution of P values is shifted to the left, with almost no voxels to the right of the midline (indicating thicker cortex for patients). This shows clearly that the patients have a thinner cortex than the healthy controls and that it is very unlikely that this is a result of false-positives from multiple statistical comparisons.
To test whether probable atrophy could be found also in participants without pathologic CSF biomarker values, hippocampal volume and the ROIs from Fig 3 were entered into one-way ANOVAs with 3 groups (controls, MCI without pathologic CSF biomarkers, MCI with pathologic CSF biomarkers). There was a main effect of group for all variables except for the left hemisphere precuneus (P = .12) and right hemisphere superior frontal gyrus (P = .06). Post hoc testing with Bonferroni corrections for multiple comparisons showed that patients with MCI and pathologic CSF biomarkers had significantly smaller hippocampal volume than the controls, whereas this was not found for patients with MCI without pathologic values (P = .66). For the cortical ROIs, differences between the control and MCI groups without pathologic CSF were found in the left hemisphere inferior parietal cortex (P < .05), with a trend toward significance for the entorhinal cortex (P = .071) and in the right hemisphere inferior parietal gyrus, entorhinal cortex, and precuneus (P < .05) and a trend for the middle temporal gyrus (P = .073).
Correlations Between CSF Biomarkers, APOE Status, and Brain Morphometry
Table 3 presents the results of ANOVAs testing the relationships between CSF biomarkers, APOE status, and the different morphometry variables. Figure 5 illustrates scatterplots of selected relationships. In general, stronger associations were observed in sample 2 compared with sample 1. The hippocampus was related to tau in both samples, as was the left and right inferior parietal and entorhinal gyri in sample 2 and the left middle temporal gyrus in sample 1. Aβ42 and APOE were only related to morphometry in sample 2: the hippocampus and precuneus in both hemispheres, and the left entorhinal gyrus for Aβ42; and the left and right entorhinal gyri, in addition to the right precuneus, for APOE.
Table 3:
Effects of CSF biomarkers and APOE on brain morphometry*
| Tau |
Aβ42 |
APOE |
||||
|---|---|---|---|---|---|---|
| F |
R |
F |
||||
| S1 | S2 | S1 | S2 | S1 | S2 | |
| Hippocampus | 5.90†‡ | 7.86† | .30 | .51†‡ | 0.04 | 3.19 |
| A: Middle temporal LH | 5.57† | 0.00 | .20 | .11 | 1.24 | 0.16 |
| B: Inferior parietal LH | 1.50 | 16.67†‡ | −.04 | .11 | 0.87 | 2.60 |
| C: Entorhinal LH | 2.32 | 7.35† | .05 | .57†‡ | 0.42 | 4.39† |
| D: Precuneus (toward isthmus) LH | 1.42 | 1.06 | −.16 | .51†‡ | 0.98 | 2.99 |
| E: Superior frontal LH | 3.41 | 1.72 | −.08 | .24 | 0.06 | 1.93 |
| A: Middle temporal RH | 1.06 | 0.77 | −.19 | .27 | 0.08 | 1.47 |
| B: Inferior parietal RH | 2.24 | 10.30†‡ | −.11 | .29 | 0.76 | 0.90 |
| C: Entorhinal RH | 1.35 | 11.32†‡ | −.19 | .23 | 0.27 | 3.62† |
| D: Precuneus (toward isthmus) RH | 0.50 | 3.80 | −.25 | .59†‡ | 1.15 | 3.85† |
| E: Superior frontal RH | 0.00 | 0.31 | −.06 | .11 | 0.51 | 1.24 |
Note:—S1 indicates Sample 1; S2, Sample 2; LH, left hemisphere; RH, right hemisphere; Aβ42, amyloid beta 42 peptide; APOE, apolipoprotein E; F, F-ratio; R, Pearson r.
The effects of the APOE genotype and pathologic values of CSF biomarkers tau and Aβ42 on the morphometry (thickness or volume) of the brain in regions that are significantly different between healthy controls and patients with MCI. Because only 3 participants had pathologic Aβ42 values in each sample, the absolute Aβ42 values were used instead of cutoff values, and the relationships were tested with Pearson correlations. In the rest of the analyses, ANOVA was used. Hippocampus is the sum of the left and right hippocampus, regressed on intracranial volume, and the residuals are used in the analyses. The capital letters refer to the cortical ROI from Fig 3.
P < .05.
P < .05 when the effect of age is controlled for.
Fig 5.

Relationships between tau pathologic features and brain morphometry. Hippocampal volume and mean thickness in left hemisphere entorhinal ROI compared across groups of pathologic (pato) versus nonpathologic (norm) T-tau or P-tau values.
The significant relationships were retested with age as a covariate. In sample 1, the relationships between the tau and the hippocampus survived. In sample 2, the association between tau pathology and the left and right inferior parietal gyri and the right entorhinal gyrus survived, as did the relationships among Aβ42 and the hippocampus, the left and right precuneus, and the left entorhinal gyrus.
Correlations Between Psychometric Memory Performance and Brain Morphometry
Mean scores for RAVLT learning and 30 minutes recall was 33.6 (SD, 11.99) and 5.9 (SD, 3.7) in sample 1, and 32.7 (SD, 10.2) and 5.7 (SD, 3.7) in sample 2. Correlations between memory scores and the biomarkers are presented in Table 4 and scatterplots in Fig 6. Of the 10 morphometry variables, 5 and 6 correlated significantly with RAVLT learning in samples 1 and 2, respectively, whereas 3 showed a trend toward significance (P < .06). The correlations with RAVLT 30 minutes recall were much smaller in sample 1, where 1 reached significance and 1 showed a trend. In sample 2, the same 6 variables correlated with 30 minutes recall and learning, in addition to the inferior parietal gyrus and middle temporal gyrus. Tau correlated significantly with both learning and 30 minutes recall in sample 2. The significant relationships were then retested by partial correlations controlling for the effects of age. In sample 2, the hippocampus and entorhinal gyrus still correlated with both learning and 30 minutes recall, whereas tau correlated with 30 minutes recall.
Table 4:
Correlations between biomarkers and episodic memory
| RAVLT Learning* |
RAVLT 30 Minutes’ Recall |
|||
|---|---|---|---|---|
| R |
R |
|||
| S1 | S2 | S1 | S2 | |
| Hippocampus | .49§ | .70†‡ | .35 | .71†‡ |
| A: Middle temporal LH | .51† | .38 | .33 | .22 |
| B: Inferior parietal LH | .67† | .44§ | .48‡ | .53† |
| C: Entorhinal LH | .66† | .64†‡ | .46 | .64†‡ |
| D: Precuneus (toward isthmus) LH | .50† | .48† | .15 | .44† |
| E: Superior frontal LH | .43 | .42 | .24 | .38 |
| A: Middle temporal RH | .49§ | .34 | .16 | .39† |
| B: Inferior parietal RH | .56† | .49† | .53† | .60† |
| C: Entorhinal RH | .35 | .50† | .23 | .53† |
| D: Precuneus (toward isthmus) RH | .28 | .54† | .04 | .54† |
| E: Superior frontal RH | .38 | .36 | .29 | .22 |
| Tau | −.28 | −.60† | −.09 | −.73†‡ |
| Aβ42 | .09 | .42 | .33 | .35 |
| APOE | −.09 | −.17 | −.34 | −.18 |
Note:—S1 indicates Sample 1; S2, Sample 2; RAVLT, Rey Auditory-Verbal Test; APOE, apolipoprotein E; Aβ42; amyloid beta 42 peptide; LH, left hemisphere; RH, right hemisphere; R, Pearson r.
RAVLT learning is the sum of correct responses across learning trials 1 to 5. APOE is quantified as the number of ε4 alleles (0, 1, or 2). For tau, cutoff criteria are used in the analyses (0 for nonpathologic, 1 for pathologic), whereas for Aβ42 the actual values are used because only 2 participants in Sample 1 had pathologic values.
P < .05.
P < .05 when the effect of age is controlled for.
P < .06.
Fig 6.

Relationships between cortical thickness and episodic memory. Hippocampal volume/mean thickness in left hemisphere ROIs from Fig 3 and RAVLT learning and 30 minutes delayed recall score. The y-axes depict the number of words recalled, whereas the x-axes depict thickness or ICV-corrected volume.
Discussion
There are 2 main findings in our study: 1) Although the patients with pathologic CSF biomarker levels (but not the patients with nonpathologic levels) had smaller hippocampal volume than controls, differences in cortical thickness were found also in patients with MCI without pathologic CSF biomarkers. 2) Episodic memory correlated with morphometry in areas overlapping with the episodic memory network.
Can levels of CSF tau proteins and Aβ42 explain thinning of the cerebral cortex in MCI?
Our results indicate that especially tau-pathology is related to reductions in hippocampal volume in MCI. The findings of a reduced hippocampus in MCI are in accordance with previous reports,43,48 but the new finding was that this difference depended on the participants with pathologic CSF biomarkers. This fits with knowledge that tau-related pathologic features (neurofibrillary tangles) are initially limited to the hippocampus, the entorhinal cortex, and adjacent limbic structures,49 whereas amyloid deposition is more distributed.25,50,51
Our data are in accordance with recent results showing widespread cortical thinning in MCI.5 The current sample is small, but the similarity of findings indicates that the results probably are valid. The thinning was quite symmetric across hemispheres and was located mainly in the temporal (lateral and medial) and inferior parietal cortices, in addition to parts of the superior frontal cortex and some more scattered medial parietal and frontal effects. In several ROIs, differences between patients and controls did not depend on the patients with pathologic CSF biomarkers. Thus, these data indicate that patients with pathologic CSF levels alone do not account for the group effect of a thinner cortex in MCI. It seems that tau-related pathologic features strike the hippocampus aggressively, as indicated by de Leon et al,11 but cannot account for all cortical atrophy in MCI.
When the brain areas that distinguished the patients from the controls were related directly to the CSF biomarkers and APOE status, it was found that tau was related to 2 of the 10 ROIs in sample 1 and 5 in sample 2. Aβ42 was related to none of the ROIs in sample 1 but 4 in sample 2, and APOE status was related to 3 ROIs in sample 2. In general, the effects were stronger in sample 2, but the relationship between the hippocampus and tau pathologic features was replicated across samples. The relationship between tau and hippocampal volume is well known,11–12 but relationships between tau pathologic features and thickness in widespread cortical areas, to our knowledge, have not been reported previously. The discrepant findings across the 2 samples indicate that these effects are not very robust, however. Still, although relationships between tau pathologic features and cortical thickness in selected ROIs were found in the patients from sample 2, group differences in thickness existed also independently of this pathologic process. Longitudinal data are needed to better assess the effects of tau pathologic features on the cortical morphometry in MCI.
How are brain morphometry, CSF biomarkers, and APOE related to episodic memory function in patients with MCI?
There were 7 of the 10 morphometry variables that correlated with the learning score in at least 1 of the samples, whereas 5 of these were significant or near significant in both samples. For instance, the entorhinal gyrus and precuneus in the left hemisphere correlated with learning in both samples, whereas the hippocampus correlated strongly in sample 2 and was marginally significant in sample 1. These are core structures in the episodic memory network. In sample 2, there was an almost perfect correspondence between the results for learning and 30 minutes recall, indicating that atrophy in the episodic memory network in MCI affects both learning and 30 minutes’ recall performance.
Of the CSF biomarkers, tau pathologic features correlated with learning and recall in sample 2. Correlations between tau and memory have been found previously.26,27 Our results partly confirm this, but the discrepant findings in sample 1 indicate that this relationship is not very robust. Aβ42 and APOE did not correlate with memory performance in either of the samples. Thus, it seems that morphometry and episodic memory correlated robustly across samples, whereas the results for tau are less stable.
Our results indicate that the differences in morphometry within the MCI group have cognitive correlates. Several of the brain areas with probable atrophy in MCI correlated with memory function. Buckner22 suggested that dysfunction of a neural network including the medial temporal lobe and the precuneus, extending into the posterior cingulate and retrosplenial cortex, may be central in explaining the memory deficits associated with AD. In our study, morphometric differences and correlations with episodic memory were identified in these areas, indicating that atrophy here contributes to the memory problems seen in MCI. However, the effect of age is substantial on both brain morphometry40 and episodic memory function,52 and the results should be replicated with larger patient groups of same-age patients.
Limitations
Previous knowledge about the episodic memory network guided the selection of the ROIs, but the exact placement and size of each were based on where controls and patients with MCI differed in thickness. This was done to ensure that the ROIs reflected brain areas where the patients are likely to have atrophy and thus are areas relevant for the disease. However, exact definition of the ROIs a priori would be a more solid approach. The samples were scanned on different scanners, which may potentially lead to biased results. However, the replication of the results across the 2 samples makes this less likely and increases the generalizability of the conclusions. Furthermore, it has been shown that the segmentation approach used in our study yields thickness estimates53 and brain-behavior relationships54 that are highly reliable across different scanner platforms. The original voxel resolution was not identical between the 2 scanner platforms (1.0 × 1.33 mm vs 1.0 × 1.2 mm). Still, the high correlations between the estimated volumes of the different structures indicate that this difference did not introduce much bias in the data and that the results across samples can be compared. Another point relates to the relatively small difference in cortical thickness between participants. However, histologic validation studies have shown that the measurement error associated with the approach used is approximately 0.25 mm,41 which is clearly less than the differences reported in our study.
Conclusion
The main conclusions from our data are that although reduction of hippocampal volume in MCI was found only in patients with pathologic CSF biomarkers, group differences in cortical thickness existed even in the absence of these biomarkers. Furthermore, brain morphometry in several ROIs correlated with episodic memory performance. The sample in our study was small, and the results must thus be interpreted with caution. The findings should be replicated with larger patient populations and longitudinal data. Still, the replication of the results across samples suggests reliability of the results.
Footnotes
The study was supported by grants to Tormod Fladby within the MedCoast initiative and from the University of Oslo to Kristine B Walhovd.
References
- 1.Petersen RC, Stevens JC, Ganguli M, et al. Practice parameter: early detection of dementia: mild cognitive impairment (an evidence-based review). Report of the Quality Standards Subcommittee of the American Academy of Neurology. Neurology 2001;56:1133–42 [DOI] [PubMed] [Google Scholar]
- 2.Bell-McGinty S, Lopez OL, Meltzer CC, et al. Differential cortical atrophy in subgroups of mild cognitive impairment. Arch Neurol 2005;62:1393–97 [DOI] [PubMed] [Google Scholar]
- 3.Karas GB, Scheltens P, Rombouts SA, et al. Global and local gray matter loss in mild cognitive impairment and Alzheimer's disease. NeuroImage 2004;23:708–16 [DOI] [PubMed] [Google Scholar]
- 4.Du AT, Schuff N, Amend D, et al. Magnetic resonance imaging of the entorhinal cortex and hippocampus in mild cognitive impairment and Alzheimer's disease. J Neurol Neurosurg Psychiatry 2001;71:441–47 [DOI] [PMC free article] [PubMed] [Google Scholar]
- 5.Singh V, Chertkow H, Lerch JP, et al. Spatial patterns of cortical thinning in mild cognitive impairment and Alzheimer's disease. Brain 2006;129:2885–93 [DOI] [PubMed] [Google Scholar]
- 6.Arriagada PV, Marzloff K, Hyman BT. Distribution of Alzheimertype pathologic changes in nondemented elderly individuals matches the pattern in Alzheimer's disease. Neurology 1992;42:1681–88 [DOI] [PubMed] [Google Scholar]
- 7.Naslund J, Haroutunian V, Mohs R, et al. Correlation between elevated levels of amyloid beta-peptide in the brain and cognitive decline. JAMA 2000;283:1571–77 [DOI] [PubMed] [Google Scholar]
- 8.Thal DR, Rub U, Orantes M, Braak H. Phases of A beta-deposition in the human brain and its relevance for the development of AD. Neurology 2002;58:1791–800 [DOI] [PubMed] [Google Scholar]
- 9.Price JL, Morris JC. Tangles and plaques in nondemented aging and preclinical Alzheimer's disease. Ann Neurol 1999;45:358–68 [DOI] [PubMed] [Google Scholar]
- 10.Wahlund, L-O, Blennow K. Cerebrospinal fluid biomarkers for disease stage and intensity in cognitively impaired patients. Neurosci Lett 2003;339:99–102 [DOI] [PubMed] [Google Scholar]
- 11.de Leon MJ, DeSanti S, Zinkowski R, et al. Longitudinal CSF and MRI biomarkers improve the diagnosis of mild cognitive impairment. Neurobiol Aging 2006;27:394–401 [DOI] [PubMed] [Google Scholar]
- 12.Hampel H, Burger K, Pruessner JC, et al. Correlation of cerebrospinal fluid levels of tau protein phosphorylated at threonine 231 with rates of hippocampal atrophy in Alzheimer disease. Arch Neurol 2005;62:770–73 [DOI] [PubMed] [Google Scholar]
- 13.Grossman MM, Farmer JJ, Leight SS, et al. Cerebrospinal fluid profile in frontotemporal dementia and Alzheimer's disease. Ann Neurol 2005;57:721–29 [DOI] [PubMed] [Google Scholar]
- 14.Corder EH, Saunders AM, Strittmatter WJ, et al. Gene dose of apolipoprotein E type 4 allele and the risk of Alzheimer's disease in late onset families. Science 1993;261:921–23 [DOI] [PubMed] [Google Scholar]
- 15.Huang Y, Weisgraber KH, Mucke L, et al. Apolipoprotein E: diversity of cellular origins, structural and biophysical properties, and effects in Alzheimer's disease. J Mol Neurosci 2004;23:189–204 [DOI] [PubMed] [Google Scholar]
- 16.Ye S, Huang Y, Mullendorff K, et al. Apolipoprotein (apo) E4 enhances amyloid beta peptide production in cultured neuronal cells: apoE structure as a potential therapeutic target. Proc Natl Acad Sci U S A 2005;102:18700–05 [DOI] [PMC free article] [PubMed] [Google Scholar]
- 17.Espeseth T, Westlye LT, Fjell AM, et al. Accelerated age-related cortical thinning in healthy carriers of apolipoprotein E epsilon 4. Neurobiol Aging 2008;29:329–40 [DOI] [PubMed] [Google Scholar]
- 18.Deweer B, Lehericy S, Pillon B, et al. Memory performance in probable Alzheimer's disease: the role of hippocampal atrophy as shown with MRI. J Neurol Neurosurg Psychiatry 1995;58:590–97 [DOI] [PMC free article] [PubMed] [Google Scholar]
- 19.Heun R, Mazanek M, Atzor KR, et al. Amygdala hippocampal atrophy and memory performance in dementia of Alzheimer type. Dement Geriatr Cogn Disord 1997;8:329–36 [DOI] [PubMed] [Google Scholar]
- 20.Mori E, Yoneda Y, Yamashita H, et al. Medial temporal structures related to memory impairment in Alzheimer's disease: an MRI volumetric study. J Neurol Neurosurg Psychiatry 1997;63:214–21 [DOI] [PMC free article] [PubMed] [Google Scholar]
- 21.Small SA, Perera GM, DeLaPaz R, et al. Differential regional dysfunction of the hippocampal formation among elderly with memory decline and Alzheimer's disease. Ann Neurol 1999;45:466–72 [DOI] [PubMed] [Google Scholar]
- 22.Buckner RL. Memory and executive function in aging and AD: multiple factors that cause decline and reserve factors that compensate. Neuron 2004;44:195–208 [DOI] [PubMed] [Google Scholar]
- 23.Buckner RL, Wheeler ME. The cognitive neuroscience of remembering. Nat Rev Neurosci 2001;2:624–34 [DOI] [PubMed] [Google Scholar]
- 24.Walhovd KB, Fjell AM, Dale AM, et al. Regional cortical thickness matters in recall after months more than minutes. Neuroimage 2006;31:1343–51 [DOI] [PubMed] [Google Scholar]
- 25.Guillozet AL, Weintraub S, Mash DC, et al. Neurofibrillary tangles, amyloid, and memory in aging and mild cognitive impairment. Arch Neurol 2003;60:729–36 [DOI] [PubMed] [Google Scholar]
- 26.Ivanoiu A, Sindic C. Cerebrospinal fluid TAU protein and amyloid beta42 in mild cognitive impairment: prediction of progression to Alzheimer's disease and correlation with the neuropsychological examination. Neurocase 2005;11:32–39 [DOI] [PubMed] [Google Scholar]
- 27.Schoonenboom SN, Visser PJ, Mulder C, et al. Biomarker profiles and their relation to clinical variables in mild cognitive impairment. Neurocase 2005;11:8–13 [DOI] [PubMed] [Google Scholar]
- 28.Andersson C, Blennow K, Johansson SE, et al. Differential CSF biomarker levels in APOE-epsilon 4-positive and -negative patients with memory impairment. Dement Geriatr Cogn Disord 2007;23:87–95 [DOI] [PubMed] [Google Scholar]
- 29.Gauthier S, Reisberg B, Zaudig M, et al. Mild cognitive impairment. Lancet 2006;367:1262–70 [DOI] [PubMed] [Google Scholar]
- 30.Reisberg B, Ferris SH, de Leon MJ, et al. Global Deterioration Scale (GDS). Psychopharmacol Bull 1988;24:661–63 [PubMed] [Google Scholar]
- 31.Auer S, Reisberg B. The GDS/FAST staging system. Int Psychogeriatr 1997;9:167–71 [DOI] [PubMed] [Google Scholar]
- 32.Folstein MF, Folstein SE, McHugh PR. Mini-mental state. J Psychiatr Res 1975;12:189–98 [DOI] [PubMed] [Google Scholar]
- 33.Sjögren M, Vanderstichele H, Agren H, et al. Tau and Abeta42 in cerebrospinal fluid from healthy adults 21–91 years of age; establishment of reference values. Clin Chem 2001;47:1776–81 [PubMed] [Google Scholar]
- 34.Dale AM, Sereno MI. Improved localization of cortical activity by combining EEG and MEG with MRI cortical surface reconstruction: a linear approach. J Cogn Neurosci 1993;5:162–76 [DOI] [PubMed] [Google Scholar]
- 35.Dale AM, Fischl B, Sereno MI. Cortical surface-based analysis. I. Segmentation and surface reconstruction. NeuroImage 1999;9:179–94 [DOI] [PubMed] [Google Scholar]
- 36.Fischl B, Sereno MI, Dale AM. Cortical surface-based analysis. II: Inflation, flattening, and a surface-based coordinate system. NeuroImage 1999;9:195–207 [DOI] [PubMed] [Google Scholar]
- 37.Fischl B, Sereno MI, Tootell RB, et al. High-resolution intersubject averaging and a coordinate system for the cortical surface. Hum Brain Mapp 1999;8:272–84 [DOI] [PMC free article] [PubMed] [Google Scholar]
- 38.Fischl B, Liu A, Dale AM. Automated manifold surgery: constructing geometrically accurate and topologically correct models of the human cerebral cortex. IEEE Trans Med Imaging 2001;20:70–80 [DOI] [PubMed] [Google Scholar]
- 39.Fischl B, Dale AM. Measuring the thickness of the human cerebral cortex from magnetic resonance images. Proc Natl Acad Sci U S A 2000;97:11050–55 [DOI] [PMC free article] [PubMed] [Google Scholar]
- 40.Salat DH, Buckner RL, Snyder AZ, et al. Thinning of the cerebral cortex in aging. Cereb Cortex 2004;14:721–30 [DOI] [PubMed] [Google Scholar]
- 41.Rosas HD, Liu AK, Hersch S, et al. Regional and progressive thinning of the cortical ribbon in Huntington's disease. Neurology 2002;58:695–701 [DOI] [PubMed] [Google Scholar]
- 42.Kuperberg GR, Broome MR, McGuire PK, et al. Regionally localized thinning of the cerebral cortex in schizophrenia. Arch Gen Psychiatry 2003;60:878–88 [DOI] [PubMed] [Google Scholar]
- 43.Fischl B, Salat DH, Busa E, et al. Whole brain segmentation. Automated labeling of neuroanatomical structures in the human brain. Neuron 2002;33:341–55 [DOI] [PubMed] [Google Scholar]
- 44.Makris N, Meyer J, Bates J, et al. MRI-based parcellation of human cerebral white matter and nuclei. Part II. Rationale and applications with systematics of cerebral connectivity. NeuroImage 1999;9:18–45 [DOI] [PubMed] [Google Scholar]
- 45.Corwin J, Bylsma FW. Translations of excerpts from the Andre Rey's psychological examination of traumatic encephalopathy and P.A. Osterreith's the complex figure copy test. Clin Neuropsychol 1993;7:3–15 [Google Scholar]
- 46.Rey A. L'examen clinique en psychologie. Paris: Presses Universitaires de France;1964
- 47.Lezak MD. Neuropsychological assessment, 3rd ed. Oxford: Oxford University Press;1995
- 48.de Leon MJ, George AE, Stylopoulos LA, et al. Early marker for Alzheimer's disease: the atrophic hippocampus. Lancet 1989;2:672–73 [DOI] [PubMed] [Google Scholar]
- 49.Mesulam MM. Neuroplasticity failure in Alzheimer's disease: bridging the gap between plaques and tangles. Neuron 1999;24:521–29 [DOI] [PubMed] [Google Scholar]
- 50.Rowe CC, Ng S, Ackermann U, et al. Imaging β-amyloid burden in aging and dementia. Neurology 2007;68:1718–25 [DOI] [PubMed] [Google Scholar]
- 51.Edison P, Archer HA, Hinz R, et al. Amyloid, hypometabolism, and cognition in Alzheimer disease: an [11C]PIB and [18F]FDG PET study. Neurology 2007;68:501–08 [DOI] [PubMed] [Google Scholar]
- 52.Weniger G, Boucsein K, Irle E. Impaired associative memory in temporal lobe epilepsy subjects after lesions of hippocampus, parahippocampal gyrus, and amygdala. Hippocampus 2004;14:785–96 [DOI] [PubMed] [Google Scholar]
- 53.Han X, Jovicich J, Salat D, et al. Reliability of MRI-derived measurements of human cerebral cortical thickness: The effects of field strength, scanner upgrade and manufacturer. Neuroimage 2006;32:180–94 [DOI] [PubMed] [Google Scholar]
- 54.Dickerson BC, Fenstermacher E, Salat DH, et al. Detection of cortical thickness correlates of cognitive performance: reliability across MRI scan sessions, scanners, and field strength. Neuroimage 2008;39:10–18 [DOI] [PMC free article] [PubMed] [Google Scholar]