

Abstract
BACKGROUND AND PURPOSE: In spite of the advent of thrombolytic therapy, CT-perfusion imaging is currently not fully used for clinical decision-making and not included in published clinical guidelines for management of ischemic stroke. We investigated whether lesion volumes on cerebral blood volume (CBV), cerebral blood flow (CBF), and mean transit time (MTT) maps predict final infarct volume and whether all these parameters are needed for triage to intravenous recombinant tissue plasminogen activator (rtPA). We also investigated the effect of intravenous rtPA on affected brain by measuring salvaged tissue volume in patients receiving intravenous rtPA and in controls.
MATERIALS AND METHODS: Forty-four patients receiving intravenous rtPA and 19 controls underwent CT perfusion (CTP) studies in the emergency department within 3 hours of stroke onset. Lesion volumes were measured on MTT, CBV, and CBF maps by region-of-interest analysis and were compared with follow-up CT volumes by correlation and regression analysis. The volume of salvaged tissue was determined as the difference between the initial MTT and follow-up CT lesion volumes and was compared between intravenous rtPA-treated patients and controls.
RESULTS: No significant difference between the groups was observed in lesion volume assessed from the CTP maps (P > .08). Coefficients of determination for MTT, CBF, and CBV versus follow-up CT lesion volumes were 0.3, 0.3, 0.47, with intravenous rtPA; and 0.53, 0.55, and 0.81 without intravenous rtPA. Regression of MTT on CBF lesion volumes showed codependence (R2 = 0.98, P < .0001). Mean salvaged tissue volumes with intravenous rtPA were 21.8 ± 17.1 and 13.2 ± 13.5 mL in controls; these were significantly different by using nonparametric (P < .03) and Fisher exact tests (P < .04).
CONCLUSIONS: Within 3 hours of stroke onset, CBV lesion volume does not necessarily represent dead tissue. MTT lesion volume alone can be used to identify the upper limit of the size of abnormally perfused brain. More brain is salvaged in patients with intravenous rtPA than in controls.
CT with physiologic imaging of cerebral perfusion (CTP) is routinely used at many centers around the world to assist in the triage of patients with acute stroke into various therapies, including intravenous thrombolysis with recombinant tissue plasminogen activator (rtPA). The use of CT in the triage process has been driven by the rapidity and wide availability of this imaging technique. Functional maps of cerebral blood volume (CBV), cerebral blood flow (CBF), and mean transit time (MTT) are readily constructed on a CT workstation and provide important information about the status of regional brain perfusion. Because giving intravenous rtPA is optimal within 3 hours of stroke ictus, it would be helpful to avoid spending time on those CTP parameters that do not provide critical information and to evaluate only those that directly impact the therapeutic decision.
A key consideration in the assessment process of patients having acute stroke symptoms is how much affected brain tissue was already infarcted, how much is inevitably going to die, and how much could be potentially salvaged by therapy. It is this functional information that is being sought by using perfusion imaging and mapping of vascular physiology.1-5 In the literature, it has been shown that lesion volumes on physiologic maps constructed from initial perfusion imaging in patients assessed in the 6- to 72-hour time window predict the final infarct volume.6-9 Furthermore, several authors have shown that the volume of the initial CBV deficit approximates the final infarct size and likely represents already irreversibly infarcted tissue.10,11
Because the development of infarction is a dynamic time-dependent process, interpretation of the maps may well vary with the time from ictus. It was our aim in this study to investigate whether the lesion volumes observed on CBV, CBF, and MTT CTP maps, obtained within 3 hours of ictus, also predicted the final infarct volume and whether all these parameters are needed for triage. In addition, we investigated the effect of intravenous rtPA on affected brain tissue by measuring the final salvaged tissue volume in patients receiving intravenous rtPA and in a control group not receiving thrombolytic therapy.
Materials and Methods
Patients
In the period from November 2002 through March 2007, there were 100 patients with acute stroke symptoms who presented to the emergency department within 3 hours of ictus and who underwent first-pass CTP. Thirty-seven patients were excluded from the study for the following reasons: In 21 patients, satisfactory registration between CTP and follow-up CT was not obtained; 4 moved substantially during data acquisition; 5 had hemorrhage on follow-up CT, making accurate determination of infarct size impossible; 2 had previous mature infarction in the same vascular territory as the current ictus; 2 did not have follow-up CT; 1 patient had an aneurysm clip that caused artifacts in the affected area; and 2 patients had therapy other than intravenous rtPA. Of the 63 patients included in the study, all had diagnostically adequate CTP within 3 hours and follow-up CT scanning within 3 days. Forty-four received intravenous rtPA, whereas the remaining 19 did not. Thrombolytic therapy has been implemented as a routine therapy in our hospital since 1998,12,13 and the inclusion and exclusion criteria for treatment principally follow the recommendations in the American Stroke Association guidelines.14 The study patients had a mean age of 69 years, and there was no difference between the rtPA-treated and control groups (P > .36). Retrospective analysis of these data was approved by the institutional review body.
Imaging
The CT imaging protocol consisted of a scout acquisition, a noncontrast series, and a first-pass CTP study. A follow-up CT scan obtained within 3 days of the initial CTP study consisted of conventional axial images through the brain without contrast. For injection of contrast material, an 18-gauge cannula was inserted into an antecubital vein. The patient's head was immobilized in a head holder and was located at the isocenter of an 8-section helical CT scanner (LightSpeed Ultra; GE Healthcare, Milwaukee, Wis).
The noncontrast scans were obtained by using a 20° gantry tilt, automilliampere option, 120 or 140 kVp, a 25-cm head scanning FOV, and the axial imaging mode. For the automilliampere option, the noise index was set to 3, resulting in tube current between 120 and 150 mA. The section thickness through the posterior fossa was 5 mm, and above the tentorium, it was 7.5 mm.
CTP was performed in the middle cerebral artery (MCA) territory at the level of the basal ganglia. CTP images were acquired by using cine mode with a 25-cm head FOV, 80-kVp tube voltage, 200-mA tube current, and 1-second rotation time. Four 5-mm sections were constructed on a 512 × 512 image matrix by using the standard reconstruction algorithm. Total imaging time was 50 seconds, resulting in 200 one-second images, 50 for each of the 4 section locations. In 40 patients, the contrast agent was iohexol 350 mg/mL (Omnipaque; GE Healthcare, Little Chalfont, Buckinghamshire, UK). In 17 patients, iohexol 300 mg/mL was used, and in 6 patients, we used iomeprol 400 mg/mL (Iomeron; Bracco, Milan, Italy). Independent of the actual contrast material, a constant 15 g of iodine was used in each patient. Data acquisition was initiated 5 seconds after starting the power injection of contrast at a rate of 7 mL/s (EnVision CT injector; Medrad, Indianola, Pa). From the CTP data, functional maps of CBF, CBV, and MTT were constructed on an independent Advantage Windows workstation by using CTP-2 software (AW 4.0; GE Healthcare).
Data Analysis and Statistical Methods
CTP-2 software was used to generate CBF, CBV, and MTT maps.2,15,16 This software is US Food and Drug Administration–approved and was deployed in a consistent manner for all patients. The analysis followed the documentation and instructions of the manufacturer.17 The arterial input function was taken from the hemisphere contralateral to the lesion, as determined by clinical history. The venous outflow was taken from the posterior portion of the sagittal sinus. Retrospective region-of-interest analysis was used to determine the lesion areas in all 4 imaged sections on these maps by visual inspection. On the MTT maps, the lesion was visually identified by the appearance of prolonged MTT, and on the CBF and CBV maps respectively, as a decrease in blood flow or blood volume. Large vessels and CSF spaces were excluded from the regions. Noncontrast follow-up CT images were analyzed by placing a region of interest around visually identified hypointense areas on images that were anatomically matched to the CTP dataset. The primary retrospective analysis was performed manually by an experienced neuroradiologist (H.M.S.), followed by confirmation of the data by consensus review between 2 neuroradiologists (H.M.S. and G.J.H.).
In each patient and in each type of image (CBV, CBF, MTT, and follow-up CT), the areas of the individual regions of interest, expressed in square millimeters, were multiplied by the section thickness, expressed in millimeters, and summed to obtain the lesion volume in cubic millimeters and converted to milliliters.
The data were divided into 2 groups: The first group contained all the patients who received intravenous thrombolysis; and the second group, all the patients who did not. We investigated whether the outcome lesion volume as seen on the follow-up CT images could be predicted from the initial lesion volumes as obtained from the physiologic maps of MTT, CBF, and CBV in the 2 groups individually. A linear regression model was used. Coefficients of regression and determination were calculated with 95% confidence limits, as well as probability values for slope deviation from zero. Comparison of the coefficients of regression obtained for each parameter was made between CBV and CBF, CBV and MTT, and CBF and MTT in the treated and nontreated groups separately. Additionally, we compared individual coefficients of regression between groups, namely CBV in treated versus nontreated, CBF in treated versus nontreated, and MTT in treated-versus-nontreated groups. These comparisons were performed by using the Fisher Z transformation and calculation of the Z statistic for each case. The Z statistic was then used to calculate a P value for the null hypothesis that there is no difference between the 2 coefficients being tested.
On theoretic grounds, MTT and CBF values should be codependent variables, linked by the central volume principle used in the generation of the CTP maps. We investigated the nature of the actual observed relationship between these parameters by using linear regression of the volumes of affected brain determined from the MTT and CBF maps.
We also evaluated whether there was a discernible effect on the amount of salvaged tissue at risk in the treated-versus-nontreated groups. Predicted salvageable tissue at risk was taken as the volume of tissue identified as abnormally perfused on the MTT maps. Because the samples were not normally distributed and to account for different sample sizes in the 2 groups, we used exact statistical tests with resampling methods.18 We also examined these data by using categoric statistical methods, specifically the Fisher exact test on a 2 × 2 contingency table. To perform this test, we divided the patients into 4 categories: 1) treated patients achieving <50% salvage of predicted salvageable tissue at risk, 2) treated patients achieving ≥50% salvage of predicted salvageable tissue at risk, 3) nontreated patients achieving <50% salvage of predicted salvageable tissue at risk, and 4) nontreated patients achieving ≥50% salvage of predicted salvageable tissue at risk.
Results
Summary demographic data and descriptive statistics are provided in On-line Tables 1 and 2 for the treated and nontreated groups, respectively. There were 63 patients, 44 who received intravenous thrombolysis and 19 who did not receive any therapy. The mean times of presentation in the emergency department after onset of ictus in these 2 groups were 91 ± 34 and 92 ± 32 minutes, respectively.
There were 20 patients (45%) in the rtPA group who did not have a visible CBV lesion at the time of CTP imaging but who developed an infarct on follow-up CT. In this same group of patients, there were 4 patients (9%) in whom the final infarct volume was smaller than the initial CBV volume; 3, 6, 10, and 18 mL were the observed differences in size between the follow-up CT infarct and the initial CBV-determined volume (Fig 1). In the nontreated group, 8 patients (42%) had no initial CBV deficit, and 1 patient (5%) had a final infarct that was 13-mL smaller than the original CBV lesion.
Fig 1.
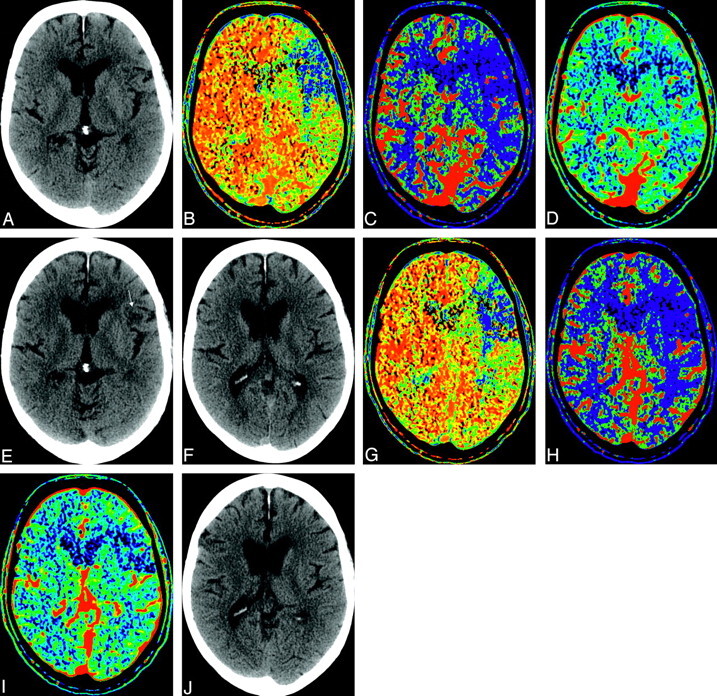
A 66-year-old patient who had right hemiparesis and underwent CTP after 65 minutes from stroke onset. Presented are maps from 2 adjacent levels as examples of reversal or decrease of CBV abnormal area. The patient was treated with intravenous thrombolysis. A, Baseline noncontrast CT. B, MTT map. C, CBF map. D, CBV map. E, Follow-up CT. F–J, Images from the next level, respectively. There is a single small infarct (arrow) seen only on 1 section at follow-up.
The initial lesion volumes as measured on MTT, CBF, and CBV maps were 35.0 ± 18.8, 34.4 ± 18.7, and 59.0 ± 98.6 mL in the treatment group and 31.1 ± 17.4, 30.6 ± 18.6, and 11.3 ± 14.2 mL in the nontreatment group, respectively. The infarct size as measured by follow-up CT was 13.9 ± 19.2 mL in the thrombolysis group and 18.6 ± 20.9 mL in the nontreated group. There were no statistically significant differences in the volume of affected tissue (P > .08) between the treated and nontreated groups for any of the parameters. The lack of statistical significance in these measures of affected tissue indicates that, notwithstanding the distribution of patients into treated-versus-nontreated groups based solely on clinical criteria, when CTP criteria are examined, the final distribution is indistinguishable from that achieved had there been random allocation to treated or nontreated categories.
Results of the linear regression and correlation between volumes measured from MTT, CBF, and CBV maps and the follow-up CT scan are presented in Fig 2 for both treated and nontreated groups. The coefficients of determination (R2) were 0.30, 0.30, and 0.47 for MTT, CBF, and CBV, respectively, in the treated group, and 0.53, 0.55, and 0.81, respectively, for the nontreated group. Similarly, the coefficients of regression (r) were 0.55, 0.55, and 0.69 for MTT, CBF, and CBV, respectively, in the treated group, and 0.73, 0.73, and 0.9, respectively, for the nontreated group. In the nontreated group, there was a significant difference between the coefficients of regression for CBV and MTT (P < .01) and for CBV and CBF (P < .02). There was no significant difference between CBF and MTT in the nontreated group (P > .45). There was no significant difference for any of the pairs in the treated group (P > .08). There was a significant difference in the coefficients of regression for CBV in the treated-versus-nontreated groups (P < .02), but not for CBF or MTT (P > .14 and P > .12, respectively).
Fig 2.
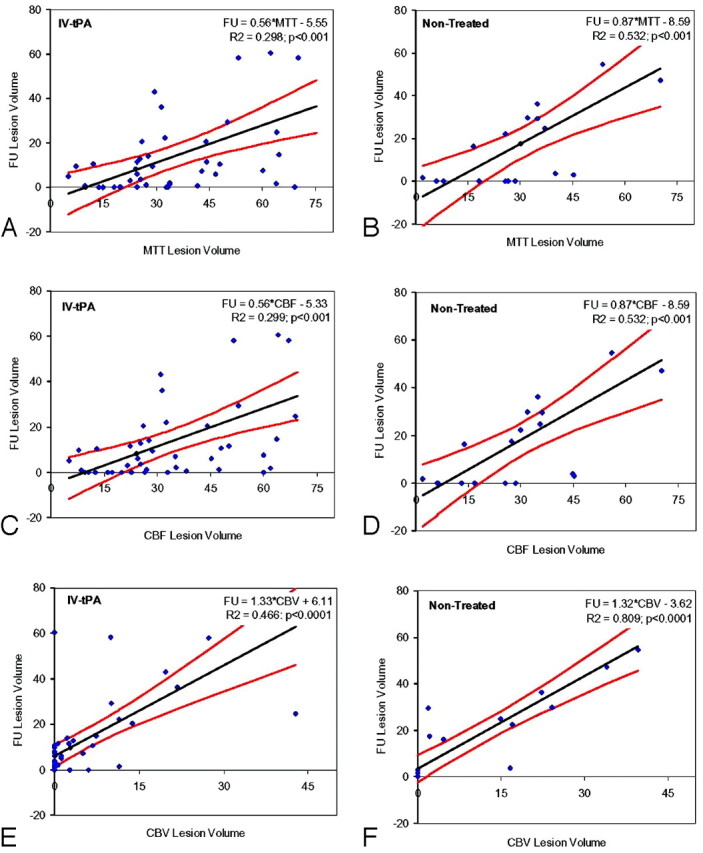
Scatter diagrams show initial lesion volume (milliliters) obtained by region-of-interest analysis of CBV, CBF, and MTT maps versus infarct size (mL) assessed on the follow-up (FU) CT scan. A and B, MTT lesion volumes in treated (A) and nontreated (B) cohorts. Presented are the regression line, 95% confidence bands, and the coefficient of determination (R2). C and D, CBF lesion volumes in treated (A) and nontreated (B) cohorts. Presented are the regression line, 95% confidence bands, and the coefficient of determination. E and F, CBV lesion volumes in treated (A) and nontreated (B) cohorts. Presented are the regression line, 95% confidence bands, and the coefficient of determination. IV indicates intravenous.
The volumes of affected tissue determined by either MTT or CBF were the same, as tested by using a paired t test (P > .2). Figure 3 shows the regression line for these data. The intercept is not significantly different from zero (P > .86), and the slope is not significantly different from unity (P > .20). Thus, only 1 of these parameters is needed for triage purposes.
Fig 3.

Scatter diagram and line of regression for correlation between lesion volumes (milliliters) measured on the MTT and CBF maps. The coefficient of determination (R2) was 0.963, and the null hypothesis that the regression line had a slope of unity was accepted (P > .2). The 95% confidence bands are very close to the regression line, and the line of unity falls within them.
The average volumes of salvaged tissue in the intravenous thrombolysis group were 21.8 ± 17.1 and 13.2 ± 13.5 mL in the nontreatment group. These values were statistically significantly different between the 2 groups (P < .03), by using a 1-tailed resampling method to determine this statistic.19
In the intravenous thrombolysis group, there were 33 patients whose salvaged tissue volume was >50% of the initially affected total volume of brain tissue and 11 patients in whom this volume was <50%. In the nontreated group, 9 patients had >50% salvaged from the initially affected brain tissue and 10 patients had <50% salvaged. The Fisher exact test rejected the null hypothesis that treatment had no effect on the volume of salvaged tissue in the treatment and nontreatment groups (P < .04).
Discussion
In our study, we retrospectively investigated a group of 63 patients with acute stroke who were brought to the emergency department within 3 hours after onset of stroke-like symptoms. The intention was to evaluate whether a simplified subset of CTP parameters could be useful in predicting the size of final infarction and to identify whether giving intravenous thrombolysis had a measurable effect on the volume of salvaged tissue.
A number of studies have demonstrated the most benefit from intravenous thrombolysis if this is given within 3 hours of stroke onset.20 In our primary stroke center, where we follow the major guidelines of the American Stroke Association and the European Stroke Initiative in triaging patients into groups receiving intravenous thrombolysis or conventional treatment,12 we have been able to increase the number of patients meeting this 3-hour therapeutic window by a variety of quality-improvement efforts. These have included education of the dispatch and in-field personnel of the emergency medical services of the city to reduce delay in the community; organization of “an early-warning system” alerting emergency department personnel that a potential thrombolysis candidate is en route; implementation of a neurologic team in the emergency department dedicated to stroke assessment; and relocation of a radiology unit to the emergency department, providing 24/7 access to a CT scanner, an Advantage Windows workstation, and a neuroradiologist. With these improvements, we have been able to shorten the time from stroke onset to CT imaging by a full hour, thereby increasing the number of patients eligible for intravenous thrombolytic therapy.13 Because similar efforts have been implemented in other institutions, it has become imperative to understand whether our current basis for interpretation of perfusion maps remains valid and unchanged when these maps now come from patients imaged well below 3 hours after stroke onset.
In our study, 9% of rtPA-treated cases had an initial CBV lesion volume that was larger than the final infarct volume and 45% did not have a visible CBV lesion at all. In the nontreated group, 5% had a CBV lesion that shrank and 42% did not have a visible CBV lesion. These results imply that in patients who are imaged <3 hours from stroke ictus, the CBV map does not necessarily indicate already-infarcted tissue but rather suggests that CBV lesion volumes should be included as a component of potentially salvageable tissue at risk in this patient population. This is supported by McKinney et al,21 who have reported a case of reversible CBV following prompt deployment of thrombolysis. These findings differ from current wisdom reported elsewhere in the literature, in which investigators have concluded that lesions seen on CBV maps indicate irreversibly infarcted tissue.10,11,22 A corollary to this statement is that mismatch between MTT and CBV lesion sizes indicates potentially salvageable tissue at risk. However, our data suggest that when CBV and MTT lesion volumes are obtained <3 hours after stroke ictus, a simpler estimate of potentially salvageable tissue at risk can be made from the MTT lesion volume alone.
In our analysis scheme (CTP-2 software), MTT and CBF are highly dependent on each other with a slope of 1 (0.98 ± 0.03) and a coefficient of determination of 0.965. In practical terms, this means that in the emergency department when a patient is being triaged to a treatment, it is enough to consider only 1 of these maps if the visible lesion size is the parameter of interest. It should be noted that the dependency of MTT and CBF may be different in other software packages due to a different algorithmic approach and that the method of analysis should be carefully considered when comparing data from various studies.
Because abnormal areas on MTT maps are visibly easier to identify than on the CBF maps, we used MTT exclusively for our analyses of potential benefit from rtPA. When we compared the lesion volumes obtained with MTT and CBF maps, it was evident that these 2 parameters were equivalent in the visual or qualitative information they provide. Our data indicate that in the absence of treatment, CBV provides the best estimate for eventual infarction size. This was shown by the fact that the coefficient of regression for the CBV versus follow-up was significantly higher than that for the CBF or MTT versus follow-up. This finding was not seen in the treated group, in which all r values were reduced. Furthermore, in the treated group, the coefficient of regression for CBV versus follow-up was not significantly different from the values obtained from the CBF or MTT data. Without intervention, infarction proceeds to its final size in a predictable fashion. It is not surprising that with intervention, this predictability is reduced because variable amounts of tissue may be salvaged that otherwise would have infarcted. This reduction in predictability is reflected in the reduced coefficients of determination for all parameters and the lack of significant difference between the coefficients of regression determined from the CBV, CBF, and MTT maps.
Using only the lesion volume estimated from the MTT maps as our indicator of potentially salvageable tissue at risk and measuring the estimated salvaged tissue, namely the difference between the initial MTT volume and the follow-up CT infarcted volume, we showed that intravenous rtPA does indeed increase the amount of tissue salvaged when compared with no treatment (P < .04). This result is consistent with work published by others showing a positive benefit from intravenous rtPA based on clinical outcome at 3 months.20 A potential consequence of our findings is that this measure of the amount of salvaged tissue (MTT and follow-up CT) could be used as an effective surrogate marker of clinical outcome. This would allow determination of benefit for any potential therapy to be made within 3 days rather than 3 months. Clearly, further studies will be needed to confirm these findings.
There are limitations to using CTP. In our study, we used an 8-section multidetector CT scanner capable of acquiring images from a 2-cm tissue volume during first-pass CTP imaging. This inevitably means that the whole volume of infarction cannot be imaged in many patients; this limitation is imposed by this equipment. However with the continued advances in scanner technology, the volume of coverage is increasing. The ideal goal is whole-brain first-pass CTP capability. Independent of the technology used, MR or CT, the acquisition time window should always be long enough in first-pass perfusion studies so as to include whole first-pass time-attenuation curves from the tissues of interest, namely the arteries, veins, gray and white matter, and ischemic brain tissue. To prevent truncation of the time-attenuation curves, we use a 7-mL/s injection rate for our routine clinical CTP protocol; this shortens the bolus and thus the width of the measured time-attenuation curves. Using this injection rate, we rarely encounter time-attenuation curve truncation in our studies. Another limitation is the processing time needed to generate the quantitative volumes of apparently abnormal brain tissue. To minimize the impact of this at presentation in the emergency department, we visually evaluate the presence or absence of hemorrhage and whether the apparent core infarct size is more than one third of the MCA territorial volume in the CTP images. These 2 imaging factors are added to clinical considerations to determine deployment of intravenous rtPA within the 3-hour window.
For the future, automated methods by using quantitative thresholds will likely improve the usability of true physiologic data in the decision-making process for thrombolysis. Our data suggest that CTP techniques can be successfully used to demonstrate the quantitative efficacy of thrombolytic agents. This initial finding will need to be confirmed with further well-controlled studies.
Supplementary Material
Footnotes
indicates article with supplemental on-line tables.
References
- 1.Hamberg LM, Hunter GJ, Halpern EF, et al. Quantitative high-resolution measurement of cerebrovascular physiology with slip-ring CT. AJNR Am J Neuroradiol 1996;17:639–50 [PMC free article] [PubMed] [Google Scholar]
- 2.Nabavi DG, Cenic A, Craen RA, et al. CT assessment of cerebral perfusion: experimental validation and initial clinical experience. Radiology 1999;213:141–49 [DOI] [PubMed] [Google Scholar]
- 3.Mayer TE, Hamann GF, Baranczyk J, et al. Dynamic CT perfusion imaging of acute stroke. AJNR Am J Neuroradiol 2000;21:1441–49 [PMC free article] [PubMed] [Google Scholar]
- 4.Esteban JM, Cervera V. Perfusion CT and angio CT in the assessment of acute stroke. Neuroradiology 2004;46:705–15 [DOI] [PubMed] [Google Scholar]
- 5.Wintermark M, Fischbein NJ, Smith WS, et al. Accuracy of dynamic perfusion CT with deconvolution in detecting acute hemispheric stroke. AJNR Am J Neuroradiol 2005;26:104–12 [PMC free article] [PubMed] [Google Scholar]
- 6.Toriyama T, Tanizaki Y, Hono K, et al. Functional image of dynamic computed tomography in diagnostic and prognostic evaluation of ischemic stroke within the first 6 hours. Stroke 1993;24:1933–44 [DOI] [PubMed] [Google Scholar]
- 7.Ueda T, Yuh WTC, Maley JE, et al. Outcome of acute ischemic lesions evaluated by diffusion and perfusion imaging. AJNR Am J Neuroradiol 1999;20:983–89 [PMC free article] [PubMed] [Google Scholar]
- 8.Schaefer PW, Hunter GJ, He J, et al. Predicting cerebral ischemic infarct volume with diffusion and perfusion MR imaging, AJNR Am J Neuroradiol 2002;23:1785–94 [PMC free article] [PubMed] [Google Scholar]
- 9.Wintermark M, Reihhart M, Thiran JP. Prognostic accuracy of cerebral blood flow measurement by perfusion computed tomography, at the time of emergency room admission, in acute stroke patients. Ann Neurol 2002;51:417–32 [DOI] [PubMed] [Google Scholar]
- 10.Lev MH, Segal AZ, Farkas J, et al. Utility of perfusion-weighted CT imaging in acute middle cerebral artery stroke treated with intra-arterial thrombolysis: prediction of final infarct volume and clinical outcome. Stroke 2001;32:2021–28 [DOI] [PubMed] [Google Scholar]
- 11.Eastwood JD, Lev MH, Wintermark M, et al. Correlation of early dynamic CT perfusion imaging with whole-brain MR diffusion and perfusion imaging in acute hemispheric stroke. AJNR Am J Neuroradiol 2003;24:1869–75 [PMC free article] [PubMed] [Google Scholar]
- 12.Lindsberg PJ, Soinne L, Roine RO, et al. Community-based thrombolytic therapy of acute ischemic stroke in Helsinki. Stroke 2003;34:1443–49 [DOI] [PubMed] [Google Scholar]
- 13.Lindsberg PJ, Häppölä O, Kallela M, et al. Door to thrombolysis: ER reorganization and reduced delays to acute stroke treatment. Neurology 2006;67:334–36 [DOI] [PubMed] [Google Scholar]
- 14.Adams HP, Adams RJ, Brott T, et al. Guidelines for the early management of patients with ischemic stroke: a scientific statement from the Stroke Council of the American Stroke Association. Stroke 2003;34:1056–83 [DOI] [PubMed] [Google Scholar]
- 15.Nabavi DG, Genic A, Henderson S, et al. Perfusion mapping using computed tomography allows accurate prediction of cerebral infarction in experimental brain ischemia. Stroke 2001;32:175–83 [DOI] [PubMed] [Google Scholar]
- 16.Genic A, Nabavi DG, Craen RA, et al. Dynamic CT measurement of cerebral blood flow: a validation study. AJNR Am J Neuroradiol 1999;20:63–73 [PubMed] [Google Scholar]
- 17.User Guide: CT Perfusion 2, 2271027–100 Revision 3. Milwaukee, Wis: GE Healthcare:2002
- 18.Lunneborg CE. Data Analysis by Resampling: Concepts and Applications. 6th ed. Pacific Grove, Calif: Duxbury Press;2000
- 19.Good PI. Resampling Methods: A Practical Guide to Data Analysis. 3rd ed. Boston: Birkhauser;2006
- 20.Hacke W, Donnan G, Fieschi C, et al, and the ATLANTIS Trials Investigators, ECASS Trials Investigators, and the NINDS rt-PA Study Group Investigators. Association of outcome with early stroke treatment: pooled analysis of ATLANTIS, ECASS, and NINDS rt-PA Stroke trials. Lancet 2004;363:768–74 [DOI] [PubMed] [Google Scholar]
- 21.McKinney A, Truwit CL, Kieffer S. Reversibility of an “apparent” infarct on dynamic perfusion CT after lytic therapy: comment regarding cerebral blood flow and blood volume thresholds. AJNR Am J Neuroradiol 2006;27:1391–92 [PMC free article] [PubMed] [Google Scholar]
- 22.Wintermark M, Flanders AE, Velthuis B, et al. Perfusion-CT assessment of infarct core and penumbra: receiver operating characteristic curve analysis in 130 patients suspected of acute hemispheric stroke. Stroke 2006;37:979–85 [DOI] [PubMed] [Google Scholar]
Associated Data
This section collects any data citations, data availability statements, or supplementary materials included in this article.