Abstract
SUMMARY: We report 3 patients with myoclonic epilepsy with ragged-red fibers (MERRF) diagnosed by mitochondrial A8344G mutation. Cerebellar ataxia was the first symptom in all patients. Conventional brain MR imaging showed atrophy of the superior cerebellar peduncles and the cerebellum in all patients and brain stem atrophy in 2 patients. In diffusion tensor analysis, fractional anisotropy of the superior cerebellar peduncles was mildly decreased in 1 patient. There was a discrepancy between clinical disabilities (severe) and radiologic abnormalities (mild). This discrepancy and atrophy of the superior cerebellar peduncles and the cerebellum may be important findings suggesting a diagnosis of MERRF.
Myoclonic epilepsy with ragged-red fibers (MERRF) is a rare mitochondrial disorder featuring myoclonus, seizures, mental deterioration, cerebellar ataxia, hearing loss, muscular weakness, and other clinical symptoms. The A8344G or A3243G mutations of mitochondrial deoxyribonucleic acid (DNA) are the genetic causative factors.1-3 The clinical phenotype and prognosis are better for patients with the A8344G mutation than for those with the A3243G mutation.3 Mitochondrial DNA mutation is heteroplasmic, and normal DNA and mutant DNA coexist within the same individual.4 Therefore, the onset age and clinical features of MERRF vary,5 though the onset age is usually adolescence or early adulthood.6
Neuroradiologic findings in patients with MERRF are rarely reported. Previous reports have described 1 or more brain MR imaging abnormalities, including cerebral atrophy, cerebral white matter T2 hyperintensities, striatal T2 hyperintensities, pallidal atrophy with calcification, and cerebellar atrophy.2,3,6,7 Neuropathologic changes include degeneration of the basal ganglia (globus pallidus and substantia nigra), brain stem (pontine tegmentum, locus ceruleus, inferior olivary nucleus, and gracile and cuneate nuclei), cerebellum (dentate nucleus and cerebellar cortex), and spinal cord (posterior columns and spinocerebellar tracts).8,9 The brain stem and cerebellar degeneration might be the main feature of MERRF, but clinical and MR imaging findings focusing on brain stem and cerebellar abnormalities have not been reported. In the present study, our intent was to clarify the clinical and MR imaging features of patients with MERRF, with particular attention to the brain stem and cerebellum, by using conventional and diffusion tensor MR imaging methods.
Case Reports
Patient 1
A 24-year-old man, who was diagnosed with MERRF with the point mutation of mitochondrial DNA A8344G, initially developed cerebellar symptoms at age 8. He also developed muscular weakness, mental deterioration, myoclonus, and ophthalmoparesis. His brain MR imaging at age 11 revealed slight enlargement of the cerebellar fissures and the fourth ventricle without obvious parenchymal signal-intensity abnormalities. His symptoms gradually worsened, and at ages 22 and 24, he underwent 1.5T brain MR imaging including diffusion tensor imaging.
Diffusion tensor imaging was performed by using the following parameters: echo-planar imaging, 6 motion probe gradients, b factor = 1000 s/mm2, TR = 13,000 ms, TE = 96.4 ms, FOV = 260 × 208 mm, matrix = 128 × 128, section thickness = 5 mm, section gap = 0 mm, acquisition time = 160 seconds. Tensor analysis was performed according to a previously described method10 by using dTV II, a software developed in the Department of Radiology, Tokyo University (available at http://www.ut-radiology.umin.jp/people/masutani/dTV.htm). Spheric regions of interest were manually set on each of the superior cerebellar and middle cerebellar peduncles. Fibers running through the superior and middle cerebellar peduncles were tracked, and regions of interest were also set on the entire tracked fibers as “tracts of interest.” Subsequently, mean fractional anisotropy (FA) of tracts of interest was measured according to previously described procedures.11
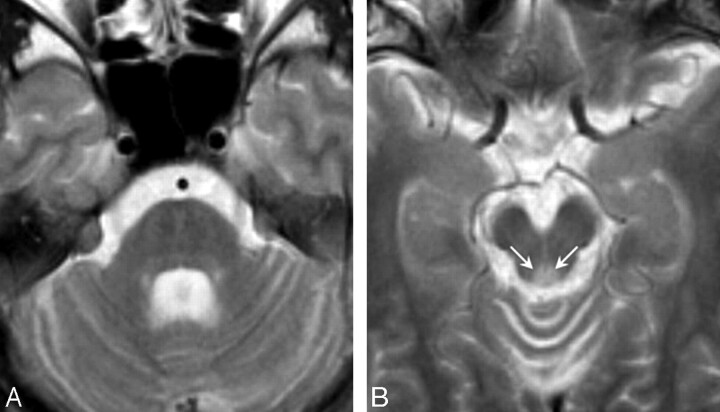
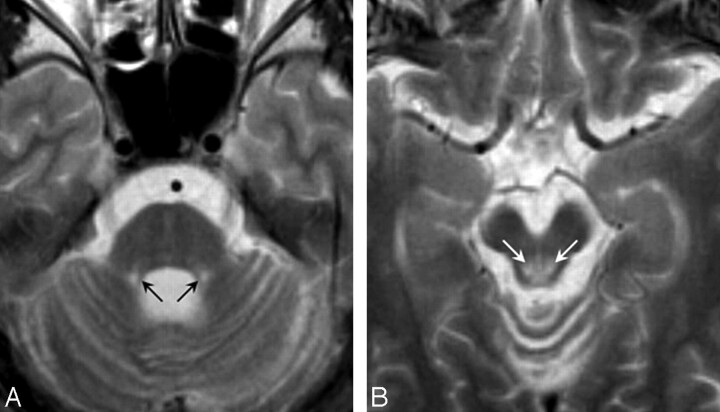
On T2-weighted axial images at age 22 (Fig 1), the mid pons and midbrain were slightly atrophic and the middle and superior cerebellar peduncles showed mild atrophy. The periaqueductal gray matter signal intensity was abnormally hyperintense. The cerebral cortices and basal ganglia appeared normal. On T2-weighted axial images at age 24 (Fig 2), the previously mentioned neuroradiologic abnormalities had deteriorated. There was atrophy of the mid pons, middle cerebellar peduncles, and cerebellar hemisphere and severe atrophy of the superior cerebellar peduncles. The fourth ventricle became slightly larger than that in previous images. Marked abnormal hyperintensities were found bilaterally around the periaqueductal gray matter, and the midbrain tegmentum showed atrophy. In diffusion tensor analysis, the FA value of the superior cerebellar peduncles was slightly decreased (0.469, z score = −0.7) and that of the middle cerebellar peduncles was mildly decreased (0.473, z score = −1.3) in comparison with FA values in 10 healthy subjects (5 men and 5 women, 52.0 ± 8.2 years of age ([range, 37–59 years]; FA of the superior cerebellar peduncles, 0.513 ± 0.066; FA of middle cerebellar peduncles, 0.503 ± 0.023; Table).
Fig 1.
T2-weighted axial images in patient 1 at 22 years of age (disease duration, 14 years). A, The mid pons and midbrain are slightly atrophic, and the middle and superior cerebellar peduncles show mild atrophy. B, The periaqueductal gray matter signal intensity is abnormally hyperintense (arrows).
Fig 2.
T2-weighted axial images in patient 1 at 24 years of age (disease duration, 16 years). A, There is atrophy of the mid pons, middle cerebellar peduncles, and cerebellar hemisphere and severe atrophy of the superior cerebellar peduncles. B, Marked abnormal hyperintensities are found bilaterally around the periaqueductal gray matter (arrows), and the midbrain tegmentum shows atrophy.
Atrophy, abnormal signals, and FA of patients with MERRF and healthy controls
| Atrophy |
Abnormal Signals |
FA (z score) |
|||||||
|---|---|---|---|---|---|---|---|---|---|
| SCP | MCP | Cerebellum | Brain Stem | Cerebrum | Brain Stem | Basal Ganglia | SCP | MCP | |
| Patient | |||||||||
| 1 | ++ | + | + | + | – | + | – | 0.469 (−0.7) | 0.473 (−1.3) |
| 2 | + | ± | + | + | + | + | + | 0.550 (0.6) | 0.465 (−1.7) |
| 3 | + | – | + | – | + | – | – | 0.513 (0.0) | 0.494 (−0.4) |
| Healthy controls | – | – | – | – | – | – | – | 0.513 ± 0.066 | 0.503 ± 0.023 |
Note:—SCP indicates superior cerebellar peduncles; MCP, middle cerebellar peduncles; ++, severely present; +, mildly present; −, absent; ±, equivocal.
Patient 2
A 52-year-old woman initially developed cerebellar ataxia and hearing loss at age 35. She also developed muscular weakness, mental deterioration, cataract, and pigmented retinopathy. Her symptoms gradually worsened, and at age 48, mitochondrial gene analysis confirmed the diagnosis of MERRF with the A8344G mutation. At age 52, she underwent brain MR imaging including diffusion tensor imaging by using the previously mentioned parameters for patient 1.
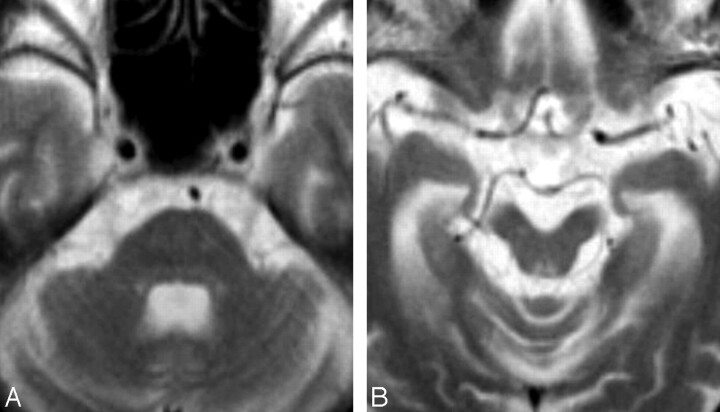
T2-weighted axial images (Fig 3) showed moderate atrophy of the midbrain and mild atrophy of the pons, middle cerebellar peduncles, cerebellum, and cerebrum. The superior cerebellar peduncles were also atrophic. There were symmetric T2 hyperintensities in the midbrain tegmentum around periaqueductal gray matter and T2 hypointensities in the globus pallidus. In diffusion tensor analysis, the FA value of the superior cerebellar peduncles was not decreased (0.550, z score = 0.6) and that of the middle cerebellar peduncles was mildly decreased (0.465, z score = −1.7) in comparison with mean FA values in 10 healthy subjects (Table).
Fig 3.
T2-weighted axial images in patient 2 at 52 years of age (disease duration, 17 years). A, There is moderate atrophy of the midbrain and mild atrophy of the pons, middle cerebellar peduncles, cerebellum, and cerebrum. The superior cerebellar peduncles are also atrophic. B, There are symmetric T2 hyperintensities in the midbrain tegmentum around the periaqueductal gray matter.
Patient 3
A 53-year-old man initially developed cerebellar ataxia, mental deterioration, and recurrent seizures at 12 years of age. He also developed myoclonus and recurrent loss of consciousness in his early 40s. He was diagnosed with MERRF because his older sister had been previously diagnosed with MERRF with mitochondrial A8344G. At age 50, he had sudden-onset right hemianopia, aphasia, alexia with agraphia, acalculia, and finger agnosia. Brain CT revealed massive edematous lesions in the left temporal, parietal, and occipital lobes. At age 53, he underwent brain MR imaging including diffusion tensor imaging by using the previously mentioned parameters for patient 1.
On T2-weighted axial images, there was mild atrophy of the cerebellum and superior cerebellar peduncles but no obvious atrophy of brain stem and middle cerebellar peduncles. Signals in the brain stem and basal ganglia were normal. There was marked enlargement of the inferior and posterior horns of the left lateral ventricle, suggesting left temporo-occipital encephalomalacia. In diffusion tensor analysis, FA values of the superior and middle cerebellar peduncles were not decreased (0.513 and 0.503, respectively) in comparison with mean FA values in 10 healthy subjects (Table).
Discussion
Clinical and brain MR imaging features of patients with MERRF with the mitochondrial A8344G mutation were diverse in the present study, but all patients had slow progressive cerebellar symptoms as an initial manifestation and had atrophy of the superior cerebellar peduncles and cerebellum. All patients were profoundly disabled in daily living activities but did not have prominent brain atrophy. Although cerebellar, brain stem, and cerebral atrophy were present, the degree of atrophy was mild and could be observed on MR imaging only after careful assessment. Atrophy of the superior cerebellar peduncles was more visible than atrophy of the middle cerebellar peduncles. Abnormal signals were recognized symmetrically in the midbrain tegmentum.
In previous studies, cerebral atrophy, cerebral white matter T2 hyperintensities, striatal T2 hyperintensities, pallidal atrophy with calcification, and cerebellar atrophy were reported in patients with MERRF.2,3,6,7 Atrophy of the brain stem and superior cerebellar peduncles and signal intensity abnormalities of the brain stem were not described. The present study describes these abnormalities in patients with MERRF, and the results are supported by previous neuropathologic studies that showed degeneration of the brain stem and dentate nuclei as well as the basal ganglia, cerebellar cortices, and spinal cord.8,9
In diffusion tensor analysis, FA of the superior cerebellar peduncles was mildly decreased in a patient with obvious atrophy of the superior cerebellar peduncles, and there were no significant abnormalities of FA of the middle cerebellar peduncles. Diffusion changes of the cerebellar peduncles were not prominent, despite marked cerebellar dysfunction. These results are different from those of a previous study showing sensitive diffusion changes of the middle cerebellar peduncles in patients with multiple system atrophy.12 Mitochondrial dysfunction with few structural changes might cause a discrepancy between the clinical symptoms and the radiologic changes. A previous proton MR spectroscopic study showed that in patients with MERRF, the N-acetylaspartate/creatine ratio was decreased in the cerebellum,13 whereas another study showed preserved brain perfusion in patients with MERRF.14 A decreased N-acetylaspartate/creatine ratio suggests neuronal loss or neuronal dysfunction, whereas hypoperfusion suggests neuronal loss or vascular problems. A decreased N-acetylaspartate/creatine ratio without hypoperfusion suggests neuronal dysfunction with relatively maintained neuronal architecture. This hypothesis is compatible with our findings of severe clinical symptoms with mild radiologic abnormalities. However, this interpretation is speculative because it is based on results from 2 other studies using 2 different techniques in 2 different small groups of patients, and further studies are necessary to confirm our hypothesis.
The present study has some limitations regarding the diffusion tensor sequences. Only 6 directions of diffusion gradients and 1 measurement for each direction were used, and the spatial resolution was not as good as that in several other studies. These parameters may have reduced the accuracy of FA measurements. However, a recent study confirmed that the number of motion probe gradients does not influence FA or apparent diffusion coefficient (ADC) values,15 and another study showed that voxel size is not related to FA or ADC values in areas containing noncrossing fibers such as the corpus callosum and the posterior limb of the internal capsule.16 In the present study, we performed diffusion tensor analyses by using “tracts of interests,” which probably resolve the problems regarding inaccurate FA data in areas containing crossing fibers, though we should consider the possibility of negative influences due to tracking errors.
Conclusion
Clinical and neuroradiologic features of patients with MERRF with a mitochondrial A8344G mutation are diverse but can resemble spinocerebellar degeneration, especially in the early stage of the disease. Neuroradiologically, mild atrophy of the superior cerebellar peduncles and the cerebellum, in addition to abnormalities of the cerebrum and basal ganglia, suggests MERRF, especially in patients with a disparity between mild radiologic abnormalities and severe clinical disabilities.
References
- 1.Silvestri G, Ciafaloni E, Santorelli FM, et al. Clinical features associated with the A to G transition at nucleotide 8344 of mtDNA (“MERRF mutation”). Neurology 1993;43:1200–06 [DOI] [PubMed] [Google Scholar]
- 2.Fabrizi GM, Cardaioli E, Grieco GS, et al. The A to G transition at nt 3243 of the mitochondrial tRNALeu (UUR) may cause an MERRF syndrome. J Neurol Neurosurg Psychiatry 1996;61:47–51 [DOI] [PMC free article] [PubMed] [Google Scholar]
- 3.Huang CC, Kuo HC, Chu CC, et al. Clinical phenotype, prognosis and mitochondrial DNA mutation load in mitochondrial encephalomyopathies. J Biomed Sci 2002;9:527–33 [DOI] [PubMed] [Google Scholar]
- 4.Lombes A, Diaz C, Romero NB, et al. Analysis of the tissue distribution and inheritance of heteroplasmic mitochondrial DNA point mutation by denaturing gradient gel electrophoresis in MERRF syndrome. Neuromuscul Disord 1992;2:323–30 [DOI] [PubMed] [Google Scholar]
- 5.Fukuhara N. Clinicopathological features of MERRF. Muscle Nerve 1995;3:90–94 [DOI] [PubMed] [Google Scholar]
- 6.Mehndiratta MM, Agarwal P, Tatke M, et al. Neurological mitochondrial cytopathies. Neurol India 2002;50:162–67 [PubMed] [Google Scholar]
- 7.Barkovich AJ, Good WV, Koch TK, et al. Mitochondrial disorders: analysis of their clinical and imaging characteristics. AJNR Am J Neuroradiol 1993;14:1119–37 [PMC free article] [PubMed] [Google Scholar]
- 8.Takeda S, Wakabayashi K, Ohama E, et al. Neuropathology of myoclonus epilepsy associated with ragged-red fibers (Fukuhara's disease). Acta Neuropathol (Berl) 1988;75:433–40 [DOI] [PubMed] [Google Scholar]
- 9.Fukuhara N. MERRF: a clinicopathological study—relationships between myoclonus epilepsies and mitochondrial myopathies. Rev Neurol (Paris) 1991;147:476–79 [PubMed] [Google Scholar]
- 10.Aoki S, Iwata NK, Masutani Y, et al. Quantitative evaluation of the pyramidal tract segmented by diffusion tensor tractography: feasibility study in patients with amyotrophic lateral sclerosis. Radiat Med 2005;23:195–99 [PubMed] [Google Scholar]
- 11.Taoka T, Iwasaki S, Sakamoto M, et al. Diffusion anisotropy and diffusivity of white matter tracts within the temporal stem in Alzheimer disease: evaluation of the “tract of interest” by diffusion tensor tractography. AJNR Am J Neuroradiol 2006;27:1040–45 [PMC free article] [PubMed] [Google Scholar]
- 12.Nicoletti G, Lodi R, Condino F, et al. Apparent diffusion coefficient measurements of the middle cerebellar peduncle differentiate the Parkinson variant of MSA from Parkinson's disease and progressive supranuclear palsy. Brain 2006;129 (Pt 10):2679–87. Epub 2006 Jun 30 [DOI] [PubMed] [Google Scholar]
- 13.Mathews PM, Andermann F, Silver K, et al. Proton MR spectroscopic characterization of differences in regional brain metabolic abnormalities in mitochondrial encephalomyopathies. Neurology 1993;43:2484–90 [DOI] [PubMed] [Google Scholar]
- 14.Watanabe Y, Hashikawa K, Moriwaki H, et al. SPECT findings in mitochondrial encephalomyopathy. J Nucl Med 1998;39:961. [PubMed] [Google Scholar]
- 15.Ni H, Kavcic V, Zhu T, et al. Effects of number of diffusion gradient directions on derived diffusion tensor imaging indices in human brain. AJNR Am J Neuroradiol 2006;27:1776–81 [PMC free article] [PubMed] [Google Scholar]
- 16.Oouchi H, Yamada K, Sakai K, et al. Diffusion anisotropy measurement of brain white matter is affected by voxel size: underestimation occurs in areas crossing fibers. AJNR Am J Neuroradiol 2007;28:1102–06 [DOI] [PMC free article] [PubMed] [Google Scholar]


