Abstract
BACKGROUND AND PURPOSE: There are limited indicators available to predict cerebral vasospasm in patients with subarachnoid hemorrhage (SAH). The purpose of this study was to determine if CT perfusion–derived hemodynamic parameters are predictors of vasospasm severity and outcome after experimental SAH.
MATERIALS AND METHODS: SAH was induced in 25 New Zealand white rabbits. Cerebral blood flow (CBF), cerebral blood volume (CBV), and mean transit time (MTT) were measured with CT perfusion before SAH, within 1 hour after SAH, and on days 2, 4, 7, 9, and 16 after SAH. Basilar artery diameter, measured with CT angiography and neurologic scoring, was also obtained on the same days. Differences between animals with moderate-severe delayed vasospasm (≥24% basilar artery narrowing) and mild delayed vasospasm (<24% basilar artery narrowing) were investigated with repeated measures analysis of variance. Multiple linear regression analysis was used to investigate the relationship between CT perfusion parameters (CBF, CBV, MTT), basilar artery diameter, and neurologic score.
RESULTS: MTT increase <1 hour after SAH independently predicted mortality within 48 hours of SAH (P < .05). MTT and neurologic deficits were significantly greater with moderate-severe than with mild vasospasm (P < .05). MTT on day 2, but not CBF or CBV, was a significant predictor of subsequent moderate-severe delayed vasospasm (P < .05).
CONCLUSION: In the rabbit model of experimental SAH, the CT-derived hemodynamic parameter MTT on day 0 predicted early mortality, and MTT on day 2 predicted development of moderate-severe delayed vasospasm. MTT was also significantly correlated with arterial diameter and neurologic score.
Delayed ischemia is the most significant risk factor contributing to death and disability in patients who initially survive subarachnoid hemorrhage (SAH).1 Repeat hemorrhage can also lead to poor outcomes after SAH; however, early aneurysm repair by surgical clipping or endovascular coiling has significantly reduced the incidence of rebleeding in patients with aneurysm.2,3 Unfortunately, even for patients who undergo early aneurysm repair, the risk of morbidity and mortality due to vasospasm-related ischemia remains high.3–5
Effective therapeutic intervention for vasospasm depends on timely identification.6 Commonly used methods of screening patients suspected of having vasospasm include transcranial Doppler and CT angiography (CTA). Both of these methods can be used successfully for diagnosing patients with vasospasm; however, both may be limited for technical reasons. Narrowing in small distal vessels cannot be detected with transcranial Doppler due to its limited spatial resolution and low sensitivity, so examinations of the microcirculation are limited.7 In addition, a proper acoustic window for insonating patients is lacking in approximately 20% of patients.8 CTA can be limited for evaluation of vessels near to a treated aneurysm because of streak artifacts from the surgical clip or coil pack.9
Recently, there has been interest in using CT perfusion imaging for assessment of patients with vasospasm.10 A number of different hemodynamic parameters are available using CT perfusion imaging. One such parameter, mean transit time (MTT), is a measure of the mean time for blood to perfuse a region of tissue. MTT is related to cerebral blood flow (CBF) and cerebral blood volume (CBV) by the central volume principle: MTT = CBV / CBF.11 Thus, MTT is highly sensitive to hemodynamic disturbances involving changes in both CBV and CBF.
CT perfusion imaging is a rapid and relatively inexpensive imaging technique that has the ability to identify hemodynamic disturbances associated with vasospasm.6,12,13 In a recent clinical investigation, MTT was identified as the most sensitive perfusion parameter for the detection of SAH-related vasospasm.10 These results, however, rely on a single measurement made between 6 and 9 days after SAH. To our knowledge, the temporal relationship between MTT and vasospasm has yet to be studied throughout the course of delayed vasospasm after SAH. This lack of information is, in part, due to the difficulty of performing serial CT perfusion measurements in a patient population in the weeks following SAH, when delayed vasospasm is likely to occur.
The diagnostic potential of CT perfusion imaging in patients with vasospasm has been demonstrated and is thus a realistic clinical goal; however, less is known about its ability to predict vasospasm onset or patient outcomes. The possibility of predicting an individual patient's risk for bad outcome or symptomatic vasospasm is an attractive clinical goal. The ability to predict outcomes such as death, neurologic injury, or onset of symptomatic vasospasm after SAH could lead to early interventions resulting in improved patient care and patient outcomes.
The purpose of our study was to determine the temporal relationship between hemodynamic parameters, arterial diameter, and neurologic score in a rabbit model of SAH-induced vasospasm. We investigated CT perfusion–derived measurements of MTT, CBF, and CBV as predictors and correlates of delayed vasospasm severity and outcome after experimental SAH. We hypothesized that increased MTT and decreased CBF are predictors for delayed arterial narrowing and neurologic deficits subsequent to SAH.
Materials and Methods
Induction of Subarachnoid Hemorrhage
Ethics approval was obtained from the local animal use subcommittee of the Canadian Council of Animal Care; all procedures followed their guidelines. Male New Zealand white rabbits (2.5–3.5 kg) were randomized to either SAH (n = 25) or a sham procedure (n = 8). They were anesthetized with 3%–5% isoflurane. Intravenous ketamine (3 mg/kg) and diazepam (valium) (0.3 mg/kg) were given to maintain anesthesia during intubation. Throughout the remainder of the procedure, animals were mechanically ventilated (2% isoflurane), and vecuronium bromide (0.15 mg/kg) was used when required to suppress spontaneous respiration. End-tidal partial pressure of carbon dioxide (pCO2), mean arterial pressure (MAP), arterial pCO2, arterial partial pressure of oxygen, arterial blood pH, and temperature were maintained within normal ranges.
Animals were placed in a positioning device in the prone position with their head secured at a downward angle of 30° to facilitate the formation of a blood clot around the basilar artery. We withdrew 1.5 mL of CSF, and 1.5 mL/kg of blood from the central ear artery was injected back into the cisterna magna (3–5 minutes).
For the sham procedure, 1.5 mL/kg of artificial CSF was injected into the cistern magna rather than autologous blood. The composition of the artificial CSF was as follows: 125.5-mmol/L sodium chloride, 3.1-mmol/L potassium chloride, 1.2-mmol/L calcium chloride, 1.0-mmol/L magnesium chloride, 24.5-mmol/L bicarbonate of soda, and 0.5-mmol/L sodium dihydrogen phosphate.
CT Imaging
All imaging was performed on a LightSpeed Plus (GE Healthcare, Milwaukee, Wis) 4-section CT scanner. A nonenhanced scout image and axial images were used to verify head position and section locations before CTA and CT perfusion scanning. A nonionic iodinated contrast agent (300 mg/mL, iohexol; Omnipaque, Nycomed, Princeton, NJ) was used for both CTA and CT perfusion imaging.
On day 0, baseline CT perfusion and CTA scanning were completed before SAH induction. After SAH, CTA was performed at 10, 30, and 60 minutes; 1 CT perfusion scan was obtained 45 minutes after SAH induction. CT perfusion and CTA scans were obtained on days 2, 4, 7, 9, and 16 after SAH.
CT Angiography
Two consecutive helical scans were obtained. The first section was inferior to the vertebrobasilar junction, and the last section was superior to the terminal bifurcation of the basilar artery into the posterior cerebral arteries. After 1 set of nonenhanced images was collected, contrast was injected (5 mL at 0.5 mL/s), and a set of enhanced images was acquired at the same section locations. Image acquisition parameters were the following: 120 kVp and 60 mA; 512 × 512 image matrix; 120-mm FOV; and 1.5 pitch. The section thickness was 2.5 mm, with a 2-mm overlap between successive sections.
CT Perfusion
A block of tissue, 20 mm thick, that consisted of four 5-mm sections was selected. Contrast was injected into the saphenous vein at the beginning of the scanning (1.5 mL/kg at 1 mL/s). Ninety-nine images were collected at each of the 4 section locations while the couch remained stationary. Scanning took 25.5 seconds to complete. The images were acquired at 0.5-second intervals and 120 kVp and 60 mA, 512 × 512 image matrix, 120-mm FOV, and 1 second per rotation.
Neurologic Assessments
One individual, blinded to the study design, completed all neurologic assessments. The first assessment (day 0) was performed 6–24 hours after anesthesia. Additional neurologic testing was completed on each follow-up day of scanning. Posture, gait, and righting reflexes were each given a score: 0, normal; 1, mild; 2, moderate; and 3, severely impaired. Front and back reflexes were also scored: 0, normal; 1, brisk; 2, spreading; and 3, clonus. The sum of the individual observations provided the overall neurologic score.14
Histology
To confirm the presence and location of neuronal damage after SAH, we performed perfusion-fixation of the brain at 24 hours and 16 days after SAH or following the sham procedure in 3 individual rabbits. Briefly, 300-mL buffer solution (pH 7.4) was perfused through the left ventricle followed by 300 mL of 4% paraformaldehyde (pH 7.4). Brains were removed and stored in 10% formalin. Using a rabbit brain matrix, we cut 4 × 2 mm sections corresponding to the middle of each CT image location. Sections were paraffin-processed and microtome-sectioned into 5-μm-thick sections before being stained with hematoxylin-eosin (H&E).
Analysis of Basilar Artery Diameter
Nonenhanced images were subtracted from enhanced images to create a set of digitally subtracted CTA images. Five cross-sections were chosen from each of the proximal, middle, and distal segments of the basilar artery. Using software developed in our lab (IDL v5.6; Research Systems, Boulder, Colo), we obtained a vertical (anteroposterior) and horizontal (right-left) profile (CT number versus pixel location) from each section in each segment. Full width at half maximum measurements of the horizontal and vertical profiles from the 5 sections at each segment were averaged to obtain a single measurement of basilar artery diameter for each of the proximal, middle, and distal arterial segments.
We defined the maximum severity of acute vasospasm (VSPacute) as the greatest degree of narrowing within 30 minutes of SAH. The maximum severity of delayed vasospasm (VSPdelayed) was defined as the greatest degree of narrowing measured in the basilar artery within 7 days of SAH.15 Delayed and acute vasospasm severity were calculated as:
 |
where BAbase = baseline diameter of the basilar artery and BAmeasured = the diameter of the basilar artery measured at a specific time. Acute and delayed vasospasm severities were considered separately. For consistency, the segment (proximal, middle, or distal) with the most severe delayed vasospasm provided the measurements at all other time points within each animal.
Analysis of CBF, CBV, and MTT
CBF and CBV functional maps were calculated by using CT Perfusion 3 software (GE Healthcare). Arterial concentration curves were obtained from a 2 × 2 pixel region of interest (ROI) in the internal carotid artery in the section that showed the earliest arrival of contrast. To correct for partial volume averaging, we placed a 2 × 2 pixel ROI in either the superior saggital sinus or the internal carotid artery on the section that showed the greatest area under the curve. Using software developed in our laboratory (IDL v5.6; Research Systems), ROIs were hand-drawn around brain regions (brain stem, cerebellum, deep gray matter, parieto-occipital cerebrum) on CBV and CBF maps. Thresholds were applied to limit the effects of large blood vessels on the tissue measurements (CBV > 8.0 mL/100 g; CBF > 250 mL/100 g per minute).16 MTTs were determined from the following calculation:
 |
where CBV = cerebral blood volume (mL/100 g) and CBF = cerebral blood flow (mL/100 g per minute).
Statistical Analysis
SPSS Version 12.0 (SPSS, Chicago, Ill) was used for analysis. To assess mortality, we entered CBF, CBV, and MTT measured 45 minutes after SAH and VSPacute into a logistic regression model. Multiple linear regression analysis was used to identify which CT perfusion parameters (CBF, CBV, or MTT) were significantly correlated to basilar artery diameter.
Animals were divided into 2 groups on the basis of the maximum severity of delayed vasospasm: mild vasospasm (<24% basilar artery narrowing) or moderate-severe vasospasm (≥24% basilar artery narrowing). This designation was based on previous work that classified the severity of angiographic vasospasm within the basilar artery.13,17 Significant predictors (CBF, CBV, or MTT) of moderate-severe vasospasm were identified with logistic regression analysis. Within- and between-group differences were analyzed with (Bonferroni-corrected) repeated-measures analysis of variance.15 Significant differences were declared at the level of P < .05.
Results
Mortality
Ten out of 25 animals (40%) died within 48 hours of SAH. There was no mortality in the sham group. When VSPacute, CBF, CBV, and MTT measured 45 minutes after SAH were entered into the logistic regression model, MTT was identified as the only significant predictor of mortality (P < .05).
Neurologic Assessments
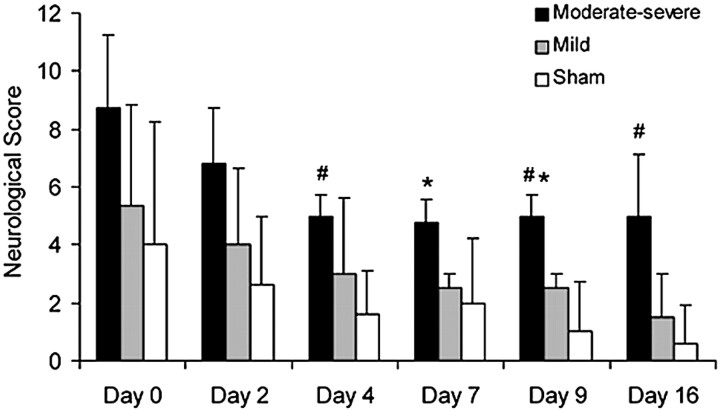
Neurologic scores were significantly different between the moderate-severe VSPdelayed, mild VSPdelayed, and sham groups (P < .05; Fig 1). Deficits were greater in animals with moderate-severe VSPdelayed compared with animals with mild VSPdelayed on days 7 and 9 after SAH (P < .01). Compared with the sham group, deficits in the mild VSPdelayed group were greater, but this difference was not significant (P > .05); deficits in animals with moderate-severe VSPdelayed were significantly greater than those in sham animals on days 4, 9, and 16 (P < .01).
Fig 1.
Graph of neurologic scores (mean ± SD) for the moderate-severe VSPdelayed group, mild VSPdelayed group, and sham group. Animals with moderate-severe VSPdelayed had greater neurologic deficit than animals with mild VSPdelayed (asterisk, P < .01) and sham animals (number sign, P < .01).
Histology
Eosinophilic neurons and an acute inflammatory infiltrate indicated areas of damage on H&E staining at 24 hours in the medulla region of the brain stem. Astrocytes and scattered macrophages were evident at 16 days after SAH (Fig 2). There was no evidence of damage at 24 hours or 16 days following the sham procedure.
Fig 2.
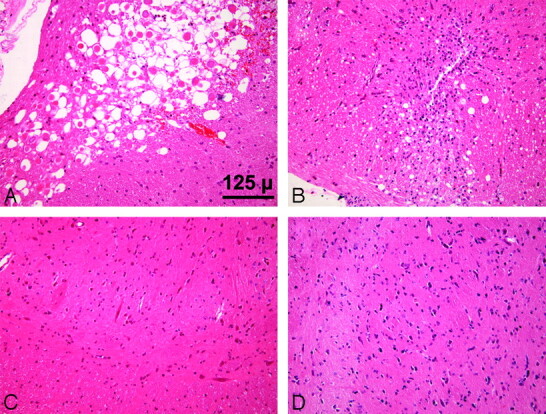
Brain stem sections. After SAH, eosinophilic neurons are evident at 24 hours (A), and by 16 days, there are astrocytes and scattered macrophages (B). There is no damage at 24 hours (C) or 16 days (D) after the sham procedure (H&E, ×20).
CT Angiography
Eight of the 15 animals that survived the SAH procedure had moderate-severe VSPdelayed, whereas 7 animals demonstrated mild VSPdelayed (Table). VSPdelayed in the moderate-severe group (37.5 ± 13.1%) was significantly greater than VSPdelayed in the mild group (16.1 ± 1.5%) (P < .05).
Acute and delayed vasospasm results
| Vasospasm Group | Day of VSPdelayed | Severity of VSPdelayed* | Severity of VSPacute* |
|---|---|---|---|
| Moderate-severe | 2 | 27 | 58 |
| Moderate-severe | 4 | 24 | 40 |
| Moderate-severe | 2 | 41 | 29 |
| Moderate-severe | 4 | 59 | 55 |
| Moderate-severe | 4 | 30 | 0 |
| Moderate-severe | 4 | 49 | 0 |
| Moderate-severe | 4 | 46 | 28 |
| Moderate-severe | 4 | 24 | 35 |
| Average (moderate-severe) | 3.5 ± 0.9 | 37.5 ± 13.1% | 30.6 ± 21.8% |
| Mild | 2 | 17 | 0 |
| Mild | 7 | 15 | 30 |
| Mild | 2 | 16 | 0 |
| Mild | 4 | 16 | 0 |
| Mild | 2 | 17 | 22 |
| Mild | 4 | 13 | 50 |
| Mild | 4 | 19 | 35 |
| Average (Mild) | 3.6 ± 2.0 | 16.1 ± 1.5% | 19.6 ± 20.1% |
Percentage decrease of basilar artery diameter from baseline.
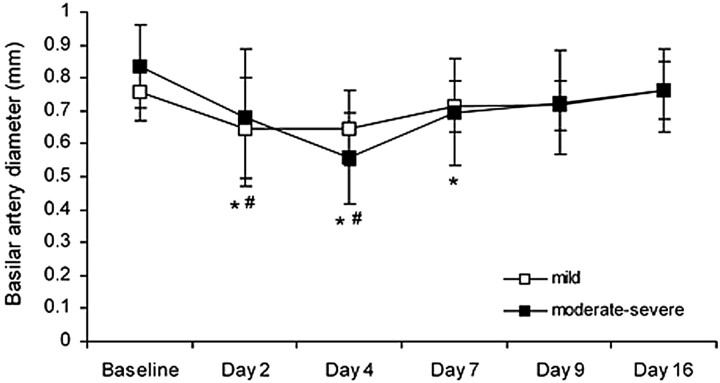
The time course of delayed basilar artery narrowing was similar in the mild vasospasm group and the moderate-severe vasospasm group (P > .05; Fig 3). In all animals with SAH, there was also a significant decrease in basilar artery diameter both at 10 minutes and at 30 minutes after SAH (P < .01, data not shown). In the sham group, basilar artery diameter did not change significantly from baseline either acutely or on any postprocedural day (P > .01).
Fig 3.
Basilar artery diameter (mean ± SD) before SAH (baseline) and after SAH for animals with mild and moderate-severe VSPdelayed. In the mild VSPdelayed group, arterial diameter was significantly less than baseline on days 2 and 4 (number sign, P < .01 compared with baseline). In the moderate-severe VSPdelayed group, arterial diameter was significantly less than baseline 2, 4, and 7 days after SAH (asterisk, P < .01 compared with baseline).
CT Perfusion
Baseline CBF, CBV, or MTT was not significantly different between the sham, mild, and moderate-severe VSPdelayed groups (P > .05). In all regions, there was a significant decrease in CBF and increase in MTT 45 minutes after SAH (P < .05). CBV decreased slightly in all regions; however, this difference was not significant (P > .05). In the sham group, CBF, CBV, and MTT 45 minutes after the sham procedure were not significantly different from baseline measurements (P > .05).
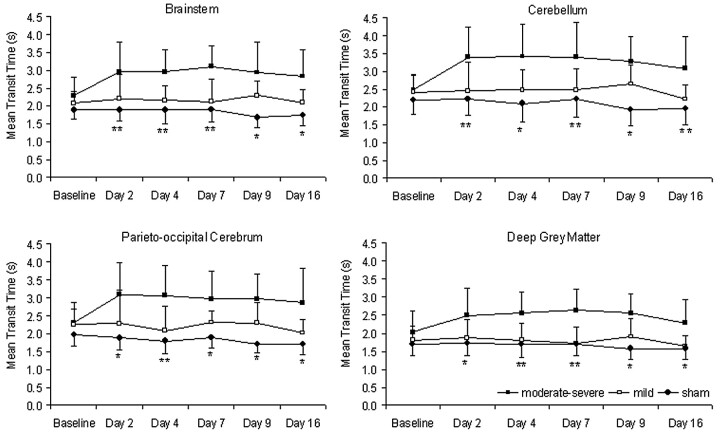
Between days 2 and 16 after SAH, animals with moderate-severe VSPdelayed had significantly greater MTT than both animals with mild vasospasm and sham animals in all 4 regions (P < .05, Figs 4 and 5). There was no significant difference between MTT in animals with mild VSPdelayed compared with sham animals (P > .05).
Fig 4.
CT perfusion measurements of MTT in the brain stem, cerebellum, parieto-occipital cerebrum, and deep gray matter. In the moderate-severe VSPdelayed group, MTT was significantly greater than both the mild VSPdelayed and sham groups (asterisk, P < .01 compared with sham; double asterisks, P < .01 compared with both mild and sham).
Fig 5.
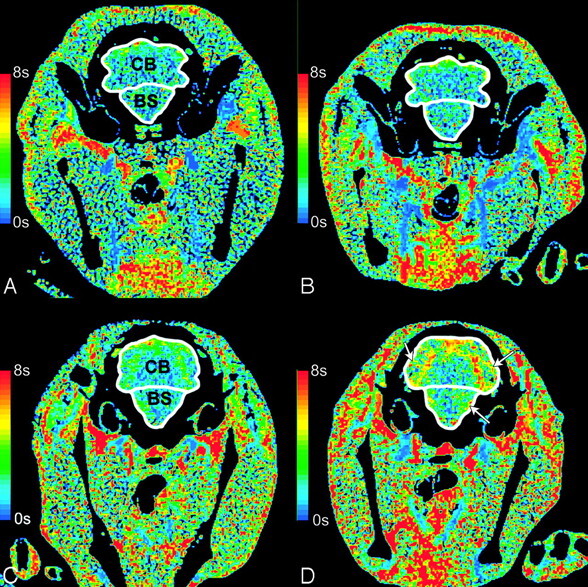
CT perfusion maps of MTT. MTT in an animal with mild delayed vasospasm (<24%) does not change in the brain stem (BS) or the cerebellum (CB) between baseline (A) and day 4 (B). In moderate-severe delayed vasospasm (≥24%), MTT increases from baseline (C) to day 4 (D) in the BS and CB. The white arrows show areas of increased MTT.
CBF was lower in animals with moderate-severe VSPdelayed than in animals with mild VSPdelayed on every day of data collection after SAH; overall, this difference was not significant (P > .05). CBV did not differ between groups throughout the delayed phase of SAH (P > .05).
Correlation of CTA with CT perfusion
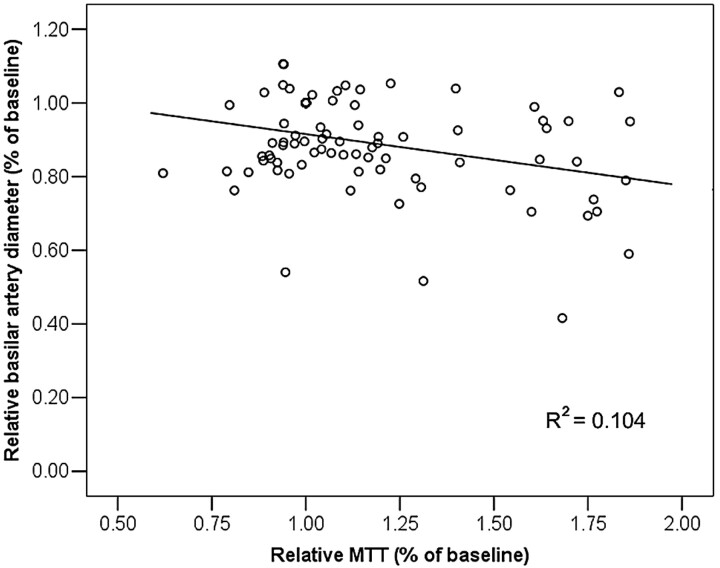
Increased MTT in the brain stem and cerebellum was significantly correlated to reduced basilar artery diameter (P < .05, Fig 6). In the parieto-occipital cerebrum, both reduced CBF and increased MTT were significantly correlated to reduced basilar artery diameter (P < .05).
Fig 6.
Scatterplot of basilar artery diameter (millimeters) versus MTT (seconds) in the brain stem. There is a significant negative correlation between MTT and basilar artery diameter (P < .05).
Prediction of Delayed Vasospasm
Neuronal damage was confined to the brain stem, and in most cases, delayed vasospasm occurred 4 or more days after SAH. Therefore MTT, CBF, and CBV at day 2 in the brain stem were entered into a logistic regression model. MTT was the only significant predictor of delayed moderate-severe vasospasm with a threshold of 2.5 seconds (P < .05). Of the 8 cases with moderate-severe vasospasm, 7 were identified correctly when MTT was >2.5 seconds (sensitivity = 88%); in the 7 cases of mild or no vasospasm, 5 were identified correctly when MTT was <2.5 seconds (specificity = 71%). The accuracy was 80%.
Discussion
The experimental rabbit model used in this study shares several similarities with clinical SAH. First, the time course of vasospasm is close to that of the clinical condition (Table, Fig 3).18 Our data agree with that of Nabavi et al,13 who showed that the time course of CBF changes after SAH is similar in patients with moderate and severe vasospasm. Second, the mortality rate due to the acute effects of SAH in this study was 40%, which is similar to human mortality after SAH in the posterior circulation.19,20 Third, approximately 50% of animals developed moderate-severe delayed vasospasm, which is comparable with the proportion of patients with SAH that develop delayed vasospasm.21 Finally, rabbits in this study exhibited neurologic symptoms that worsened with the severity of vasospasm, similar to the clinical situation in which neurologic scores worsen with greater severity of vasospasm.22
We showed that MTT elevation 1 hour after SAH was a significant predictor of early mortality (within 48 hours). High MTT could reflect raised intracranial pressure (ICP), leading to reduced cerebral perfusion pressure (CPP) and prolonged cerebral circulation (increased MTT).23 After experimental SAH, there are important transient changes in both intracranial pressure and local arterial pressure. Acute increases in ICP have been observed in conjunction with reductions in CPP for up to 1 hour following experimental SAH.24 This increase in ICP and corresponding reduction in CPP would be expected to result in a global increase in MTT. In addition to acute increases in ICP, acute vasospasm has been observed as a transient reduction in arterial diameter, followed by a return to normal arterial diameter within 1 hour after experimental SAH. This acute transient vasospasm is distinct from delayed vasospasm seen several days after SAH.25 The expected effect of acute vasospasm is increased MTT in the territory supplied by the arteries with acute vasospasm. Thus, acute increases in MTT following SAH may reflect increased ICP or reduced local arterial pressure caused by acute vasospasm.
In the context of our study, we hypothesize that a transient increase in ICP following SAH induction, together with acute vasospasm, resulted in a reduction in CPP, which we measured as an acute increase in MTT. Subsequently, increased MTT was identified as a predictor of early mortality after SAH. Although we did not measure ICP in this study, we have previously observed acute increases in ICP up to the level of MAP in the same model of SAH (data not shown). The fact that acute increases in MTT independently predicted early mortality suggests that it is more sensitive to acute injury than CBF, CBV, or arterial narrowing in the very acute stage. Future investigations of the interaction between ICP, acute vasospasm, and perfusion pressure could test the validity of this concept.
MTT was the only CT perfusion parameter that significantly correlated with basilar artery diameter at equivalent time points. These findings are in agreement with clinical studies that have demonstrated the ability of CT perfusion to detect delayed vasospasm after SAH.10,26,27 Wintermark et al10 showed that MTT was the perfusion parameter that best identified angiographic vasospasm when using CT perfusion and CTA to screen patients for delayed vasospasm. In a recent study, regions of increased MTT were used to correctly identify 15/15 patients with severe vasospasm (determined by follow-up angiography), even when changes in CBV and CBF were minimal.26 Increased MTT in the presence of more severe vasospasm may reflect regions of abnormal autoregulation in the presence of angiographic large-vessel vasospasm or in the presence of elevated ICP.12,28,29 Prolonged MTT may also indicate cerebral infarction resulting from delayed vasospasm after SAH.27
Regions of increased MTT are correlated with delayed vasospasm, suggesting that MTT is a potentially useful diagnostic marker of delayed vasospasm. We expanded on these results by investigating the temporal relationship of MTT subsequent to SAH. Our results show that MTT can predict moderate-severe delayed vasospasm with a sensitivity of 88%. Thus, identifying regions of increased MTT before the development of maximum delayed vasospasm may help identify patients at risk of severe vasospasm and related cerebral ischemia. Other parameters commonly used to predict vasospasm include Fisher grade (based on the location and volume of subarachnoid blood seen on the CT scan) and neurologic condition.9 The Fisher grade was initially shown to predict severe delayed vasospasm with a sensitivity of 92%.22 Recently, the utility of this method has been questioned because of its subjective nature and poor ability to predict vasospasm in the presence of current treatments.17,30 In addition, deteriorating neurologic status occurs as a consequence of delayed vasospasm; therefore, it has limited value for predicting the onset of delayed vasospasm.31 The inability of these parameters to predict the occurrence of vasospasm in patients with SAH suggests that other factors may play a role.19,32
Our finding that MTT on day 2 predicted occurrence of moderate-to-severe vasospasm on later days is notable. The precise reasons that MTT predicts severity of delayed vasospasm are not presently clear. In patients with SAH, MTT has been shown to increase after SAH, before the development of delayed vasospasm and ischemic deficits.33 This increase may be related to the presence of inflammatory cytokines, which reach their peak concentration in the CSF before delayed vasospasm and have been linked to reduced CBF and endothelial dysfunction after SAH.34–36 Previous work has suggested that an important component of the pathophysiology present in vasospasm involves small arteries.37 We believe the relationship between MTT and delayed vasospasm likely involves contributions from both large- and small-vessel vasospasm.
Our finding that MTT remained elevated, even after arterial narrowing subsided, was surprising. We hypothesize that this might reflect ischemic damage caused by delayed vasospasm.6 Our finding of astrocytes and macrophages in the brain stem at the time of histologic assessment supports this hypothesis. The prolonged duration of increased MTT may also indicate the involvement of small arteries and increased resistance to cerebral blood flow downstream from the large-artery vasospasm.
Further animal and human studies are needed to validate the ability of CT perfusion imaging to predict onset of vasospasm before the result is applied clinically. Nevertheless, we believe the result is encouraging; early knowledge of the severity of eventual vasospasm might allow time for medical or surgical interventions to improve neurologic outcomes.
There are limitations to our study. First, we did not measure ICP because of difficulties in obtaining serial measurements throughout the duration of the study in our rabbit model. Measurement of ICP might have provided a more complete description of the relationship between MTT, ICP, and vasospasm. In addition, all mortality occurred within the first 48 hours after SAH; thus, it was not possible to correlate later MTT changes as a predictor of death in our study.
Conclusion
CT perfusion–derived measurements of MTT can predict early mortality after experimental SAH. Furthermore, early MTT abnormalities predict the occurrence of delayed moderate-severe vasospasm. These results suggest that CT perfusion measurements of MTT may help identify patients who will develop clinically significant vasospasm.
Acknowledgments
We thank Dominique Ouimet and Jennifer Hadway for their help with animals used in this study and Blake Murphy for completing the neurologic assessments.
Footnotes
This work was supported by the American Society of Neuroradiology Foundation Scholar Award (J.D.E.), the Canadian Stroke Network Studentship Award (A.M.L.), and GE Healthcare.
Paper previously presented in part at: 91st Scientific Assembly and Annual Meeting of the Radiological Society of North America, Chicago, Ill; November 27–December 2, 2005.
References
- 1.Kassell NF, Torner JC, Haley EC Jr, et al. The International Cooperative Study on the Timing of Aneurysm Surgery. Part 1. Overall management results. J Neurosurg 1990;73:18–36 [DOI] [PubMed] [Google Scholar]
- 2.Rabinstein AA, Friedman JA, Nichols DA, et al. Predictors of outcome after endovascular treatment of cerebral vasospasm. AJNR Am J Neuroradiol 2004;25:1778–82 [PMC free article] [PubMed] [Google Scholar]
- 3.Molyneux AJ, Kerr RS, Yu LM, et al. International subarachnoid aneurysm trial (ISAT) of neurosurgical clipping versus endovascular coiling in 2143 patients with ruptured intracranial aneurysms: a randomised comparison of effects on survival, dependency, seizures, rebleeding, subgroups, and aneurysm occlusion. Lancet 2005;366:809–17 [DOI] [PubMed] [Google Scholar]
- 4.Naidech AM, Janjua N, Kreiter KT, et al. Predictors and impact of aneurysm rebleeding after subarachnoid hemorrhage. Arch Neurol 2005;62:410–16 [DOI] [PubMed] [Google Scholar]
- 5.Brilstra EH, Rinkel GJ, Algra A, et al. Rebleeding, secondary ischemia, and timing of operation in patients with subarachnoid hemorrhage. Neurology 2000;55:1656–60 [DOI] [PubMed] [Google Scholar]
- 6.Harrigan MR, Magnano CR, Guterman LR, et al. Computed tomographic perfusion in the management of aneurysmal subarachnoid hemorrhage: new application of an existent technique. Neurosurgery 2005;56:304–17 [DOI] [PubMed] [Google Scholar]
- 7.Sloan MA, Haley EC Jr, Kassell NF, et al. Sensitivity and specificity of transcranial Doppler ultrasonography in the diagnosis of vasospasm following subarachnoid hemorrhage. Neurology 1989;39:1514–18 [DOI] [PubMed] [Google Scholar]
- 8.Seidel G, Kaps M, Gerriets T. Potential and limitations of transcranial color-coded sonography in stroke patients. Stroke 1995;26:2061–66 [DOI] [PubMed] [Google Scholar]
- 9.Reilly C, Amidei C, Tolentino J, et al. Clot volume and clearance rate as independent predictors of vasospasm after aneurysmal subarachnoid hemorrhage. J Neurosurg 2004;101:255–61 [DOI] [PubMed] [Google Scholar]
- 10.Wintermark M, Ko NU, Smith WS, et al. Vasospasm after subarachnoid hemorrhage: utility of perfusion CT and CT angiography on diagnosis and management. AJNR Am J Neuroradiol 2006;27:26–34 [PMC free article] [PubMed] [Google Scholar]
- 11.Lee T-Y. Functional CT: physiological models. Trends Biotechnol 2002;20:S3–S1012570152 [Google Scholar]
- 12.Hoeffner EG, Case I, Jain R, et al. Cerebral perfusion CT: technique and clinical applications. Radiology 2004;231:632–44 [DOI] [PubMed] [Google Scholar]
- 13.Nabavi DG, LeBlanc LM, Baxter B, et al. Monitoring cerebral perfusion after subarachnoid hemorrhage using CT. Neuroradiology 2001;43:7–16 [DOI] [PubMed] [Google Scholar]
- 14.Strong MJ, Wolff AV, Wakayama I, et al. Aluminum-induced chronic myelopathy in rabbits. Neurotoxicology 1991;12:9–21 [PubMed] [Google Scholar]
- 15.Fukuhara T, Douville CM, Eliott JP, et al. Relationship between intracranial pressure and the development of vasospasm after aneurysmal subarachnoid hemorrhage. Neurol Med Chir (Tokyo) 1998;38:710–15 [DOI] [PubMed] [Google Scholar]
- 16.Kudo K, Terae S, Katoh C, et al. Quantitative cerebral blood flow measurement with dynamic perfusion CT using the vascular-pixel elimination method: comparison with H2(15)O positron emission tomography. AJNR Am J Neuroradiol 2003;24:419–26 [PMC free article] [PubMed] [Google Scholar]
- 17.Smith ML, Abrahams JM, Chandela S, et al. Subarachnoid hemorrhage on computed tomography scanning and the development of cerebral vasospasm: the Fisher grade revisited. Surg Neurol 2005;63:229–34 [DOI] [PubMed] [Google Scholar]
- 18.Mayberg MR. Cerebral vasospasm. Neurosurg Clin N Am 1998;9:615–27 [PubMed] [Google Scholar]
- 19.van Gijn J, Rinkel GJ. Subarachnoid haemorrhage: diagnosis, causes and management. Brain 2001;124(Pt 2):249–78 [DOI] [PubMed] [Google Scholar]
- 20.Huang J, van Gelder JM. The probability of sudden death from rupture of intracranial aneurysms: a meta-analysis. Neurosurgery 2002;51:1101–05 [DOI] [PubMed] [Google Scholar]
- 21.Grasso G. An overview of new pharmacological treatments for cerebrovascular dysfunction after experimental subarachnoid hemorrhage. Brain Res Brain Res Rev 2004;44:49–63 [DOI] [PubMed] [Google Scholar]
- 22.Fisher CM, Kistler JP, Davis JM. Relation of cerebral vasospasm to subarachnoid hemorrhage visualized by computerized tomographic scanning. Neurosurgery 1980;6:1–9 [DOI] [PubMed] [Google Scholar]
- 23.Yoshimoto Y, Tanaka Y, Sanada T. Angiographic assessment of cerebral circulation time for outcome prediction in patients with subarachnoid hemorrhage. Surg Neurol 2004;62:115–20 [DOI] [PubMed] [Google Scholar]
- 24.Alkan T, Tureyen K, Ulutas M, et al. Acute and delayed vasoconstriction after subarachnoid hemorrhage: local cerebral blood flow, histopathology, and morphology in the rat basilar artery. Arch Physiol Biochem 2001;109:145–53 [DOI] [PubMed] [Google Scholar]
- 25.Baldwin ME, Macdonald RL, Huo D, et al. Early vasospasm on admission angiography in patients with aneurysmal subarachnoid hemorrhage is a predictor for in-hospital complications and poor outcome. Stroke 2004;35:2506–11 [DOI] [PubMed] [Google Scholar]
- 26.Moftakhar R, Rowley HA, Turk A, et al. Utility of computed tomography perfusion in detection of cerebral vasospasm in patients with subarachnoid hemorrhage. Neurosurg Focus 2006;21:E6. [DOI] [PubMed] [Google Scholar]
- 27.Kanazawa R, Kato M, Ishikawa K, et al. Convenience of the computed tomography perfusion method for cerebral vasospasm detection after subarachnoid hemorrhage. Surg Neurol 2007;67:604–11. Epub 2007 Feb 15 [DOI] [PubMed] [Google Scholar]
- 28.Klingelhofer J, Dander D, Holzgraefe M, et al. Cerebral vasospasm evaluated by transcranial Doppler ultrasonography at different intracranial pressures. J Neurosurg 1991;75:752–58 [DOI] [PubMed] [Google Scholar]
- 29.Yundt KD, Grubb RL Jr, Diringer MN, et al Autoregulatory vasodilation of parenchymal vessels is impaired during cerebral vasospasm. J Cereb Blood Flow Metab 1998;18:419–24 [DOI] [PubMed] [Google Scholar]
- 30.Fujita S. Computed tomographic grading with Hounsfield number related to delayed vasospasm in cases of ruptured cerebral aneurysm. Neurosurgery 1985;17:609–12 [DOI] [PubMed] [Google Scholar]
- 31.Springborg JB, Frederiksen HJ, Eskesen V, et al. Trends in monitoring patients with aneurysmal subarachnoid haemorrhage. Br J Anaesth 2005;94:259–70 [DOI] [PubMed] [Google Scholar]
- 32.Harrod CG, Bendok BR, Batjer HH. Prediction of cerebral vasospasm in patients presenting with aneurysmal subarachnoid hemorrhage: a review. Neurosurgery 2005;56:633–54 [DOI] [PubMed] [Google Scholar]
- 33.Turowski B, du Mesnil de Rochemont, Beck J, et al. Assessment of changes in cerebral circulation time due to vasospasm in a specific arterial territory: effect of angioplasty. Neuroradiology 2005;47:134–43 [DOI] [PubMed] [Google Scholar]
- 34.Fassbender K, Hodapp B, Rossol S, et al. Inflammatory cytokines in subarachnoid haemorrhage: association with abnormal blood flow velocities in basal cerebral arteries. J Neurol Neurosurg Psychiatry 2001;70:534–37 [DOI] [PMC free article] [PubMed] [Google Scholar]
- 35.Dumont AS, Dumont RJ, Chow MM, et al. Cerebral vasospasm after subarachnoid hemorrhage: putative role of inflammation. Neurosurgery 2003;53:123–33 [DOI] [PubMed] [Google Scholar]
- 36.Maher CO, Anderson RE, Martin HS, et al. Interleukin-1beta and adverse effects on cerebral blood flow during long-term global hypoperfusion. J Neurosurg 2003;99:907–12 [DOI] [PubMed] [Google Scholar]
- 37.Ohkuma H, Manabe H, Tanaka M, et al. Impact of cerebral microcirculatory changes on cerebral blood flow during cerebral vasospasm after aneurysmal subarachnoid hemorrhage. Stroke 2000;31:1621–27 [DOI] [PubMed] [Google Scholar]


