

Abstract
BACKGROUND AND PURPOSE: The anterior commissure (AC) and substantia innominata (SI) can be clearly demonstrated at 3T high-resolution MR imaging. Our aim was to investigate if atrophy of the AC and SI on 3T MR imaging differs among patients with frontotemporal lobar degeneration (FTLD) and Alzheimer dementia (AD) and healthy subjects.
MATERIALS AND METHODS: Seven consecutive patients with FTLD, 20 patients with AD, and 16 age-matched control subjects were enrolled. MR imaging was performed at 3T. The AC thickness as well as the SI thickness was measured on a thin-section coronal T2-weighted image, and the AC area was measured on a sagittal T1-weighted image. The measurement differences among the participants were analyzed with the Kruskal-Wallis test. A correlation of the measurement with the Mini-Mental State Examination (MMSE) score was obtained with the Spearman rank correlation test.
RESULTS: Thinning of the AC was significantly more prominent in FTLD than in AD (P < .001). Although the right SI thickness was significantly decreased in patients with AD as compared with control subjects (P < .05), there was no significant difference, with a substantial overlap of the average SI thickness among the 3 groups. The thickness and the area of the AC were positively correlated with the MMSE score (ρ = 0.612, P < .001, and ρ = 0.659, P < .001, respectively). In contrast, the average SI thickness showed a weak positive correlation with the MMSE score (ρ = 0.325, P < .05).
CONCLUSION: Measurement of AC atrophy with 3T MR imaging may provide additional diagnostic clues for FTLD and AD. Conversely, SI atrophy measurement does not provide an additional benefit in the evaluation of FTLD and AD, owing to a considerable overlap in the average thickness of bilateral SI.
Frontotemporal lobar degeneration (FTLD) is the second most common cortical dementia, which is often confused with the more common condition of Alzheimer disease (AD). The characteristic clinical features of FTLD are behavioral and language dysfunction. FTLD was categorized into 3 prototypical syndromes: frontotemporal dementia, progressive nonfluent aphasia, and semantic dementia.1 In FTLD, cortical atrophy involves the frontal cortex and anterior parts of the temporal cortex and is found in some patients asymmetrically.1
The differential diagnosis for FTLD and AD has a potential impact for treatment and prognosis.2–4 Currently available drugs such as the acetylcholinesterase (AchE) inhibitor for treating AD are often ineffective for the treatment of FTLD.5 Furthermore, FTLD often shares clinical features with AD, whereas AD is often associated with FTLD clinical syndromes.6,7
In previous studies,8–10 atrophy of the substantia innominata (SI), most of which is the basal nucleus of Meynert, was demonstrated in AD as well as in FTLD. The SI has a central role in the cholinergic pathway, which is implicated in the therapeutic effect of the AchE inhibitors for AD. Thereby, we speculated that the ineffectiveness of the AchE inhibitor for FTLD might indicate less involvement of the SI in FTLD than in AD.
The anterior commissure (AC), according to previous primate studies,11–14 interconnects the right and left orbitofrontal cortices and temporal cortices. However, the medial temporal cortex, including the hippocampi, does not have direct interconnecting fibers through the AC.15 Although atrophy of the AC has been reported in Down syndrome,16 pediatric traumatic injury,17 and aging in the rhesus monkey,18 there have been no reports on its relationship with a neurodegenerative disease such as AD or other primary degenerative dementias.
Thus, we hypothesized that the neuronal loss in FTLD would result in more prominent AC atrophy than the neuronal loss in AD and that the SI thickness is more affected in AD than in FTLD. The purpose of this prospective study was to investigate if the thickness of the AC and SI, evaluated by using 3T MR imaging, differs among patients with FTLD and AD and normal subjects.
Methods
Subjects
From January 2006 to July 2007, seven consecutive patients with FTLD, 20 consecutive patients with AD, and 16 healthy control subjects were enrolled in the prospective study (Table 1). The patients with FTLD and AD were recruited from the dementia center of our hospital. All patients were diagnosed on the basis of information obtained from an extensive clinical history and physical examination. FTLD was diagnosed according to the consensus criteria established by Neary et al.1 Patients with FTLD who had motor neuron disease–related symptoms were excluded from this study. Of the 7 patients with FTLD, there were 4 patients with frontotemporal dementia variant, 1 patient with semantic dementia, and 2 patients with progressive nonfluent aphasia. Patients with AD were diagnosed according to the criteria of the National Institute of Neurologic and Communicative Disorders and Stroke-Alzheimer Disease and Related Disorders Association.19
Table 1:
Demographic data*
| FTLD (n = 7) | AD (n = 20) | Control (n = 16) | |
|---|---|---|---|
| Men/women | 4:3 | 4:16 | 5:11 |
| Age (years) | 69.3 ± 6.4 | 70.4 ± 4.3 | 68.0 ± 5.3 |
| MMSE | 18.1 ± 4.4 | 18.5 ± 4.0 | 29.1 ± 0.7 |
| CDR score | 0.71 ± 0.27 | 0.90 ± 0.45 | 0.00 ± 0.00 |
Note:—FTLD indicates frontotemporal lobar degeneration; AD, Alzheimer disease; MMSE, Mini-Mental State Examination; CDR, Clinical Dementia Rating.
Values are mean ± SD.
Sixteen age-matched control subjects were selected from a consecutive series of patients referred for the same MR imaging protocol as patients with FTLD and AD, as part of a medical checkup between January 2006 and July 2007. The following criteria were used for inclusion in the study: no clinical evidence of neuropsychiatric disorders and no apparent abnormal findings on MR imaging. A neuroradiologist reviewed the MR images. We excluded patients with a history of neurologic disease, malignancy, stroke, or brain surgery. Indications for MR imaging included headache (n = 6) and dizziness or vertigo (n = 10).
All subjects undertook a standard battery of neuropsychological tests, including assessment of global cognitive impairment using the Mini-Mental State Examination (MMSE)20 score and of global functional impairment using the Clinical Dementia Rating (CDR) scale.21 The MR imaging data for the patients were visually inspected by a neuroradiologist to rule out any major neuropathology other than neurodegeneration, such as a tumor, stroke, and severe white matter disease. All participants and their guardians provided written informed consent for participation in the study, which was approved by the institutional review board.
MR Imaging Protocol
A 3T unit (Signa HDx; GE Healthcare, Milwaukee, Wis) with an 8-channel high-resolution head coil was used for MR imaging. The routine MR imaging protocol included the following sequences: 1) axial and sagittal T1-weighted inversion-recovery (TR/TE/ TI, 2468/12/920 ms; section thickness, 5 mm; matrix, 512 × 224); 2) axial T2-weighted fast spin-echo (TR/effective TE, 4000/106 ms; section thickness, 5 mm; matrix 384 × 384); 3) axial fluid-attenuated inversion-recovery (TR/TE/TI, 11,000/105/2600 ms; section thickness, 5 mm; matrix, 384 × 224); 4), axial T2-weighted gradient-echo (TR/TE, 550/17 ms; section thickness, 5 mm; matrix, 384 × 224; flip angle, 15°); and 5) T1-weighted volumetric spoiled gradient recalled-echo (SPGR) (TR/TE, 7.3/2.7 ms; section thickness, 1.5 mm; matrix, 256 × 256; flip angle, 13°). The FOV was 230 × 230 mm.
To measure the SI thickness as well as the AC thickness, we obtained additional coronal thin-section high-resolution T2-weighted sequences with the following parameters: TR/TE, 3000/125.4 ms; matrix, 512 × 512; FOV, 198 × 220 mm; and section thickness, 2 mm with no gap. Coronal images were perpendicular to the AC–posterior commissure line and were obtained carefully to include sections through the AC clearly by using T1-weighted SPGR images as scout images.
Image Analysis
Two experienced neuroradiologists with 8 years’ experience each in evaluating neuroimaging reviewed all MR images independently. The reviewers were blinded to the diagnoses of the patients. To assess the intraobserver reliability, the 2 neuroradiologists made a second evaluation 2 weeks after the first evaluation (with images in a different order). The mean of 4 measurements (2 measurements determined by each observer) was used as the final measured value for each case. Measurement of the AC area, AC thickness, and SI thickness was performed on a PACS workstation.
The AC area was measured on a midsagittal section of sagittal T1-weighted inversion-recovery images. The border of the AC was outlined manually with a trackball to calculate the cross-sectional area (Fig 1A). The AC and the SI thicknesses were measured on coronal thin-section high-resolution T2-weighted images (Fig 1B). The AC thickness was measured as the distance between the superior and inferior border at the coronal plane that intersected the midportion of the AC (Fig 1). The SI thickness was measured on the same coronal plane as the AC thickness. The upper margin of the SI was defined as the lower end of the hypointensity of the ventral pallidum, whereas the lower margin was defined as the surface of the anterior perforated substance. The SI thickness was measured at the narrowest portion of the middle third as described by Hanyu et al.9
Fig 1.

Schema of the MR imaging measurements. A, A sagittal T1-weighted inversion-recovery image shows the AC area (dotted circle and arrow) in a control subject. The corpus callosum (CC), fornix (f), and mamillary body (m) are identified. B, A coronal thin-sectional T2-weighted image shows the AC (a), the SI (i), the diagonal gyrus (d), and the ventral pallidum (v). AC (bidirectional arrow) and the SI thicknesses (arrows) are depicted. LV indicates left ventricle.
Statistical Analysis
Statistical analysis was performed by using the Statistical Package for the Social Sciences (Version 12.0 for Windows; SSPS, Chicago, Ill). The level of significance was defined at P < .05. To compare the clinical features between FTLD and AD, we used the Mann-Whitney U test for continuous variables. The Kruskal-Wallis test was used to evaluate differences in the AC area, the AC thickness, and the SI thickness among all groups, followed by a post hoc comparison.
The correlation between the clinical score (MMSE) and MR imaging measurements was assessed with the Spearman correlation coefficient. The interobserver and intraobserver reliability between the 2 reviewers and the difference between right and left SI thickness for the same reviewer were also assessed with the Spearman correlation coefficient.
Results
The AC area ranged from 2.62 to 8.68 mm2 (mean, 5.45 ± 0.68 mm2) in the patients with FTLD, from 5.85 to 12.11 mm2 (mean, 8.97 ± 1.84 mm2) in the patients with AD, and from 9.08 to 14.73 mm2 (mean, 12.47 ± 1.42 mm2) in the control subjects (Table 2). The AC thickness ranged from 1.72 to 2.81 mm (mean, 2.23 ± 0.42 mm) in the patients with FTLD, from 2.15 to 3.96 mm (mean, 2.97 ± 0.50 mm) in the patients with AD, and from 3.01 to 4.30 mm (mean, 3.67 ± 0.48 mm) in the control subjects (Table 2). The mean AC area and the AC thickness were significantly lower in the patients with FTLD than in the patients with AD and in control subjects (P < .001) (Figs 2 and 3). Although there was some overlap, the AC area and AC thickness in the patients with AD were significantly lower than those of the control subjects (P < .01). None of the measured AC areas and AC thicknesses in the patients with FTLD surpassed the lowest AC thickness for the control subjects (Figs 3 and 4). Regarding the subtypes of FTLD, the mean AC area and AC thickness were 5.50 mm2 (range, 2.6–8.68 mm2) and 2.24 mm (range, 1.72–2.46 mm) in the patients with frontotemporal dementia variant (n = 4), 4.84 mm2 and 1.72 mm in the patient with semantic dementia (n = 1), and 5.65 mm2 and 2.48 mm in the patients with progressive nonfluent aphasia (n = 2).
Table 2:
MR Measurement of the AC and SI thicknesses*
| FTLD (n = 7) | AD (n = 20) | Control (n = 16) | P | |
|---|---|---|---|---|
| AC area (mm2), AC thickness† (mm) | 5.45 ± 1.80, 2.23 ± 0.42 | 8.97 ± 1.84, 2.97 ± 0.50 | 12.47 ± 1.42, 3.67 ± 0.48 | <.001†, <.001 |
| Average SI thickness (mm) | 2.31 ± 0.17 | 2.17 ± 0.50 | 2.45 ± 0.33 | .147 |
| Right SI thickness (mm) | 2.35 ± 0.19 | 2.11 ± 0.53 | 2.50 ± 0.36 | .041‡ |
| Left SI thickness (mm) | 2.28 ± 0.19 | 2.25 ± 0.56 | 2.45 ± 0.37 | .419 |
Note:—AC indicates anterior commissure; SI, substantia innominata; FTLD, frontotemporal lobe degeneration; AD, Alzheimer disease.
Values are mean ± SD.
P < .01 between FTLD versus AD, FTLD versus control, and AD versus control.
P < .05 between AD versus control.
Fig 2.
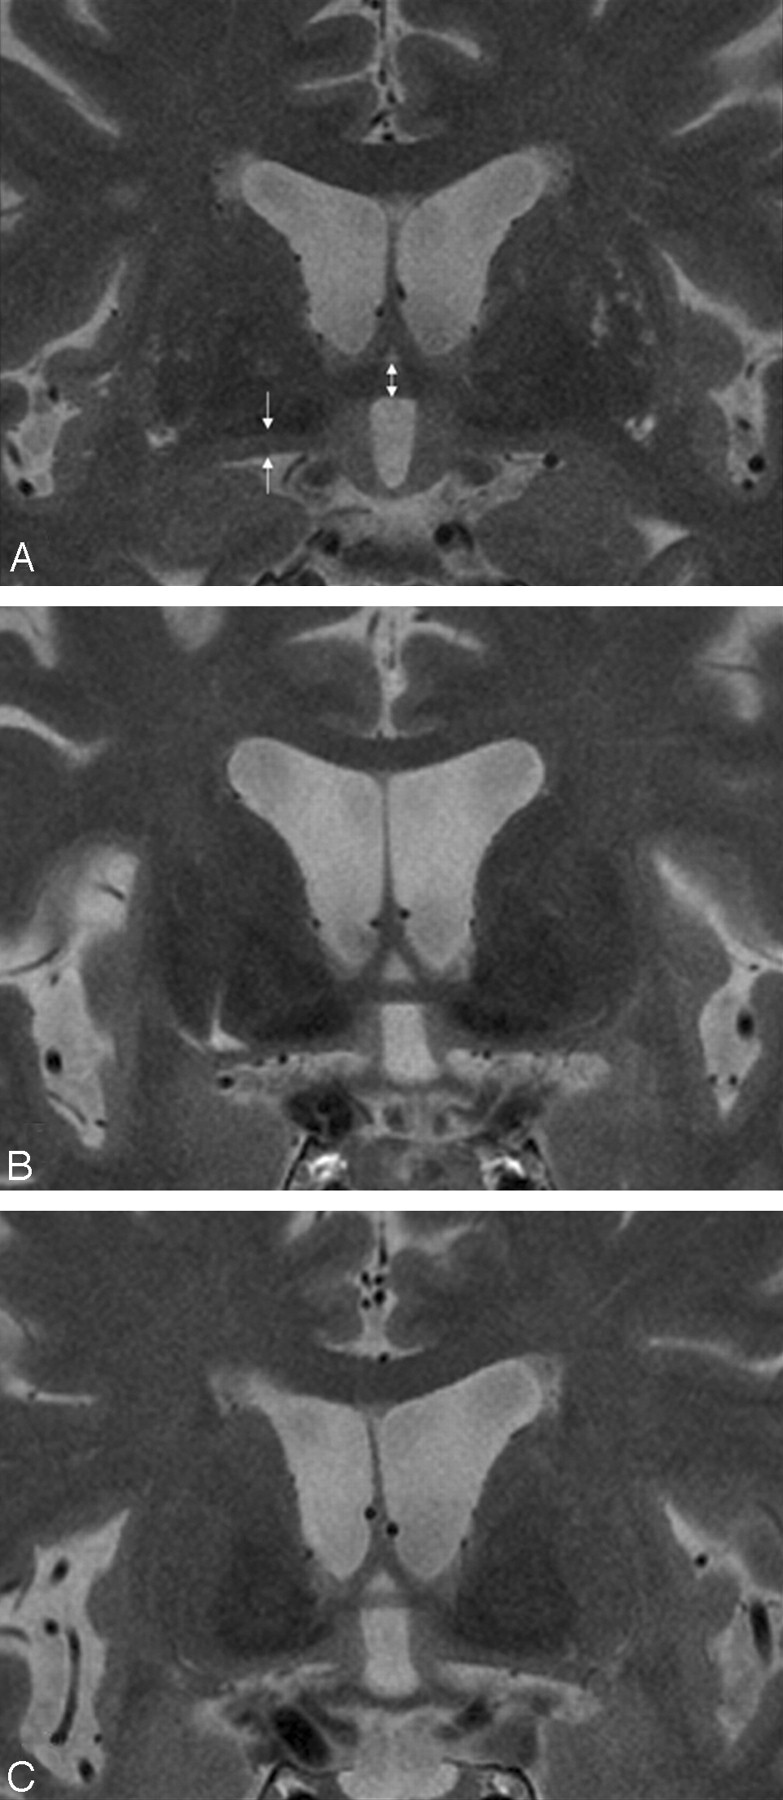
Measurement of the AC and SI thicknesses. Coronal T2-weighted fast spin-echo (TR/TE, 3000/125.4 ms; section thickness, 2 mm) MR images show the AC thickness (bidirectional arrow) in a control subject (A; AC thickness, 4.30 mm), a patient with AD (B; AC thickness, 3.01 mm), and a patient with FTLD (C; AC thickness, 2.15 mm). The arrows indicate the measured part of the thickness of the SI. Thinning of the SI is noted in the patient with AD and to a lesser degree in the patient with FTLD.
Fig 3.

Boxplot of the AC area in patients with FTLD and AD and control subjects. The line across the box represents the median value. The box ends represent the first and third quartiles. The end points of each graph represent the smallest and largest values. The median AC area is the lowest in the FTLD group of patients compared with the patients with AD and control subjects. None of the AC cross-sectional area measurements in the FTLD group of patients reached the lowest value obtained for the control subjects.
Fig 4.

Boxplot of the AC thickness in patients with FTLD and AD and control subjects. The line across the box represents the median value. The box ends represent the first and third quartiles. The end points of each graph represent the smallest and largest values. The median AC thickness is the lowest in the FTLD group of patients compared with the patients with AD and control subjects. Although considerable overlap of the values between the FTLD and AD groups of patients exists, none of the AC measurements in the FTLD group of patients reached the lowest value obtained for the control subjects.
In contrast, the average thicknesses of the bilateral SI and the left SI thickness were not significantly different among the 3 groups. Nevertheless, the SI thickness in the patients with AD tended to be lower than that in patients with FTLD and in control subjects (Fig 5). Concerning the right SI thickness, there was a significant difference between the patients with AD and the control subjects (P < .05).
Fig 5.

Boxplot of the SI thickness in patients with FTLD and AD and control subjects. The line across the box represents the median value. The box ends represent the first and third quartiles. The end points of each graph represent the smallest and largest values. The median SI thickness tends to be lower in the AD group of patients compared with the FTLD group of patients and control subjects. Note the considerable overlap of the values between the patients with FTLD and control subjects.
A strong positive correlation was found between the AC area and the MMSE score (ρ = 0.659, P < .001) and between the AC thickness and the MMSE score (ρ = 0.612, P < .001) in patients and control subjects. In contrast, a weak correlation between the SI thickness and the MMSE score was observed (ρ = 0.325, P < .05).
The right and left SI thicknesses showed no significant difference in all groups considered. The intraobserver reliability of the AC area and the AC thickness was 0.90 and 0.95 for the first reader and 0.85 and 0.91 for the second reader. The intraobserver reliability of the right SI thickness was 0.89 for the first reader and 0.87 for the second reader. The interobserver reliability of the measurement procedure was 0.88 for the AC area, 0.92 for the AC thickness, 0.87 for the right SI thickness, and 0.85 for the left SI thickness. The correlation coefficient between the values recorded for the left and right SI thickness was 0.739 for the first reader and 0.743 for the second reader.
Discussion
In this study, we report results of the measurement of atrophy of specific white matter and gray matter structures that represent the pathology of FTLD and AD. We found that AC atrophy was most prominent in the patients with FTLD, even though some of the patients with AD showed mild-to-moderate atrophy of the AC compared with the control subjects.
According to previous human and primate studies, the AC provides the interhemispheric connection for the entire neocortex of the temporal lobe, parts of the orbitofrontal cortex, the prepiriform cortex, and the amygdala.12–14,18 The anterior one third of the temporal cortex (temporal pole, superior and inferior temporal gyri, and parahippocampal gyrus) composes the largest connection of the AC.15,18 In humans, even the occipital cortex was reported to connect through the AC.15
In contrast to the corpus callosum, the AC has not been a subject of research interest for dementia by neuropathologic and neuroimaging studies until recently. There have been only a few reports describing AC atrophy in certain diseases or in control subjects.15–18,22 Sylvester16 reported that the cross-sectional area of the AC on the sagittal section of the brain from an autopsy was significantly smaller in patients with Down syndrome than in control subjects. Although these investigators suggested AC thinning as a result of congenital malformation, it is more likely to be a result of regional brain atrophy and resultant white matter degeneration, considering the fact that 77% of patients with Down syndrome had a histopathology of AD in the study. In a study of aging Rhesus monkeys, the AC showed a gradual volume loss with aging.18 Furthermore, there was a significant relationship between cognitive performance and the number of nerve fibers in the AC. A reduction in the density of fibers in the AC has been reported in patients with schizophrenia.22 The pathologic study revealed no sex-specific difference in the cross-sectional area in the AC, but there was a sex-specific difference in the fiber attenuations.22
FTLD has been characterized by cortical atrophy of the frontal and temporal lobe.23,24 A previous pathologic study showed that FTLD is associated with the orbital and medial frontal cortex in the early stage.25 Prominent AC atrophy in FTLD demonstrated in our study corroborates these previous pathologic and neuroimaging studies for FTLD because the AC conveys the axons interconnecting the orbitofrontal cortex as well as the anterior one third of the temporal cortex.
We could not evaluate statistically the difference in the AC thickness or the AC area in patients with the 3 subtypes of FTLD due to the small number of subjects. However, we found that patients with semantic dementia showed the smallest AC thickness compared with patients with the other types of FTLD. We speculate that this may be due to prominent involvement of semantic dementia with the anterior temporal lobe, where nerve fibers project to and from the major part of the AC.26
Due to the small size of this study, diagnostic accuracy could not be determined. In this study, an AC thickness of ≤2 mm and an AC area of ≤5.5 mm2 were only observed in patients with FTLD. Therefore, the AC thickness and the AC area might be used as biomarkers for diagnosing and distinguishing patients with FTLD from patients with AD and from control subjects.
We also sought to evaluate and compare the SI thickness in patients with FTLD, patients with AD, and control subjects and found that the SI in patients with AD was more severely involved, though there was some overlap between the 3 groups. Neuronal loss of the nucleus basalis of Meynert (a major part of the SI) is observed in AD and other diseases pathologically as well as radiologically.8–10 Because the SI contains mainly the nucleus basalis of Meynert, atrophy of the SI structure is probably due to a loss of neurons in the nucleus basalis of Meynert and a reduction in the number of neuropils.8,9 Neuronal loss of the nucleus basalis of Meynert is regarded as a causative lesion of diffuse loss of AchE activity in the cerebral cortex.8,9 In a previous study, FTLD and other types of dementia as well as AD showed prominent SI atrophy.9 However, we did not find a statistical difference in SI atrophy between patients with FTLD and patients with AD and between patients with FTLD and control subjects. On the basis of the known ineffectiveness of the AchE inhibitors for FTLD,5 we hypothesized that SI atrophy would not be as prominent in FTLD as in AD. An insignificant difference of SI atrophy between FTLD and control subjects in our study supports this hypothesis and provides an explanation for the different response to AchE inhibitors for FTLD and AD.
Conversely, the trend for SI atrophy demonstrated for the patients with AD is consistent with findings of previous reports.8,9 Unlike in previous reports, we demonstrated that only right SI atrophy (and not left SI atrophy) was significantly different between AD and control subjects and that the range of SI atrophy was broader than that of patients with FTLD and control subjects. This finding may be mostly due to the small number of patients in this study. The higher variability of SI atrophy in AD suggests the existence of 2 or more subtypes within the disease category that might be related to the different response to AchE inhibitors.
Regarding to relationship with clinical scoring, both the AC thickness/area and SI thickness showed a significant correlation with the MMSE score, and the AC thickness/area revealed a stronger correlation with the MMSE score. The findings for the SI thickness in relation to the MMSE score are consistent with a previous study.8 A stronger correlation of the AC thickness/area with the MMSE score suggests that a serial measurement of the AC thickness/area can predict the clinical status more precisely.
Both AC and SI are relatively small structures in the basal forebrain for precise measurement. High-resolution images with higher signal intensity-to-noise ratios at 3T can provide an accurate measurement of such a small structure. High intrarater and inter-rater agreement for the MR imaging measurements supports their use as helpful imaging markers for the evaluation of FTLD and AD.
This study has some limitations and methodologic issues. First, the study included a small number of patients, which might cause a lower statistical power. Second, the assignment of the diagnosis was based not on a pathologic specimen but on the clinical criteria, which is the current gold standard. Therefore, we could not exclude the possibility of an incomplete distinction between AD and FTLD by the clinical criteria alone. A further study on a larger scale would be necessary to support our preliminary results. Third, we did not measure an area or volume measurement of the structure of interest on thin-section high-resolution images. Although the AC cross-sectional area was measured on sagittal T1-weighted images, it would be prone to partial volume effects due to relatively thick sections. An area or volume measurement may be more sensitive than a thickness measurement in the evaluation of such a small anatomic structure. Finally, there is still the issue of pixel resolution for measurement of these small structures. Even though we obtained the imaging data with high-resolution (a pixel size of 0.43 mm) and a high signal intensity-to-noise ratio by using 3T MR imaging, the current limitation of in-plane resolution might lead to some overlaps between the 2 groups of patients with dementia and a failure to detect subtle changes.
In conclusion, our findings indicate that 3T MR imaging can depict clearly AC atrophy that occurs in patients with FTLD and AD and suggest that measurement of the AC thickness may be helpful in distinguishing FTLD from AD. In contrast, measurement of SI atrophy does not provide an additional benefit in the evaluation of FTLD and AD, owing to a considerable overlap in the average thickness of bilateral SI.
Footnotes
This work was supported by a grant of the Korea Health 21 R&D Project (A050079), Ministry of Health and Welfare, Republic of Korea.
References
- 1.Neary D, Snowden JS, Gustafson L, et al. Frontotemporal lobar degeneration: a consensus on clinical diagnostic criteria. Neurology 1998;51:1546–54 [DOI] [PubMed] [Google Scholar]
- 2.Goldman JS, Farmer JM, Wood EM, et al. Comparison of family histories in FTLD subtypes and related tauopathies. Neurology 2005;65:1817–19 [DOI] [PubMed] [Google Scholar]
- 3.Roberson ED, Hesse JH, Rose KD, et al. Frontotemporal dementia progresses to death faster than Alzheimer disease. Neurology 2005;65:719–25 [DOI] [PubMed] [Google Scholar]
- 4.Rabinovici GD, Furst AJ, O’Neil JP, et al. 11C-PIB PET imaging in Alzheimer disease and frontotemporal lobar degeneration. Neurology 2007;68:1205–12 [DOI] [PubMed] [Google Scholar]
- 5.Perry RJ, Miller BL. Behavior and treatment in frontotemporal dementia. Neurology 2001;56:S46–51 [DOI] [PubMed] [Google Scholar]
- 6.Galton CJ, Patterson K, Xuereb JH, et al. Atypical and typical presentations of Alzheimer's disease: a clinical, neuropsychological, neuroimaging and pathological study of 13 cases. Brain 2000;123(Pt 3):484–98 [DOI] [PubMed] [Google Scholar]
- 7.Varma AR, Snowden JS, Lloyd JJ, et al. Evaluation of the NINCDS-ADRDA criteria in the differentiation of Alzheimer's disease and frontotemporal dementia. J Neurol Neurosurg Psychiatry 1999;66:184–88 [DOI] [PMC free article] [PubMed] [Google Scholar]
- 8.Hanyu H, Tanaka Y, Sakurai H, et al. Atrophy of the substantia innominata on magnetic resonance imaging and response to donepezil treatment in Alzheimer's disease. Neurosci Lett 2002;319:33–36 [DOI] [PubMed] [Google Scholar]
- 9.Hanyu H, Asano T, Sakurai H, et al. MR analysis of the substantia innominata in normal aging, Alzheimer disease, and other types of dementia. AJNR Am J Neuroradiol 2002;23:27–32 [PMC free article] [PubMed] [Google Scholar]
- 10.Sasaki M, Ehara S, Tamakawa Y, et al. MR anatomy of the substantia innominata and findings in Alzheimer disease: a preliminary report. AJNR Am J Neuroradiol 1995;16:2001–07 [PMC free article] [PubMed] [Google Scholar]
- 11.Pandya DN, Karol EA, Lele PP. The distribution of the anterior commissure in the squirrel monkey. Brain Res 1973;49:177–80 [DOI] [PubMed] [Google Scholar]
- 12.Jouandet ML, Gazzaniga MS. Cortical field of origin of the anterior commissure of the rhesus monkey. Exp Neurol 1979;66:381–97 [DOI] [PubMed] [Google Scholar]
- 13.Jouandet ML, Garey LJ, Lipp HP. Distribution of the cells of origin of the corpus callosum and anterior commissure in the marmoset monkey. Anat Embryol (Berl) 1984;169:45–59 [DOI] [PubMed] [Google Scholar]
- 14.Demeter S, Ringo JL, Doty RW. Morphometric analysis of the human corpus callosum and anterior commissure. Hum Neurobiol 1988;6:219–26 [PubMed] [Google Scholar]
- 15.Di Virgilio G, Clarke S, Pizzolato G, et al. Cortical regions contributing to the anterior commissure in man. Exp Brain Res 1999;124:1–7 [DOI] [PubMed] [Google Scholar]
- 16.Sylvester PE. The anterior commissure in Down's syndrome. J Ment Defic Res 1986;30 (Pt 1):19–26 [DOI] [PubMed] [Google Scholar]
- 17.Wilde EA, Bigler ED, Haider JM, et al. Vulnerability of the anterior commissure in moderate to severe pediatric traumatic brain injury. J Child Neurol 2006;21:769–76 [DOI] [PubMed] [Google Scholar]
- 18.Sandell JH, Peters A. Disrupted myelin and axon loss in the anterior commissure of the aged rhesus monkey. J Comp Neurol 2003;466:14–30 [DOI] [PubMed] [Google Scholar]
- 19.McKhann G, Drachman D, Folstein M, et al. Clinical diagnosis of Alzheimer's disease: report of the NINCDS-ADRDA Work Group under the auspices of Department of Health and Human Services Task Force on Alzheimer's Disease. Neurology 1984;34:939–44 [DOI] [PubMed] [Google Scholar]
- 20.Folstein MF, Folstein SE, McHugh PR. “Mini-mental state”: a practical method for grading the cognitive state of patients for the clinician. J Psychiatr Res 1975;12:189–98 [DOI] [PubMed] [Google Scholar]
- 21.Morris JC. The Clinical Dementia Rating (CDR): current version and scoring rules. Neurology 1993;43:2412–14 [DOI] [PubMed] [Google Scholar]
- 22.Highley JR, Esiri MM, McDonald B, et al. The size and fiber composition of the anterior commissure with respect to gender and schizophrenia. Biol Psychiatry 1999;45:1120–27 [DOI] [PubMed] [Google Scholar]
- 23.Kersaitis C, Halliday GM, Xuereb JH, et al. Ubiquitin-positive inclusions and progression of pathology in frontotemporal dementia and motor neurone disease identifies a group with mainly early pathology. Neuropathol Appl Neurobiol 2006;32:83–91 [DOI] [PubMed] [Google Scholar]
- 24.Du AT, Schuff N, Kramer JH, et al. Different regional patterns of cortical thinning in Alzheimer's disease and frontotemporal dementia. Brain 2007;130:1159–66 [DOI] [PMC free article] [PubMed] [Google Scholar]
- 25.Broe M, Kril J, Halliday GM. Astrocytic degeneration relates to the severity of disease in frontotemporal dementia. Brain 2004;127:2214–20 [DOI] [PubMed] [Google Scholar]
- 26.Garrard P, Hodges JR. Semantic dementia: clinical, radiological and pathological perspectives. J Neurol 2000;247:409–22 [DOI] [PubMed] [Google Scholar]