Abstract
BACKGROUND AND PURPOSE: The anterior pituitary of a term neonate is usually hyperintense on T1-weighted MR images, which may represent histologic changes of the gland due to the effect of high estrogen levels during the fetal period; however, MR findings of a preterm neonate have not been fully evaluated. The purpose of this study was to investigate whether intensity and size of the neonatal anterior pituitary on MR images obtained near term of corrected age correlates with the gestational age at birth or postnatal time.
MATERIALS AND METHODS: Data of 88 consecutive neonates (gestational age, 24–41 weeks; mean, 31.5 weeks) were analyzed. All of the neonates underwent MR imaging at a corrected age of 0 months ± 4 weeks. Relative signal intensity of the anterior pituitary compared with that of the pons on T1-weighted sagittal images was calculated. Height of the pituitary was also measured. Stepwise regression analysis was performed to evaluate the effects of gestational age at birth and postnatal time on the relative signal intensity and on the pituitary height.
RESULTS: The relative signal intensity significantly negatively correlated with postnatal time (P = .001) but not with gestational age at birth (P = .42). Pituitary height significantly negatively correlated with postnatal time (P = .049) but not with gestational age at birth (P = .071).
CONCLUSION: A significant negative correlation exists between postnatal time and signal intensity on T1-weighted MR images of the anterior pituitary obtained near term. A nonhyperintense anterior pituitary is a normal MR finding of preterm neonates when imaged near term.
Several MR studies have revealed changes in size, shape, and intensity of the neonatal anterior pituitary gland.1–5 The anterior pituitary usually shows bright signal intensity on T1-weighted MR images in term neonates.1–3 This bright signal intensity is known to be seen only in early infancy and begin to disappear from approximately 2 months after birth.2,3 After the first few months, the gland displays the appearance of an adult gland.1–3,6 To the best of our knowledge, MR findings of a preterm neonate have not been fully evaluated.
Several histologic analyses of the human fetal anterior pituitary gland have been reported.7–9 Asa et al7 reported that, after gestational week 25, the most significant change in histology of the anterior pituitary is an increase in prolactin-containing cells. van Nesselrooij et al10 clarified that the pituitary of a rat that had received estrogen developed hyperplasia of prolactin cells, and MR imaging detected enlargement of the gland.10 Kovacs and Horvath11 stated that, due to the effect of maternal estrogen, prolactin cells are numerous in the fetus and neonate, decreasing after birth and remaining low during childhood. These reports suggest that estrogen may be 1 of the key hormones in maturation of the anterior pituitary gland in pregnancy.
The placenta is the principal source of increases in steroids, estrogens, and progesterone during pregnancy.12,13 From the perspective of the period under the effect of estrogen produced by placenta, some histologic differences in the anterior pituitary may present due to the duration of pregnancy.
We hypothesized that gestational age at birth and intensity of the anterior pituitary on MR images obtained near term of corrected age may be positively correlated and/or that postnatal time (elapsed time between birth and the MR examination) and intensity of the anterior pituitary may be negatively correlated, because neonates with a shorter gestational period have a shorter period under the effects of estrogen during the fetal period and a longer period after removal of the influence of placental estrogen. The purpose of this study was to reveal whether intensity and size of the neonatal anterior pituitary on MR images obtained near term of corrected age correlates with the gestational age at birth or postnatal time.
Materials and Methods
Subjects
Data of 88 consecutive neonates (mean gestational age, 31.5 weeks; range, 24–41 weeks) who had been referred for screening brain MR examination between January 2001 and February 2007 were retrospectively analyzed. In our institution, all of the neonates born preterm (birth before gestational week 37) underwent brain MR imaging near term of corrected age (age corrected for prematurity; the chronologic age minus the number of weeks born premature), for the purpose of excluding ischemic or hemorrhagic lesions at the time of discharge from the hospital. All of the neonates underwent MR imaging at a corrected age of 0 months ± 4 weeks, after the end of the preterm period. Postnatal time (elapsed time between birth and MR examination) ranged from 0 to 122 days (mean, 59.2 days; SD, 30.2 days). A total of 78 of the 88 neonates were delivered preterm (birth before gestational week 37), and the remaining 10 neonates were delivered at term. Exclusion criteria were composed of the following: 1) brain malformation; 2) intracranial mass lesion; 3) hydrocephalus; or 4) unsatisfactory midline T1-weighted images due to motion artifacts on brain MR image. The 10 term neonates in this study underwent MR imaging for exclusion of intracranial abnormality after diagnosis of meconium aspiration syndrome (n = 2), large for dates (n = 2), aortic coarctation (n = 1), diaphragmatic herniation (n = 1), fetal distress (n = 1), intrauterine growth retardation (n = 2), and possible Menkes kinky hair disease (n = 1). None of the 88 neonates displayed abnormal findings on brain MR images or significantly hypointense pituitary gland on the T1-weighted images suggestive of pituitary infarction. Seventy seven of the 88 neonates were administered oxygen (60 neonates treated with mechanical ventilation), and 10 were treated with dopamine infusion. The durations of each treatment were 0–98 days (mean, 25.1 days; SD, 27.8 days) and 0–30 days (mean, 0.96 days; SD, 3.7 days), respectively. Our current retrospective study received departmental review board approval.
MR Imaging Technique
MR imaging was performed by using a 1.5T imager (Signa; GE Medical Systems, Milwaukee, Wis). Midline T1-weighted sagittal images were used for quantitative analysis. Imaging parameters of T1-weighted sagittal images included TR of 400 ms, TE of 20 ms (400/20 ms) with 2 signals averaged, a 192 × 256 matrix, 3-mm section thickness without intersection gap, and FOV of 180 mm. The polarity of the readout gradient of the sagittal imaging was set so that fat was moved posteriorly by chemical shift misregistration artifacts, which is important for measuring the pituitary height.14 On all of the midline T1-weighted sagittal images, the pituitary gland was clearly imaged, free from any significant artifacts, such as ghost artifact due to pulsation from the internal carotid artery or susceptibility artifact.
Routine T1- and T2-weighted axial imaging was also performed. Parameters for routine T1-weighted imaging (400/20 ms, with 2 signals averaged) included a 192 × 256 matrix, 4-mm section thickness without intersection gap, and FOV of 180 mm. Parameters for T2-weighted imaging (3000/80 ms, with 1 signal intensity averaged) included a 192 × 256 matrix, 3-mm section thickness with a 1-mm intersection gap, and FOV of 180 mm.
Image Analysis
Image selection procedures were performed on a PACS system (Centricity, Workstation version 2.0 M4; GE Medical Systems). Measurements were performed by one of the authors, who was blinded to subject information.
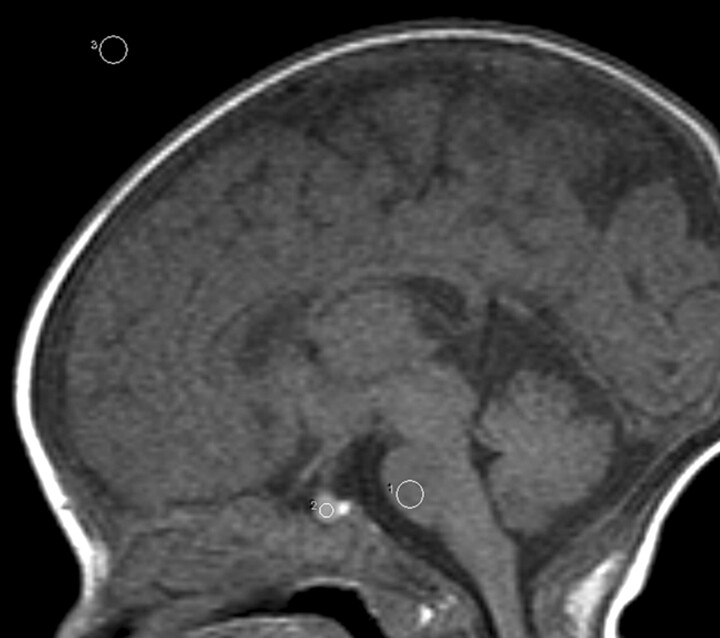
Mean MR signal intensity from the anterior pituitary, pons, and air was measured by using a region-of-interest cursor. We fixed the sizes of these regions of interest at 2.6 mm2 (4 pixels), 9.9 mm2 (15 pixels), and 9.9 mm2 (15 pixels), which were located for the center of the anterior pituitary gland, pons (basis pontis), and air, respectively (Fig 1). Relative signal intensity of the anterior pituitary to that of the pons on T1-weighted sagittal images was calculated according to the following formula: (A − a)/(P − a), where “A,” “P” and “a” represent the mean signal intensities of the anterior pituitary gland, pons, and air, respectively. Signal intensity of air was measured as background signal intensity. Measurements of mean signal intensity of the anterior pituitary gland and pons were obtained along a line in the phase-encoding direction at the same horizontal level as the pituitary gland. This method was chosen to assure that noise in the 2 regions would be equivalent. In a previous study regarding the neonatal anterior pituitary, Argyropoulou et al4 measured signal intensity of white matter of the cerebellar vermis instead of the pons for comparison with that of the anterior pituitary, because the vermis is already myelinated by gestational week 25. However, in the current study, signal intensity of the basis pontis was used for comparison. As Barkovich et al15 described, that maturation of the basis pontis increased less rapidly, occurring during the third to sixth months, degree of myelination of the basis pontis should not be significantly different among subjects of similar corrected age. Height of the pituitary gland was also measured by using a workstation. Maximal craniocaudal height of the pituitary gland was measured on the midline T1-weighted sagittal images by an experienced radiologist by using an electronic caliper of the display.
Fig 1.
Shape and position of the regions of interest placed in pons, the anterior pituitary gland, and air, respectively.
Statistical Analysis
Stepwise regression analysis was used to evaluate the effects of gestational age at birth and postnatal time on relative signal intensity and the effects of gestational age at birth and postnatal time on pituitary height. All of the statistical analyses were performed by using JMP statistical software version 5.0 (SAS Institute, Cary, NC).
Results
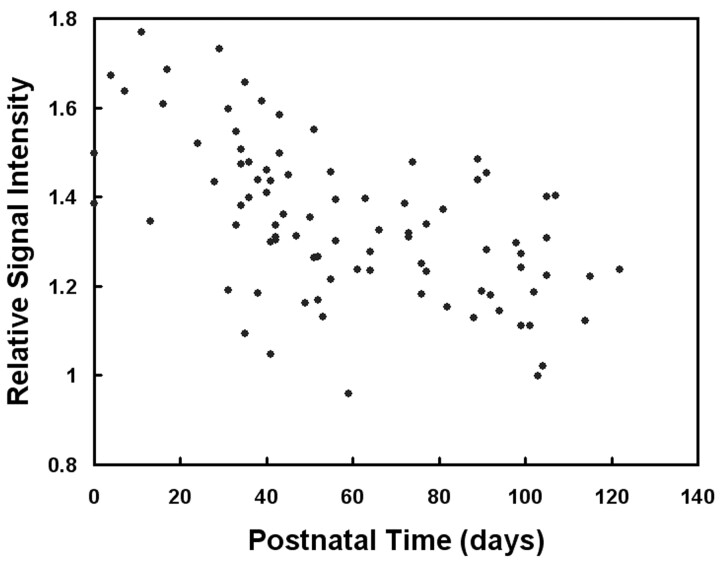
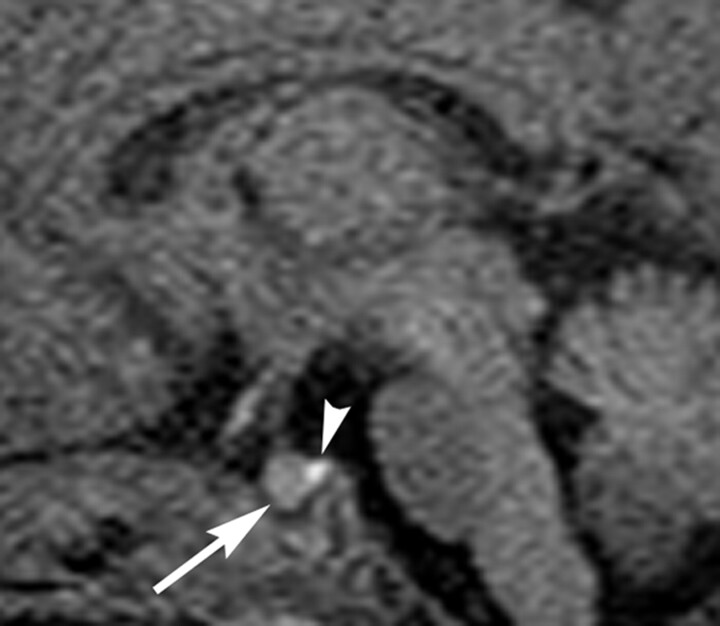
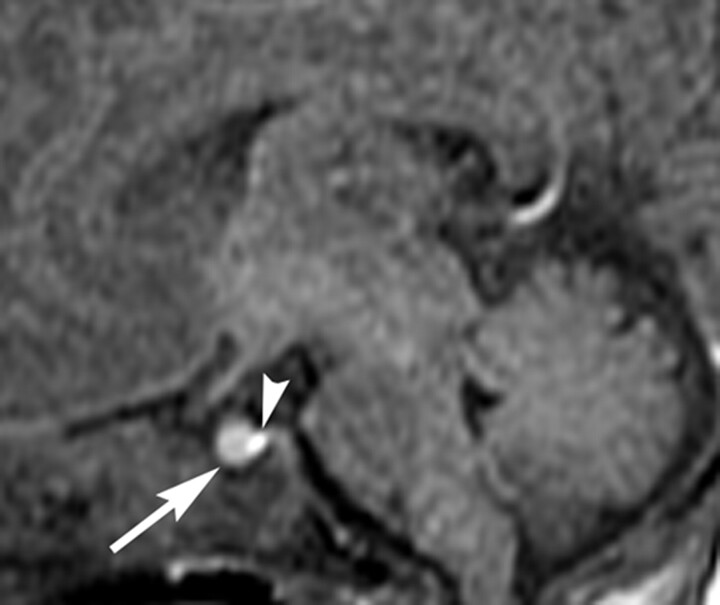
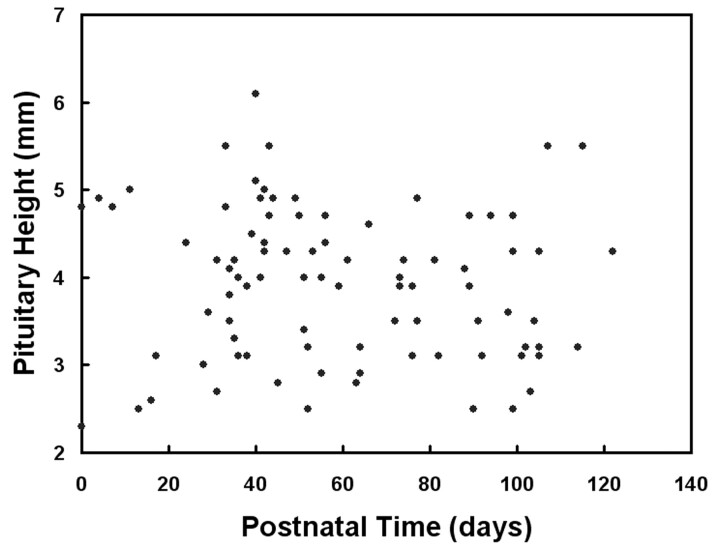
Mean and SD of the ratio of relative signal intensity of the anterior pituitary gland compared with that of the pons were 1.34 and 0.17, respectively. The relative signal intensity significantly negatively correlated with postnatal time (P = .001; Fig 2) but not with gestational age at birth (P = .42). Representative images are shown for a preterm neonate (Fig 3, born at gestational week 28) and a term neonate (Fig 4, born at gestational week 38). Mean and SD of pituitary height were 3.9 and 0.7 mm, respectively. Pituitary height showed weak but statistical correlation with postnatal time (P = .049; Fig 5) but not with gestational age at birth (P = .071).
Fig 2.
Ratio of relative signal intensity of the anterior pituitary gland to that of the pons (A − a)/(P − a) as a function of postnatal time. A negative correlation is depicted between relative signal intensity and postnatal time (P = .001).
Fig 3.
Sagittal T1-weighted MR image of the pituitary gland in a preterm neonate (born at gestational week 28) obtained near term (corrected age of 39 weeks; 77 days after birth). The anterior pituitary gland (arrow) is not significantly hyperintense. Arrowhead indicates hyperintensity of the posterior pituitary. Note that white matter is not hyperintense like adults because of the neonatal immaturity of myelination.
Fig 4.
Sagittal T1-weighted MR image of the pituitary gland in a term neonate (born at gestational week 38) obtained near term (corrected age of 39 weeks; 7 days after birth). The anterior pituitary gland (arrow) is hyperintense. Arrowhead indicates the posterior lobe.
Fig 5.
Pituitary height as a function of postnatal time. A negative correlation is depicted between height and postnatal time (P = .049).
Discussion
The anterior pituitary usually shows bright signal intensity on T1-weighted MR images in term neonates, but to our knowledge, no previous studies have revealed the relationship between postnatal time and MR imaging findings of the anterior pituitary near term of corrected age in preterm neonates. The results of the present study demonstrated a significant negative correlation between postnatal time and intensity of the anterior pituitary on T1-weighted MR images obtained near term. Argyropoulou et al4 and Kiortsis et al,5 respectively, analyzed MR imaging findings of the anterior pituitary in preterm infants up to 24 months and found that intensity of the anterior pituitary displayed negative correlations with chronologic and corrected age and height of the glands were higher in preterm infants than in term infants. However, the age ranges of their studies are wide; corrected age −1.64 to 11.70 months and 0.33 to 2.00 years, respectively, and few or no neonates around term were included in those studies.
The neonatal anterior pituitary is known to usually appear hyperintense on T1-weighted MR images. Several MR studies have revealed that this hyperintensity remains during the first 2 months after birth.1–3 The mechanisms underlying hyperintensity of the anterior pituitary gland in infancy are not fully understood but are believed to be related to histologic changes within the lobe.1–3,16 Wolpert et al1 and Cox and Elster2 suggested that the mechanism of T1 shortening of the neonatal anterior pituitary may be related to increases in the amount of endoplasmic reticulum and high protein synthetic activity.
The most significant change in microscopic morphology of the anterior pituitary gland in common between the fetus and women in late gestation and during lactation is a substantial increase in the number of prolactin cells.7,9,17,18 In the human fetal anterior pituitary gland, prolactin cells increase in number after gestational week 25, with 25%–30% of prolactin cells at gestational week 36, and 40% at term.7 In the maternal anterior pituitary gland, hyperplasia of prolactin cells is evident at 1 month of gestation and progresses to a maximum at the time of delivery. Around term, 60%–70% of maternal anterior pituitary gland cells may be prolactin cells, and this level remains high during lactation. In the postpartum period, prolactin cells slowly regressed to within the normal range.9,17,18 An underlying common endocrinologic environment in fetuses and pregnant women, common physiologic changes like endocrine balance, and hormone production may cause alterations to the pituitary gland in both fetuses and pregnant women.
Although maternal pituitary hormones do not cross the placenta, hormones produced by the placenta affect both neonates and pregnant women.19 The placenta is the principal source of the greatly increased amounts of steroids during pregnancy and produces estrogens by aromatization of 19C steroid precursors derived from the circulation.12,13 van Nesselrooij et al10 clarified that the pituitaries of rats that had received estrogen developed hyperplasia of prolactin cells, and MR imaging detected enlargement of the gland. Kovacs and Horvath11 described estrogens as increasing the number of prolactin cells in the fetus and neonate, with this number decreasing after birth and remaining low during childhood. Serum prolactin levels increased from midgestation toward term and markedly decreased after birth.20 Perlman et al21 investigated the differences of serum prolactin levels between preterm and term infants weeks before and after term (week 0) and found that the postnatal prolactin level depends on the gestational age, and serum prolactin values are lower in preterm infants than in term infants until the corrected age of 4 weeks after term. These reports suggest that estrogen produced by the placenta during pregnancy causes hyperplasia of prolactin cells in the anterior pituitary for fetuses, neonates, and pregnant women. The significant negative correlation between the relative signal intensity of the anterior pituitary gland and that of the pons and the postnatal time rather than gestational age at birth in the current study suggest that removal from the effect of placental estrogen has caused decline of the signal intensity of the anterior pituitary gland.
The present study revealed weak but statistically significant negative correlations between pituitary gland height and postnatal time. This is consistent with the report by Dietrich et al3 that there was a gradual decrease in pituitary height with age through the first 2 years of life, including the neonatal period. Estrogen produced by the placenta might be responsible for hyperplasia of prolactin cells and, therefore, pituitary enlargement during pregnancy; in other words: the longer without the estrogen, the smaller the gland.
The neonates in our present study received some treatments that have a possible influence on inhibition of prolactin secretion, such as dopamine infusion, in the early period of life. Seri et al22 studied serum prolactin concentrations before, during, and after dopamine infusion in 19 preterm infants during 3 days and revealed that dopamine therapy resulted in a decrease in mean serum prolactin concentration with a return to the pretreatment level at 2-6 hours after the discontinuation of drug administration. In the present study, the time interval from the termination of dopamine infusion to the MR examination was at least 37 days. Therefore, in the present study, the influence of dopamine infusion is probably negligible at near term of corrected age.
There are several limitations in this study. No histologic specimens of the pituitary gland were obtained in this study. The relationship between T1-signal intensity and histology of the anterior pituitary, thus, remains unknown. In addition, because of practical and ethical limitations, MR imaging could not be performed in the preterm period. The current investigation, therefore, did not reveal signal intensity changes of the anterior pituitary gland in preterm infants during the preterm period. Further investigations by hormonal and MR studies of fetuses and infants before and after term may reveal the longitudinal changes in the anterior gland or the changes due to a possible influence of perinatal treatments on prolactin release. We performed the MR examinations at almost term-equivalent age; however, more reliable data could have been acquired if we had performed the MR examinations on the exact same corrected age. Furthermore, neither coronal nor 3D imaging was performed, because the current study was retrospective, so volume of the pituitary gland could not be measured. T1-relaxation time could not be measured, because this is a retrospective analysis of the images. More ideally, T1-relaxation time of not only the anterior pituitary but also a vial of fluid placed beside the head instead of the pons could be measured in future studies.
Conclusion
In conclusion, the current study revealed a significant negative correlation between postnatal time and signal intensity on T1-weighted MR images of the anterior pituitary near term of corrected age. Nonhyperintense anterior pituitary is a normal MR finding in preterm neonates when imaged near term.
Footnotes
E.K. and Y.M. contributed equally to this study.
References
- 1.Wolpert SM, Osborne M, Anderson M, et al. The bright pituitary gland–a normal MR appearance in infancy. AJNR Am J Neuroradiol 1988;9:1–3 [PMC free article] [PubMed] [Google Scholar]
- 2.Cox TD, Elster AD. Normal pituitary gland: changes in shape, size, and signal intensity during the 1st year of life at MR imaging. Radiology 1991;179:721–24 [DOI] [PubMed] [Google Scholar]
- 3.Dietrich RB, Lis LE, Greensite FS, et al. Normal MR appearance of the pituitary gland in the first 2 years of life. AJNR Am J Neuroradiol 1995;16:1413–19 [PMC free article] [PubMed] [Google Scholar]
- 4.Argyropoulou MI, Xydis V, Kiortsis DN, et al. Pituitary gland signal in pre-term infants during the first year of life: an MRI study. Neuroradiology 2004;46:1031–35 [DOI] [PubMed] [Google Scholar]
- 5.Kiortsis D, Xydis V, Drougia AG, et al. The height of the pituitary in preterm infants during the first 2 years of life: an MRI study. Neuroradiology 2004;46:224–26 [DOI] [PubMed] [Google Scholar]
- 6.Castillo M. Pituitary gland: development, normal appearances, and magnetic resonance imaging protocols. Top Magn Reson Imaging 2005;16:259–68 [DOI] [PubMed] [Google Scholar]
- 7.Asa SL, Kovacs K, Laszlo FA, et al. Human fetal adenohypophysis. Histologic and immunocytochemical analysis. Neuroendocrinology 1986;43:308–16 [DOI] [PubMed] [Google Scholar]
- 8.Horvath E, Kovacs K. Fine structural cytology of the adenohypophysis in rat and man. J Electron Microsc Tech 1988;8:401–32 [DOI] [PubMed] [Google Scholar]
- 9.Horvath E, Kovacs K, Scheithauer BW. Pituitary hyperplasia. Pituitary 1999;1:169–79 [DOI] [PubMed] [Google Scholar]
- 10.van Nesselrooij JH, Szeverenyi NM, Ritter-Hrncirik C, et al. Rat pituitary changes observed with magnetic resonance imaging following removal of estrogen stimulus: correlation with histopathology and immunohistology. Carcinogenesis 1992;13:277–82 [DOI] [PubMed] [Google Scholar]
- 11.Kovacs K, Horvath E. Cytology. Tumors of the Pituitary Gland, 2nd ed. Washington, DC: Armed Forces Institute of Pathology;1983. :16–50
- 12.Sarda IR, Gorwill RH. Hormonal studies in pregnancy. I. Total unconjugated estrogens in maternal peripheral vein, cord vein, and cord artery serum at delivery Am J Obstet Gynecol 1976;124:234–38 [PubMed] [Google Scholar]
- 13.Younes MA, Besch NF, Besch PK. Estradiol and progesterone binding in human term placental cytosol. Am J Obstet Gynecol 1981;141:170–74 [DOI] [PubMed] [Google Scholar]
- 14.Taketomi A, Sato N, Aoki J, et al. The effects of frequency-encoding gradient upon detectability of the margins and height measurements of normal adult pituitary glands. Neuroradiology 2004;46:60–64 [DOI] [PubMed] [Google Scholar]
- 15.Barkovich AJ, Kjos BO, Jackson DE Jr, et al. Normal maturation of the neonatal and infant brain: MR imaging at 1.5 T. Radiology 1988;166:173–80 [DOI] [PubMed] [Google Scholar]
- 16.Miki Y, Asato R, Okumura R, et al. Anterior pituitary gland in pregnancy: hyperintensity at MR. Radiology 1993;187:229–31 [DOI] [PubMed] [Google Scholar]
- 17.Asa SL, Penz G, Kovacs K, et al. Prolactin cells in the human pituitary. A quantitative immunocytochemical analysis. Arch Pathol Lab Med 1982;106:360–63 [PubMed] [Google Scholar]
- 18.Scheithauer BW, Sano T, Kovacs KT, et al. The pituitary gland in pregnancy: a clinicopathologic and immunohistochemical study of 69 cases. Mayo Clin Proc 1990;65:461–74 [DOI] [PubMed] [Google Scholar]
- 19.Winter JS. Hypothalamic–pituitary function in the fetus and infant. Clin Endocrinol Metab 1982;11:41–55 [DOI] [PubMed] [Google Scholar]
- 20.Fukaya T, Furuhashi N, Shinkawa O, et al. The human fetal prolactin and estradiol levels, and their correlationship. Tohoku J Exp Med 1984;143:87–92 [DOI] [PubMed] [Google Scholar]
- 21.Perlman M, Schenker J, Glassman M, et al. Prolonged hyperprolactinemia in preterm infants. J Clin Endocrinol Metab 1978;47:894–97 [DOI] [PubMed] [Google Scholar]
- 22.Seri I, Somogyvari Z, Hovanyovszky S, et al. Developmental regulation of the inhibitory effect of dopamine on prolactin release in the preterm neonate. Biol Neonate 1998;73:137–44 [DOI] [PubMed] [Google Scholar]


