
Figure 2. Spontaneously active DRG neurons.
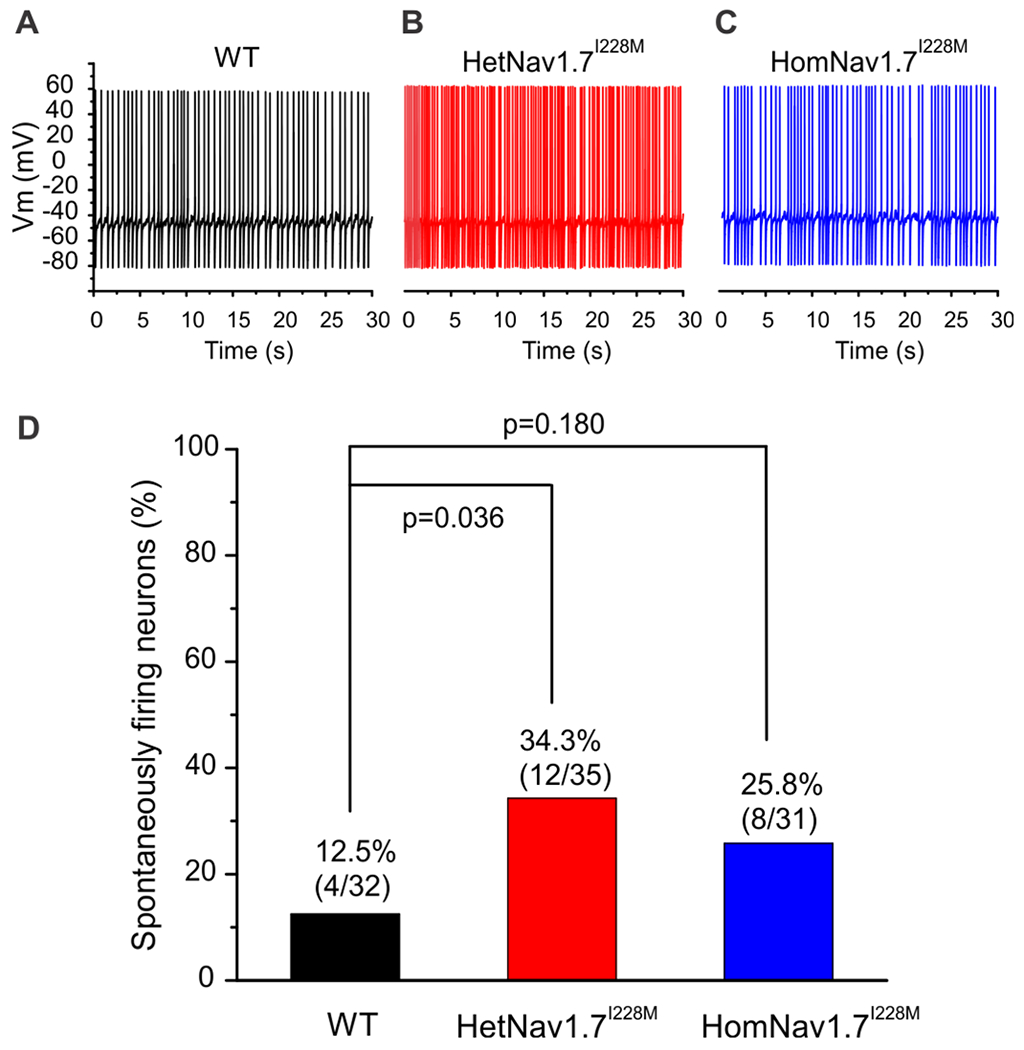
Representative recordings showing spontaneous firing (30 s) of DRG neuron from WT (A), HetNav1.7I228M (B) and HomNav1.7I228M (C) mice, respectively. Trace was recorded for 30 s without current injection. (D) Comparison of the proportion of spontaneously firing DRG neurons among WT, HetNav1.7I228M and HomNav1.7I228M groups. Compared with WT group, HetNav1.7I228M and HomNav1.7I228M groups displayed increased proportion of spontaneously firing neurons, but reached statistical significance only for the HetNav1.7I228M group (2-proportions z test was used to compare the proportion of spontaneously firing neurons).