Summary
Down‐regulated miR‐223‐3p was found in rheumatoid arthritis. This study aimed to further explore the level and role of miR‐223‐3p in gout arthritis (GA). After monosodium urate (MSU)‐induced GA rat and fibroblast‐like synoviocytes (FLSs) models were established, the rat paw volume and gait score were documented and the FLSs were transfected with miR‐223‐3p mimic/inhibitor or NLR family pyrin domain containing 3 (NLRP3) over‐expression plasmids. The MiR‐223‐3p target was found through bioinformatics and the dual‐luciferase reporter. The rat joint pathological damage was observed by hematoxylin and eosin staining. The levels of interleukin (IL)‐1β, tumor necrosis factor (TNF)‐α and articular elastase in rats were detected by enzyme‐linked immunosorbent assay (ELISA). The viability and pyroptosis of FLSs were detected by methyl thiazolyl tetrazolium (MTT) and flow cytometry. The expressions of miR‐223‐3p, NLRP3, cleaved caspase‐1, IL‐1β, apoptosis‐associated speck‐like protein (AS) and cleaved N‐terminal gasdermin D (GSDMD) in FLSs or rat synovial tissues were detected by reverse transcription–quantitative polymerase chain reaction (RT‐qPCR), immunofluorescence, Western blot or immunohistochemistry analysis. MSU increased the paw volume, gait score, inflammation in synovial tissues and increased the levels of IL‐1β, TNF‐α and articular elastase in rats. MSU decreased the viability and increased the pyroptosis of FLSs, up‐regulated the expression of NLRP3, ASC, cleaved caspase‐1, cleaved N‐terminal GSDM, and IL‐1β, and down‐regulated miR‐223‐3p expression in synovial tissues of rat joints and FLSs. MiR‐223‐3p mimic reversed the effect of MSU on lowering cell viability, increasing pyroptosis in FLSs, while miR‐223‐3p inhibitor further enhanced the effect of MSU on FLSs. NLRP3 was a target of miR‐223‐3p. Also, NLRP3 over‐expression reversed the effects of miR‐223‐3p on MSU‐induced FLSs. MiR‐223‐3p inhibited pyroptosis in MSU‐induced rats and FLSs by targeting NLRP3.
Keywords: gout arthritis, inflammation, miR‐223‐3p, NLRP3, pyroptosis
Monosodium urate (MSU)‐induced GA rat and fibroblast‐like synoviocytes (FLSs) model were established. MSU decreased the viability and increased the pyroptosis of FLSs. MiR‐223‐3p mimic reversed the effect of MSU, while NLRP3 overexpression reversed the effects of miR‐223‐3p on MSU‐induced FLSs. MiR‐223‐3p inhibited pyroptosis in MSU‐induced rats and FLSs by targeting NLRP3.
Introduction
Gout arthritis (GA) is an inflammatory reaction caused by the deposition of monosodium urate (MSU) in the joints and surrounding tissues and results from hyperuricemia [1, 2]. The clinical manifestations of GA are redness, swelling, heat, pain and dysfunction of the joints and surrounding tissues [3]. Without proper treatment, acute GA can progress to chronic GA or cause deformity or physical disability [3, 4]. The common co‐morbidities related to GA are obesity, diabetes, hypertension, hyperlipidemia and chronic kidney disease [5]. The current treatment strategy for GA is to relieve pain, control diet and limit purine intake [5]. At present, the pain caused by GA can only be relieved by colchicine, non‐steroidal anti‐inflammatory drugs and corticosteroids [6]. However, these drugs have serious side effects, and long‐term use can cause serious adverse reactions such as gastrointestinal adverse reactions, chronic renal insufficiency, restlessness and immunosuppression [5, 6, 7]. Therefore, finding a safe and effective treatment is the key to treating GA.
Studies have validated that the uptake of MSU crystals by mononuclear phagocytes triggers the activation of the NLR family pyrin domain containing 3 (NLRP3) inflammasome [8, 9]. Activated NLRP3 recruits and activates the precursor of caspase‐1 and further induces the production of interleukin (IL)‐1β, a key factor in inflammation [8, 10]. Subsequently, the activation of neutrophils is stimulated and proinflammatory cytokines, such as tumor necrosis factor (TNF)‐α and inflammatory chemokines, are generated, further resulting in the accumulation of mononuclear phagocytes, neutrophils and other inflammatory cells at the site of inflammation, eventually triggering the cascade of inflammation [11, 12]. Therefore, NLRP3 plays a key role in the process of GA, and exploring the deeper mechanism of modulating NLRP3 in GA may be of great significance to the treatment of GA.
It was widely reported that NLRP3 could be regulated by miR‐223‐3p in different physiological and pathological processes. For example, miR‐223‐3p could target NLRP3 to regulate cartilage degeneration [13]; in addition, NLRP3 inflammasome inactivation was induced by miR‐223‐3p in breast cancer to inhibit the tumor growth and enhance the anti‐cancer immunity [14]; miR‐223‐3p was also found to have a regulatory effect on the expression of NLRP3 in human immune cells [15]. Down‐regulated miR‐223‐3p was also discovered in rheumatoid arthritis, and miR‐223‐3p was reported to be a biomarker for early rheumatoid arthritis [16]. However, few studies have been conducted on the level of miR‐223‐3p in GA, and whether NLRP3 could be regulated by miR‐223‐3p in GA is also yet to be investigated.
Based on these findings, the current study attempted to explore the level of miR‐223‐3p in GA and further investigate whether there is a regulatory relationship between miR‐223‐3p and NLRP3.
Methods
Rats
Twenty male Wistar rats (age = 7 weeks, weight = 200 ± 20 g) were obtained from ALF Biotechnology (Jiangsu, China; http://www.jsalfei.com/). All the rats were raised in a SPF room in a 12‐h light/12‐h dark environment with free access to food and water. Before experiment, the rats were acclimatized for 7 days.
Preparation of MSU crystals
MSU crystals were prepared as described in previous study [17]. In brief, 5 g of uric acid (U820317; Macklin, Shanghai, China) was dissolved in 1 liter of boiling water. After the uric acid solution was cooled to near room temperature, 0·1 mmol/l NaOH solution (S8045; Sigma‐Aldrich, MO, USA, https://www.sigmaaldrich.com) was used to adjust the pH value of the solution to 7.4. After heating and boiling, the solution was stirred and cooled (a small number of crystals were precipitated). The uric acid solution was then placed in a refrigerator at 4°C for 1 h. After the solution was filtered and dried, the coarsed‐MSU crystal was obtained. The coarsed‐MSU crystal was completely dissolved in 155 ml of normal saline (S0817; Sigma‐Aldrich) under aseptic conditions. After the pH value was adjusted to 7.0 with 1 mol/l HCl (H1758; Sigma‐Aldrich), the MSU solution was centrifuged immediately at 4000 g for 2 min. The supernatant was collected and the solution was centrifuged repeatedly until no crystal precipitate was generated. The supernatant was further centrifuged after being cooled at 4°C for 1 h, and the final MSU crystal was collected and stored at 4°C. The final MSU crystal was dissolved in phosphate‐buffered saline (PBS) (R30231; Yuanye, Shanghai, China) at a dose of 20 mg/ml for further use.
Establishment of the GA model
The rats were randomly divided into three groups: the control (n = 6), sham group (n = 6) and MSU groups (n = 6). For the MSU group, after the rats were anesthetized by intraperitoneal injection of sodium pentobarbital (50 mg/kg, B005; Jiancheng Bioengineering Institute, Nanjing, China, http://www.njjcbio.com/), 50 μl of MSU (20 mg/ml) were injected into the left ankle joint cavity of the rats. For the sham group, the rats only received intraperitoneal injection of normal saline (10 ml/kg). For the control group, the left ankle joint cavity of the rats was injected with 50 μl of normal saline after the rats were anesthetized by intraperitoneal injection of sodium pentobarbital. After injection of MSU or normal saline for 0, 6, 12 and 24 h, the left paw volume and gait score were measured. After injection of MSU or normal saline for 24 h, the rats were anesthetized with sodium pentobarbital (50 mg/kg), and the rat blood was collected for enzyme‐linked immunosorbent assay (ELISA) analysis. Subsequently, the rats were euthanized by cervical dislocation, and the ankle joint tissues of the rats were collected for hematoxylin and eosin staining, immunohistochemistry analysis, reverse transcription–quantitative polymerase chain reaction (RT–qPCR) and Western blot.
Measurement of paw volume
After injection of MSU or normal saline for 0, 6, 12 and 24 h, the volume of the rat left hind paws was measured using the PBC7140 plethysmometer (Ugo Basile, Gemonio, Italy).
Measurement of gait score
After injection of MSU or normal saline for 24 h, the rat behavior was assessed using the gait score [17] by three observers who had not known about the experimental program. The gait score was graded on a four‐point (0–3) scale: zero points represent that the gait of rats was normal; one point represents that the gait of rats was slightly limp and over‐flexion of the left hind limb was visible; two points represent that the gait of rats was moderately limp and the left hind paw only briefly touched the floor; three points represent that the gait of rats was severely limp, and a three‐legged gait was observed [18]. The final score of the rats was determined by the averaging the scores of the three observers.
Hematoxylin and eosin staining
The first step was to prepare paraffin sections of ankle joint tissues. In brief, the tissues was fixed with 4% paraformaldehyde (R008069; Rhawn, Shanghai, China), dehydrated with gradient ethanol (E809057; Macklin), transparentized with xylene (R017750; Rhawn) and then embedded in paraffin (327204; Sigma‐Aldrich). Finally, the paraffin‐embedded tissues were cut into approximately 3–5‐μm‐thick sections using a paraffin section machine (KD‐2508; Cossim, Beijing, China).
The last step was to stain the tissue slices. In brief, the tissue slices were deparaffinized with xylene, dehydrated with gradient ethanol and stained with hematoxylin (B25380; Yuanye) for 5 min. After washing for 5 s with tap water, the tissue slices were differentiated with 1% hydrochloric acid alcohol (AR0038; Boster, Wuhan, China) for 1–3 s and further stained with 0·5% eosin (E4009; Sigma‐Aldrich) for 2 min. After dehydration with gradient ethanol, the tissue slices were transparentized with xylene again and further sealed with neutral gum (D054‐1‐1; Jiancheng Bioengineering Institute). Finally, the images of the tissue slices were documented under a microscope (DMLA, Leica, Solms, Germany).
ELISA
The levels of IL‐1β, TNF‐α and articular elastase in serum of the rats were analyzed by ELISA using ELISA kits for IL‐1β (ml037361), TNF‐α (ml002859) and articular elastase (ml059396), which were purchased from Enzyme‐linked Biotechnology (Shanghai, China). In brief, 50 μl of serum and standard samples were added to the wells. Then 50 µl of biotin‐labeled antibody was placed into the wells and incubated for 1 h at 37˚C in the dark. Affinity chain enzyme horseradish peroxidase (HRP) (80 μl) was further added to each well and incubated at 37˚C for 30 min. Next, solution I (50 µl) and solution II (50 µl) were successively added to the wells for 20 min incubation. After stop buffer (50 µl) was finally added to the wells, the absorbance of the samples was measured using a microplate reader (Imark; Bio‐Rad, Hercules, CA, USA) at 450 nm.
Immunohistochemistry analysis
First, paraffin sections of ankle joint tissues were prepared. In brief, the tissues was fixed with 4% paraformaldehyde, dehydrated with gradient ethanol, transparentized with xylene and then paraffin‐embedded. Next, the embedded tissues were cut into approximately 3–5‐μm‐thick sections using the paraffin section machine. The prepared tissue slices were then repaired with citrate antigen repair solution (AR0024; Boster) via heating in a microwave oven for 6 min; the tissues were incubated with primary antibodies NLRP3 (1 : 500, ab214185; abcam, Cambridge, MA, USA), cleaved caspase‐1 (1 : 100, 4199; Cell Signaling Technology, Danvers, MA, USA) and IL‐1β (1 : 250, ab2105; abcam) overnight at 4°C. The next day, the tissue slices were incubated with goat‐anti‐rabbit IgG (1 : 20000, ab205718; abcam) for 1 h. The tissue slices were further stained with the dolichos biflorus agglutinin (DBA) reagent (SFQ004; 4A Biotech, Beijing, China) for 25 min and hematoxylin for 4 min. After dehydration with gradient ethanol, the tissue slices were transparentized with xylene again and further sealed with neutral gum. Finally, the images of the tissue slices were documented under the microscope (DMLA; Leica, Solms, Germany) at a magnification of ×200.
Isolation and culture of rat fibroblast‐like synoviocytes (FLSs)
FLSs were isolated from synovium tissues of the ankle joint of two healthy rats. In brief, all synovium tissues were chopped and incubated in 0·25% ethylenediamine tetraacetic acid (EDTA)‐trypsin (25200056; gibco, Carlsbad, CA, USA) containing 10% fetal bovine serum (FBS) (16140071; gibco) and 7·5% sodium bicarbonate (037163; Thermo Fisher, Waltham, MA, USA) for 20 min. The solution containing synovium tissues was immediately added into Dulbecco’s modified Eagle’s medium (DMEM) medium (11965092; gibco) containing 25% FBS in a sterile culture dish. After monolayer cells formed in the culture dish and cell confluence reached 70%, the medium was replaced by DMEM medium containing 10% FBS (complete medium) and the cells were further cultured in a humidified atmosphere at 37°C with 5% CO2.
MSU treatment of FLSs
The isolated FLSs were administered with MSU alone or additionally transfected with miRNA mimic, miRNA inhibitor or plasmids. For the former situation, the FLSs were separately incubated with 60, 75, 80 and 100 μg/ml MSU for 24 h for use in subsequent experiments. For the latter situation, the cells were first transfected with miRNA mimic, miRNA inhibitor or plasmids, then incubated with 75 μg/ml MSU for 24 h for further analysis.
Transfection
MiR‐223‐3p mimic (5′‐UGUCAGUUUGUCAAAUACCCCA‐3′), miR‐223‐3p inhibitor (5′‐UGGGGUAUUUGACAAACUGACA‐3′) and miRNA scramble, which was used as a negative control (siG141112151635‐1‐5), were synthesized by Ribobio (Guangzhou, China). Plasmids over‐expressing NLRP3 were synthesized by GenePharma (Shanghai, China) and ligated into the pcDNA3.1 vector. The primer used to obtain the sequences of the NLRP3 over‐expressing plasmid was as follows: forward: 5′‐CTCACCTCACACTCCTGCTG‐3′, reverse: 5′‐AGAACCTCACAGAGCGTCAC‐3′; Plasmids without any target sequence were used as negative control (NC).
Before transfection, 2 ml of complete medium with 1·0 × 106 FLSs were placed into each well of a six‐well plate. After the cell confluence reached approximately 70%, the complete medium in each well was replaced by 1·8 ml of basic medium without FBS. Then 2 μg of mimic, inhibitor or plasmids were separately diluted with 100 μl of Opti‐MEM (31985070; Gibco); 2 μl of lipo 3000 (BMB1385, Bomei Biotechnology, Hefei, China) was also diluted with 100 μl of Opti‐MEM. The diluted mimic, inhibitor or plasmids and the diluted lipo 3000 were mixed thoroughly. After incubation for 10 min, the mixed solution was finally added to each well and the cells were further cultured for 48 h.
Dual‐luciferase reporter assay
The sequence of NLRP3 wild‐type (NLRP3‐WT), which contained the binding site for miR‐223‐3p (5′‐CGCTATCTTTCTATTAACTGACC‐3′), and the sequence of NLRP3 mutant (NLRP3‐MUT; 5′‐CGCTATCTTTCTATTGGAGTCTC‐3′) were separately cloned into the pGL3‐basic vectors (60908‐3961y), which were purchased from Tiandz (Beijing, China). Then, 300 μl of complete medium with 3·0 × 104 cells were placed into each well of a 48‐well plate. After the cell confluence reached approximately 70%, the complete medium in each well was replaced by 1·8 ml of basic medium without FBS. The NLRP3‐WT‐pGL3‐basic vectors and NLRP3‐MUT‐basic vectors with miR‐223‐3p mimic or mimic control (MC; miR1N0000001‐1‐5; Ribbio) were separately transfected into the cells using lipo 3000. After transfection, the cells were lysed and treated using the luciferase reporter assays substrate kit (ab228530; abcam), and further placed under the SpectraMax reader (Molecular Devices, Shanghai, China) for the detection of luciferase activity.
Immunofluorescence
After administration of MSU or transfection, FLSs were collected and fixed with paraformaldehyde (P804537; Macklin) and permeabilized with 0·5% Triton X‐100 (T8787; Merck, Kenilworth, NJ, USA). The cells were incubated with 10 μg/ml NLPR3 antibody (ab4207; abcam) overnight at 4°C. The second day, after washing with PBS, the cells were further incubated with Alexa Fluor 488 donkey anti‐goat IgG (1 : 500, ab150129; abcam) for 1 h. Finally, the cells were counterstained with 4′,6‐diamidino‐2‐phenylindole (DAPI) (D9542; Merck) and the images of the cells were observed and documented using a BSF‐40 fluorescence microscope (Batuo Instrument, Shanghai, China).
Methyl thiazolyl tetrazolium (MTT) assays
After administration of MSU or transfection, FLSs were collected and adjusted to a concentration of 1·0 × 105 cells/ml and 100 μl of FLSs were placed into each well of a 96‐well plate and cultured for 24 h. The medium in each well was replaced by 100 μl of PBS containing 0·5 mg/ml MTT (88417; Merck). After the cells were further incubated with the MTT solution for 4 h, the MTT solution was removed and replaced by 100 μl of dimethylsulfoxide (DMSO) (D2650; Merck). Finally, the absorbance of the solution in each well was measured using a microplate reader (Imark; Bio‐Rad) at 572 nm.
Flow cytometry
Cell pyroptosis was detected by flow cytometry using a FAM‐FLICA caspase‐1 assay kit (#98; ImmunoChemistry, Bloomington, MN, USA), which mainly contained the caspase‐1‐FLICA reagent and propidium iodide (PI). In brief, after administration of MSU or transfection, 1.0 × 10⁶ FLSs in 100 μl of complete medium were collected and added to 10 μl of caspase‐1‐FLICA reagent for 15 min. The cells were further incubated with 100 μl of complete medium containing PI (2 μg/ml) for 25 min in the dark. Finally, the fluorescence intensity in the cells was assessed using a FACSCalibur II flow cytometer and the CellQuest software (BD Biosciences, San Jose, CA, USA).
RNA extraction and RT–qPCR
MiRNAs were extracted from the rat ankle joint tissues and FLSs using an isolation regent kit (DP501; Tiangen, Beijing, China) and were used to analyze the expression of miR‐223‐3p. Total RNAs were extracted from FLSs using TRIzol (15596; Invitrogen, Carlsbad, MA, USA) and were used for the expression analyses of a series of mRNAs. The extracted RNAs were reverse‐transcribed into cDNAs using a cDNA synthesis kit (AE301‐02), which was purchased from TransGen (Shanghai, China). The amplification reaction was conducted using an amplification kit (AQ601‐01; TransGen) which contained RT–qPCR supermix. In brief, 1 μl of cDNA and 2 μl of primers of targeted genes (Table 1) were diluted with 2 μl of RNase‐free H2O (RF001) obtained from Real‐Times (Beijing, China). Then the diluted cDNA and primers were further mixed with 5 μl of RT–qPCR supermix for amplification. The condition of amplification was as follows: 94°C for 30 s, 94°C for 30 s for 40 cycles and 60°C for 30 s for 40 cycles. The process of amplification was documented under the Q6 system (Applied Biosystems, Waltham, MA, USA) and the RNA expression level was quantified using the 2–△△CT method.
Table 1.
RT–qPCR primers
| Target gene | Forward primers, 5′–3′ | Reverse primers, 5′–3′ |
|---|---|---|
| miR‐223‐3p | CCCGTCGTATCCAGTGCAAT | GTCGTATCCAGTGCGTGTCG |
| NLRP3 | TCTGTGTGGACCTAAGCCCC | GGGATACAGCCTTTCTCGGG |
| ASC | GACAGTGCAACTGCGAGAAG | CGACTCCAGATAGTAGCTGACAA |
| IL‐1β | ACCTGGGCTGTCCTGATGAGAG | TGTTGATGTGCTGCTGCGAGAT |
| β‐actin | GTGACGTTGACATCCGTAAAGA | GCCGGACTCATCGTACTCC |
| U6 | GACCTCTATGCCAACACAGT | AGTACTTGCGCTCAGGAGGA |
RT–qPCR = reverse transcription–quantitative polymerase chain reaction.
Western blot assay
Total protein was extracted from the rat ankle joint tissues and FLSs for the analysis of some target protein. After the tissues and cells were lysed with NP‐40 (N8031; Solarbio, Beijing, China), the total protein was collected and its concentration was determined using a QuantiPro BCA kit (QPBCA; Merck). Then, 30 µg of the total protein and 4 µl of marker (PR1910; Solarbio) were separated by electrophoresis using a tricine–sodium dodecyl sulfate–polyacrylamide gel electrophoresis (SDS‐PAGE) gel kit (CW2384; CWBIO, Beijing, China) and subsequently transferred to 0·22 μm NC membranes (W015‐2; Jiancheng‐Bio, Nanjing, China). After blocking with 5% non‐fat milk, the membranes were incubated with the following relative primary antibodies at 4°C for 16 h: ASC (1 : 2000, 50 kDa, ab188865; abcam), NLRP3 (1 : 1000, 118 kDa, ab263899; abcam), cleaved caspase‐1 (1 : 1000, 20 kD, 4199; Cell Signaling Technology), cleaved N‐terminal GSDMD (1 : 1000, 31 kDa, ab215203; abcam), IL‐1β (1 : 1000, 31 kDa, ab9722; abcam) and β‐actin (1 : 3000, 42 kDa, ab8226; abcam). After 2 h incubation with rabbit secondary antibody (1 : 10000, ab205718; abcam) or mouse secondary antibody (1 : 10000, ab205719; abcam), the membranes were further covered with 200 μl of detection solution (P0019; Beyotime, Shanghai, Chian). Finally, the signal image was detected and analyzed using the Image Lab version 3.0 Software (Bio‐Rad).
Statistical analysis
All data were analyzed by one‐way analysis of variance (anova) using spss version 20.0 software. Least squares difference (LSD) and Dunnet’s t‐test were applied as post‐hoc tests. Statistical data are presented as mean ± standard deviation (s.d.). P < 0·05 indicates that the data were statistically significant.
Results
Paw volume, gait score and the damage of synovial tissue were increased in MSU‐induced GA rats
After establishing the MSU‐induced GA rat model, we first measured the paw volume of the rats to evaluate the limb swelling extent (Fig. 1a,b), and the data show that MSU treatment significantly increased the paw volume compared with the sham group (P < 0·001), which indicated that MSU treatment induced limb swelling in rats. We documented the gait score of the rats to evaluate joint dysfunction (Fig. 1c), and found that the gait score in the MSU group was higher than that in the sham group (P < 0·001), which indicated that MSU treatment induced joint dysfunction in rats. We further observed the pathological damage of rat joint by hematoxylin and eosin staining (Fig. 1d). The staining images in the control and sham groups show that the joint tissue was healthy and normal, while in the MSU group, neutrophil and inflammatory infiltration, hyperemia, synovial hyperplasia and necrosis were found in the staining images of rat knee joint.
Fig. 1.
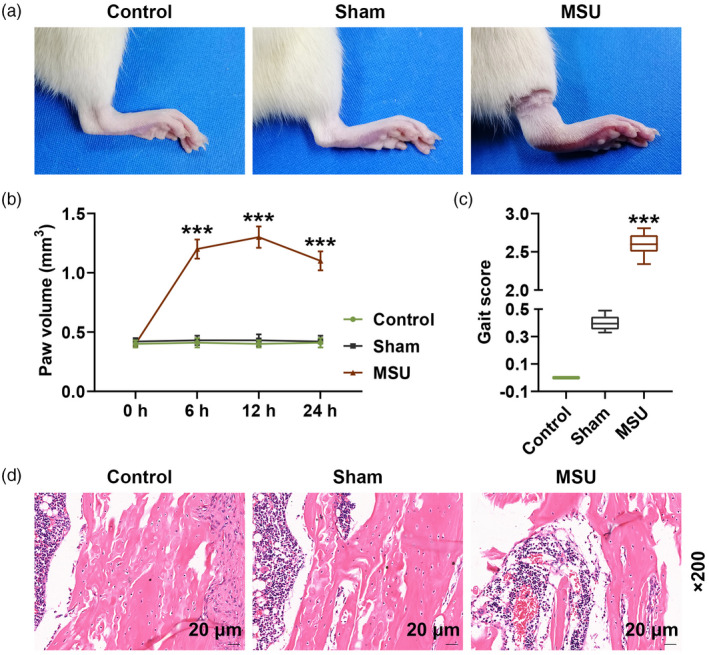
Paw volume, gait score and the damage of synovial tissue were increased in monosodium urate (MSU)‐induced gout arthritis (GA) rats after injection of MSU or normal saline for 24 h. (a) Pictures of rat paws are shown; (b) volume of rat paws was measured using a PBC7140 plethysmometer at 0, 6, 12 and 24 h; (c) gait score was documented by three observers; (d) pathological damage of rat joint was observed by hematoxylin and eosin staining (*** P < 0·001 versus sham).
Pyroptosis‐related factors, inflammation‐related factors and miR‐223‐3p were abnormally expressed in MSU‐induced GA rats
We further analyzed the secretion levels of IL‐1β, TNF‐α and articular elastase in the rat serum. The data show that the serum levels of IL‐1β, TNF‐α and articular elastase in the MSU group were clearly up‐regulated compared with those in the sham group (P < 0·001, Fig. 2a–c). Immunohistochemistry analysis and Western blot were also performed to further evaluate the expression of IL‐1β, NLRP3 and cleaved caspase‐1 in the rat joint tissues. The results demonstrate that the expression of these factors in the MSU group were still higher than those in the sham group (P < 0·001; Figs. 2d,3a,b,d,f). Similarly, the protein expressions of ASC and cleaved N‐terminal GSDMD in the rat joint tissues were increased in the MSU group compared to the sham group (P < 0·001; Fig. 3c,e). The expression of miR‐223‐3p was also detected, and we found that miR‐223‐3p expression was down‐regulated in MSU‐induced GA rats compared to that in the rats of the sham group (P < 0·001, Fig. 3g).
Fig. 2.
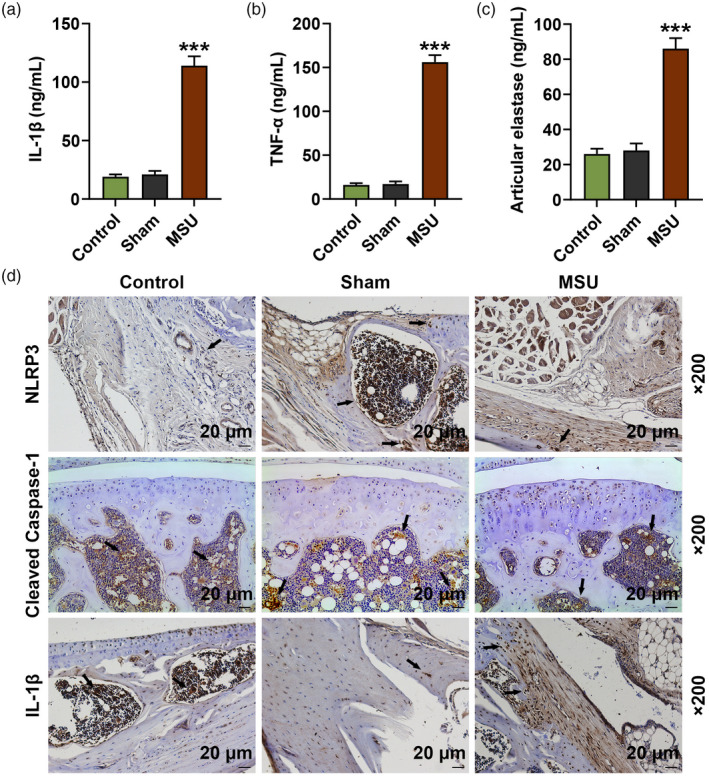
Inflammation‐related factors were abnormally expressed in monosodium urate (MSU)‐induced gout arthritis (GA) rats. After injection of MSU or normal saline for 24 h. (a–c) Secretion levels of interleukin (IL)‐1β, tumor necrosis factor (TNF)‐α and articular elastase in the serum of the rats were detected by enzyme‐linked immunosorbent assay (ELISA); (d) expression levels of IL‐1β, NLRP3 and cleaved caspase‐1 in the joint tissues of the rats were detected by immunohistochemistry analysis (*** P < 0·001 versus sham).
Fig. 3.
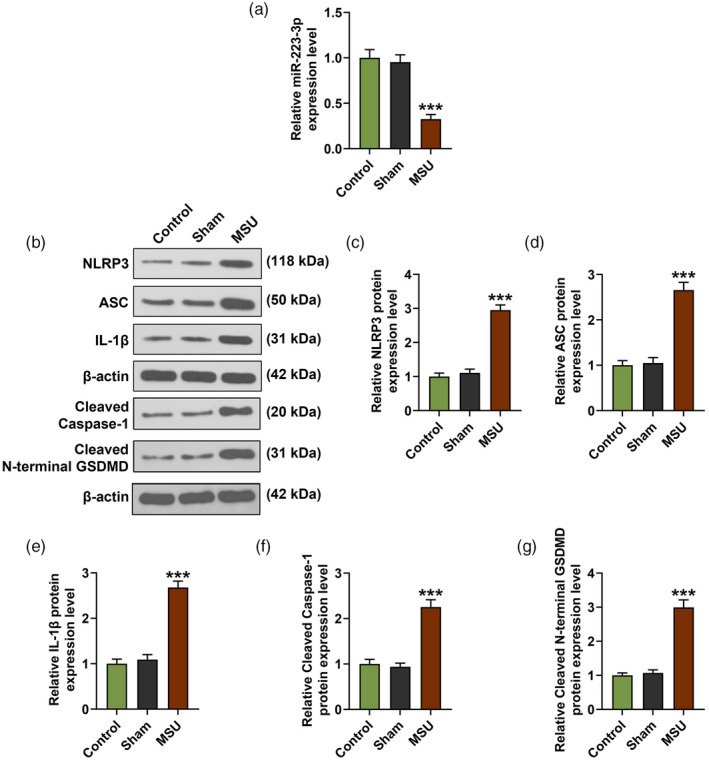
Pyroptosis‐related factors, inflammation‐related factors and miR‐223‐3p were abnormally expressed in monosodium urate (MSU)‐induced gout arthritis (GA) rats. (a–f) The expression levels of NLR family pyrin domain containing 3 (NLRP3), apoptosis‐associated speck‐like protein (ASC), cleaved caspase‐1, cleaved N‐terminal gasdermin D (GSDMD) and interleukin (IL)‐1β in the joint tissues of the rats were detected by Western blot; β‐actin was used as an internal control; (g) The expression of miR‐223‐3p in the serum of the rat joint tissues was detected by reverse transcription–quantitative polymerase chain reaction (RT–qPCR) (*** P < 0·001 versus sham).
MiR‐223‐3p regulated the viability, pyroptosis and the expression of miR‐223‐3p and NLRP3 in MSU‐induced FLSs
FLSs isolated from healthy rats were treated with different doses (60, 75, 80 and 100 μg/ml) of MSU. FLS viability and the expression of miR‐223‐3p in MSU‐induced FLSs were detected; we found that MSU decreased FLS viability and the expression of miR‐223‐3p in FLSs (Fig. 4a,b). In order to further verify the effect of miR‐223‐3p on GA, we transfected miR‐223‐3p mimic and inhibitor into the FLSs. As shown in Fig. 4c,d, after the cells were transfected with miR‐223‐3p mimic or inhibitor and simultaneously treated with 75 μg/ml MSU (MSU + M group and MSU + I groups), the decreased cell viability and miR‐223‐3p expression induced by MSU were reversed by miR‐223‐3p mimic (P < 0·05) and further decreased by miR‐223‐3p inhibitor (P < 0·05) compared to the MSU + scramble group. We also detected the pyroptosis of the cells (Fig. 4e), and found that MSU increased the relative pyroptosis rate of FLSs compared with the control group (P < 0·001), while in the MSU + M and the MSU + I groups the increased pyroptosis rate induced by MSU was reversed by miR‐223‐3p mimic (P < 0·01) and further increased by miR‐223‐3p inhibitor (P < 0·01) compared to the MSU + scramble group. Regarding the expression of NLRP3 (Fig. 4f), the results of immunofluorescence showed that MSU increased the expression of NLRP3 while in the MSU + M and MSU + I groups the increased NLRP3 expression induced by MSU was reversed by miR‐223‐3p mimic and further up‐regulated by miR‐223‐3p inhibitor.
Fig. 4.
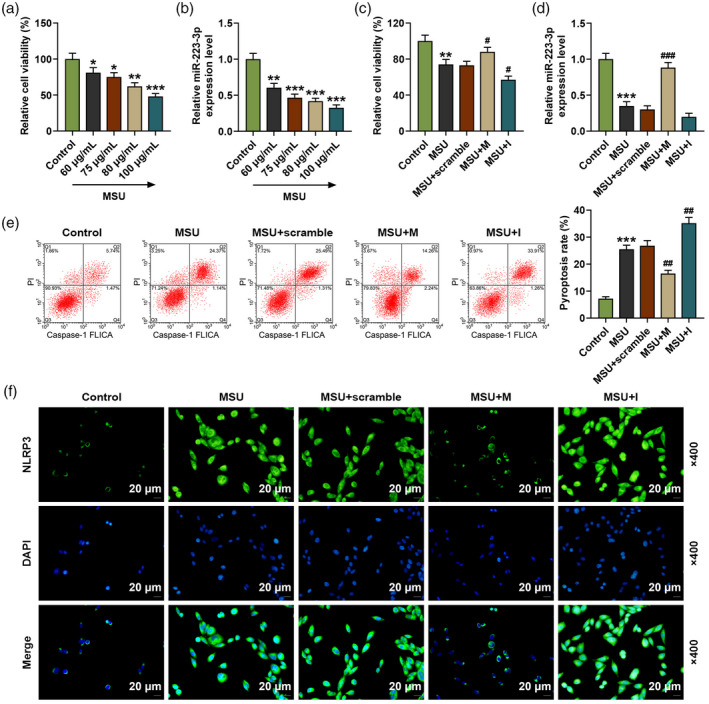
(a) The viability of the rat fibroblast‐like synoviocytes (FLSs) after treatment with different doses of monosodium urate (MSU) was detected by methyl thiazolyl tetrazolium (MTT); (b) the expression of miR‐223‐3p in the rat fibroblast‐like synoviocytes (FLSs) after treatment with different doses of MSU was detected by reverse transcription–quantitative polymerase chain reaction (RT–qPCR); U6 was used as an internal control; (c) the viability of the rat FLSs after treatment with MSU and transfection with miR‐223‐3p mimic or inhibitor was detected by MTT; (d) the expression of miR‐223‐3p in the rat FLSs after treatment with MSU and transfection with miR‐223‐3p mimic or inhibitor was detected by RT–qPCR; U6 was used as an internal control; (e) the pyroptosis of the rat FLSs after treatment with MSU and transfection with miR‐223‐3p mimic or inhibitor was detected by flow cytometry; (f) the expression of NLR family pyrin domain containing 3 (NLRP3) in the rat FLSs after treatment with MSU and transfection with miR‐223‐3p mimic or inhibitor was detected by immunofluorescence (* P < 0·05, ** P < 0·01, *** P < 0·001 versus control; # P < 0·05, ## P < 0·01 versus MSU + scramble). M: miR‐223‐3p mimic; I: miR‐223‐3p inhibitor.
MiR‐223‐3p regulated the expressions of NLRP3, ASC, caspase‐1, cleaved N‐terminal GSDMD and IL‐1β in MSU‐induced FLSs
We further detected the expression of NLRP3, ASC, cleaved caspase‐1, cleaved N‐terminal GSDMD and IL‐1β in FLSs. As shown in Fig. 5a–i, the mRNA and protein levels of NLRP3 and ASC in FLSs were up‐regulated by MSU compared to the control group (P < 0·001), while after the FLSs were transfected with miR‐223‐3p mimic and simultaneously treated with MSU (the MSU + M group), the up‐regulated expressions of NLRP3 and ASC induced by MSU were reversed by miR‐223‐3p mimic compared to the MSU + scramble group (P < 0·01). The mRNA and protein levels of cleaved caspase‐3, cleaved N‐terminal GSDMD and IL‐1β in FLSs (Fig. 5a,d–i) were also up‐regulated by MSU compared to the control group (P < 0·001), while after the FLSs were transfected with miR‐223‐3p mimic or inhibitor and simultaneously treated with MSU (MSU + M and MSU + I groups), the up‐regulated levels of these factors induced by MSU were reversed by miR‐223‐3p mimic and further increased by miR‐223‐3p inhibitor compared to the MSU + scramble group (P < 0·05).
Fig. 5.
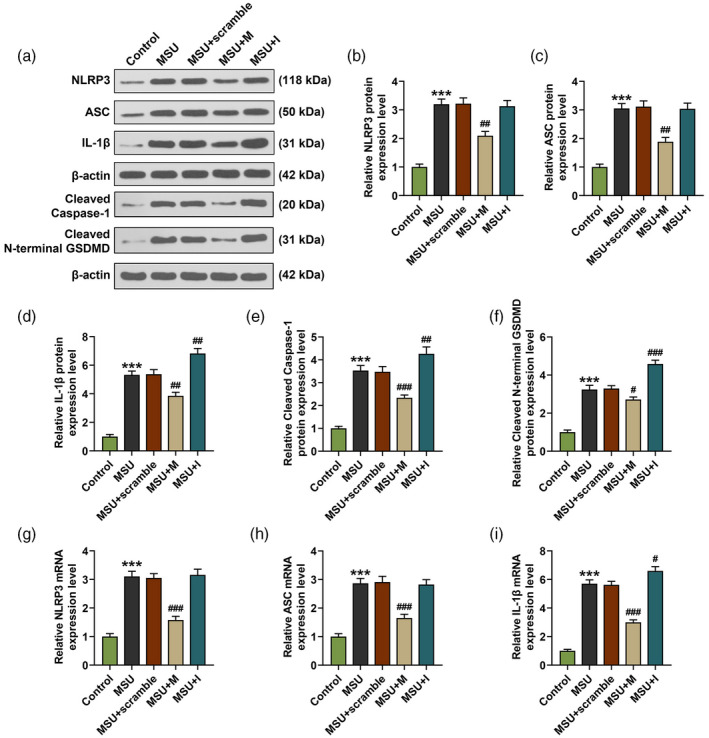
MiR‐223‐3p regulated the expressions of NLR family pyrin domain containing 3 (NLRP3), apoptosis‐associated speck‐like protein (ASC), cleaved caspase‐1, cleaved N‐terminal gasdermin D (GSDMD) and interleukin (IL)‐1β in monosodium urate (MSU)‐induced fibroblast‐like synoviocytes. (a–f) The expression of NLRP3, ASC, cleaved caspase‐1, cleaved N‐terminal GSDMD and IL‐1β in the rat FLSs after treatment with MSU and transfection with miR‐223‐3p mimic or inhibitor was detected by Western blot; β‐actin was used as an internal control; (g–k) the expression of NLRP3, ASC and IL‐1β in the rat FLSs after treatment with MSU and transfection with miR‐223‐3p mimic or inhibitor was detected by reverse transcription–quantitative polymerase chain reaction (RT–qPCR); β‐actin was used as an internal control (*** P < 0·001, versus control; # P < 0·05, ## P < 0·01, ### P < 0·001, versus MSU + scramble). M: miR‐223‐3p mimic; I: miR‐223‐3p inhibitor.
MiR‐223‐3p specially targeted NLRP3 in FLSs
We then predicted that NLRP3 was a target of miR‐223‐3p, noting that the sequence of NLRP3‐WT had the binding site for miR‐223‐3p (Fig. 6a). In order to further verify this prediction, a dual‐luciferase reporter assay was conducted. As shown in Fig. 6b, the relative luciferase activity of FLSs, which were transfected with NLRP3‐WT and miR‐223‐3p mimic, was significantly decreased compared with that in the cells transfected with NLRP3‐WT and mimic control (P < 0·001), while no difference was found in the relative luciferase activity in the FLSs which were transfected with NLRP3‐MUT and miR‐223‐3p mimic compared with that in the cells transfected with NLRP3‐MUT and mimic control. These results further confirmed that NLRP3 was targeted by miR‐223‐3p in FLSs.
Fig. 6.
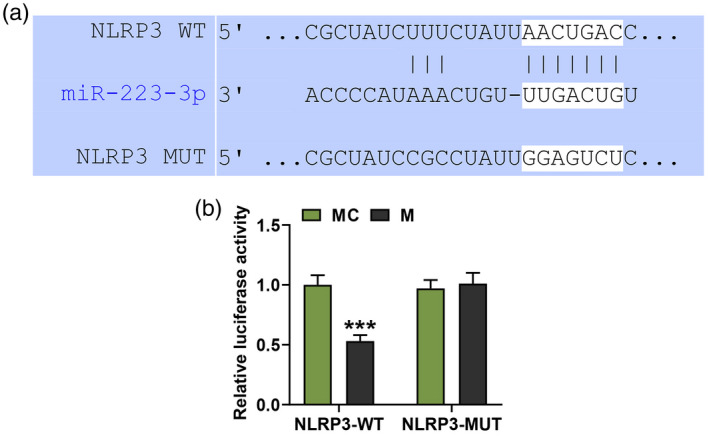
MiR‐223‐3p specially targeted NLR family pyrin domain containing 3 (NLRP3) in fibroblast‐like synoviocytes (FLSs). (a) The putative binding site between miR‐223‐3p and NLRP3 was predicted by TargetScan 7.2 (http://www.targetscan.org/vert_72/); (b) luciferase assay results validated that miR‐223‐3p targeted NLRP3 in fibroblast‐like synoviocytes (*** P < 0·001, versus MC). MC: mimic control.
NLRP3 over‐expression reversed the effect of miR‐223‐3p mimic on the viability, pyroptosis and expression of NLRP3, ASC, cleaved caspase‐1, cleaved N‐terminal GSDMD and IL‐1β in MSU‐induced FLSs
After over‐expressing NLRP3, we further detected the changes of NLRP3 expression, cell viability and pyroptosis in MSU‐induced FLSs. As shown in Fig. 7a,b, the expression of NLRP3 in the MSU + M group was decreased by the miR‐223‐3p mimic when compared with the MSU group (P < 0·001), while in the MSU + M + NLRP3 group the lowered NLRP3 expression induced by miR‐223‐3p mimic was reversed by NLRP3 over‐expression compared to the MSU + M + NC group (P < 0·01). Regarding cell viability (Fig. 7c), in the MSU + M group the cell viability was increased by miR‐223‐3p mimic when compared with the MSU group (P < 0·05), while in the MSU + M + NLRP3 group the enhanced cell viability induced by miR‐223‐3p mimic was reversed by NLRP3 over‐expression compared to the MSU + M + NC group (P < 0·05). Also, the pyroptosis rate in the MSU + M group was reduced by miR‐223‐3p mimic when compared with the MSU group (P < 0·001, Fig. 7d), while in the MSU + M + NLRP3 group the lowered pyroptosis rate induced by miR‐223‐3p mimic was reversed by NLRP3 over‐expression compared to the MSU + M + NC group (P < 0·01, Fig. 7d). Mechanically, we detected the transcription and translation levels of ASC, cleaved caspase‐1, cleaved N‐terminal GSDMD and IL‐1β in MSU‐induced FLSs. We found that in the MSU + M group, the transcription (Fig. 8f,g) and translation (Fig. 8a–e) levels of these factors were all decreased by miR‐223‐3p mimic when compared with the MSU group (P < 0·01), while in the MSU + M + NLRP3 group the lowered levels of these factors induced by miR‐223‐3p mimic was reversed by NLRP3 over‐expression compared to the MSU + M + NC group (P < 0·01).
Fig. 7.
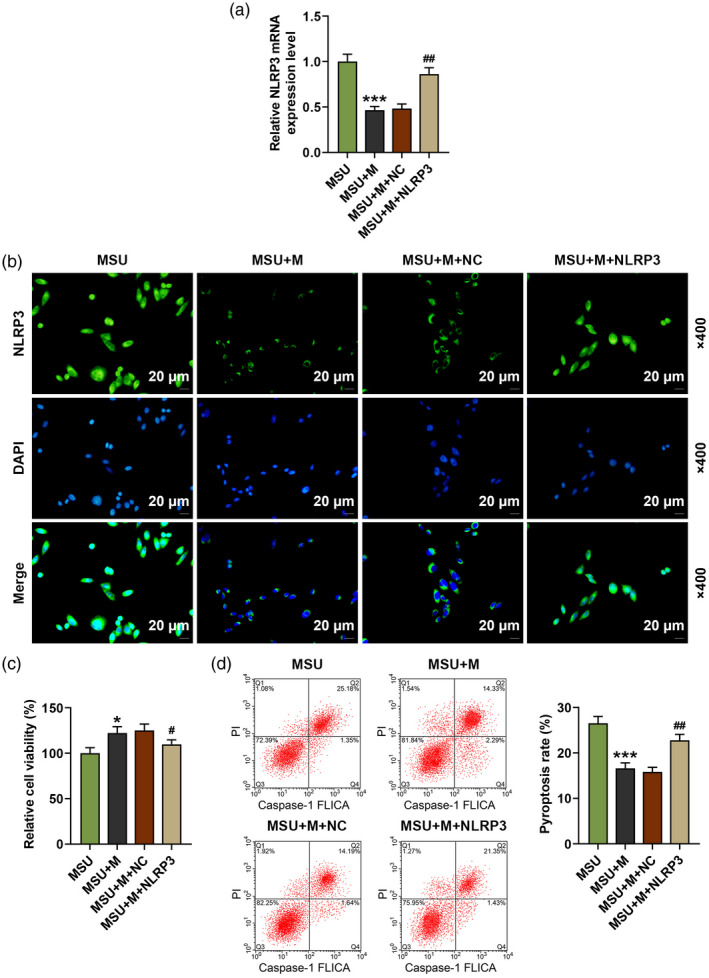
NLR family pyrin domain containing 3 (NLRP3) over‐expression reversed the effect of miR‐223‐3p mimic on the viability, pyroptosis and the expression of NLRP3 in monosodium urate (MSU)‐induced fibroblast‐like synoviocytes (FLSs). (a) The expression of NLRP3 in the rat FLSs after treatment with MSU and transfection with miR‐223‐3p mimic or NLRP3 was detected by reverse transcription–quantitative polymerase chain reaction (RT–qPCR); β‐actin was used as an internal control; (b) the expression of NLRP3 in the rat FLSs after treatment with MSU and transfection with miR‐223‐3p mimic or NLRP3 was detected by immunofluorescence; (c) the viability of the rat FLSs after treatment with MSU and transfection with miR‐223‐3p mimic or NLRP3 was detected by methyl thiazolyl tetrazolium (MTT); (d) the pyroptosis of the rat FLSs after treatment with MSU and transfection with miR‐223‐3p mimic or NLRP3 was detected by flow cytometry (* P < 0·05, *** P < 0·001, versus MSU; # P < 0·05, ## P < 0·01, versus MSU + M + NC). M: miR‐223‐3p mimic; NC: negative control.
Fig. 8.
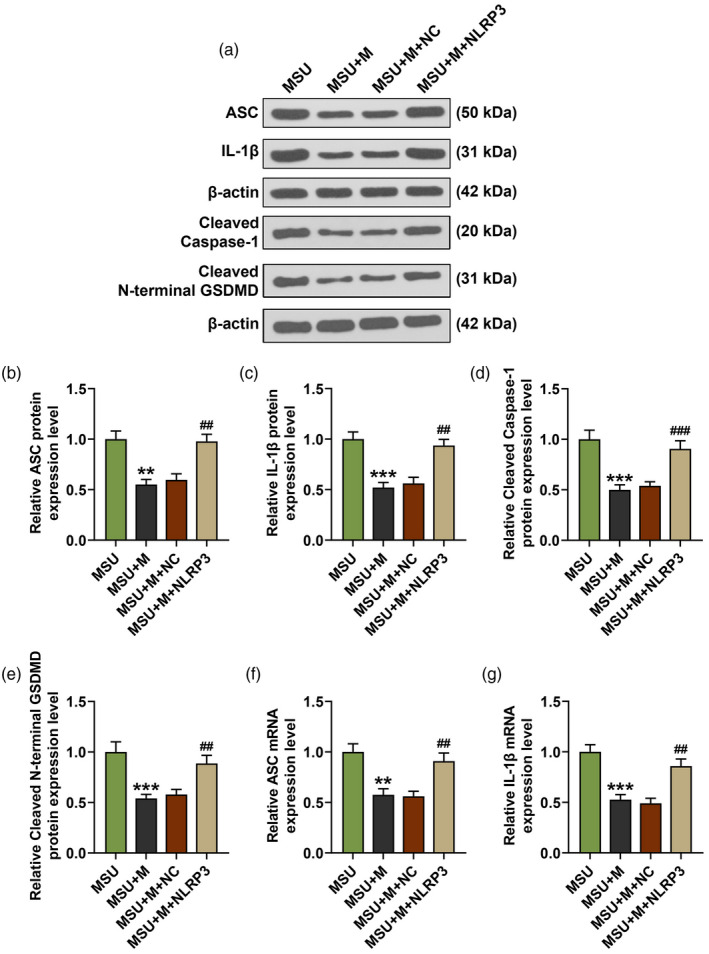
NLR family pyrin domain containing 3 (NLRP3) over‐expression reversed the effect of miR‐223‐3p mimic on the expressions of apoptosis‐associated speck‐like protein, cleaved caspase‐1, cleaved N‐terminal gasdermin D (GSDMD) and interleukin (IL‐1β) in monosodium urate (MSU)‐induced FLSs. (a–e) The expressions of apoptosis‐associated speck‐like protein (ASC), cleaved caspase‐1, cleaved N‐terminal GSDMD and IL‐1β in the rat fibroblast‐like synoviocytes after treatment with MSU and transfection with miR‐223‐3p mimic or NLRP3 was detected by Western blot; β‐actin was used as an internal control; (f,g) the expressions of ASC and IL‐1β in the rat FLSs after treatment with MSU and transfection with miR‐223‐3p mimic or NLRP3 was detected by reverse transcription–quantitative polymerase chain reaction (RT–qPCR). (** P < 0.01, *** P < 0.001, versus MSU; ## P < 0.01, versus MSU+M+NC). M: miR‐223‐3p mimic; NC: negative control.
Discussion
In the current study, we found that NLRP3 was a target of miR‐223‐3p and miR‐223‐3p was down‐regulated, while NLRP3 was up‐regulated in MSU‐induced GA rats and FLSs. After transfecting miR‐223‐3p mimic, miR‐223‐3p inhibitor and NLRP3 over‐expression plasmids into MSU‐induced FLSs, we found that miR‐223‐3p mimic reversed the lowered cell viability, increased pyroptosis and down‐regulated levels of pyroptosis and inflammation‐related factors in MSU‐induced FLSs, and miR‐223‐3p inhibitor further enhanced the performance of MSU‐induced FLSs. Also, NLRP3 over‐expression reversed the effect of miR‐223‐3p mimic on MSU‐induced FLSs. Our findings revealed that miR‐223‐3p inhibited the inflammation and pyroptosis of MSU‐induced FLSs by targeting NLRP3, which indicated that miR‐223‐3p could be used as a biomarker for the treatment of GA.
The onset of GA is triggered by the accumulation of excessive uric acid and MSU crystal formation in the joints and surrounding tissues [1, 4]. Therefore, MSU crystals were prepared and used to establish the GA rat model. The main clinical features of GA attack are inflammatory cell infiltration, joint swelling, severe pain and obvious hindered mobility of affected joints [1, 4, 7]. In the present study, we discovered that the paw volume and gait score were increased and the joint dysfunction was enhanced by MSU, which indicated that the MSU‐induced GA rat model was successfully established.
The main link of MSU crystal‐induced inflammation is the recognition and response of the mononuclear phagocyte system [6, 19, 20]. In this system, MSU crystal was mainly identified by Toll‐like receptors (TLRs) on mononuclear macrophages [20, 21, 22]. TLRs are the main cell receptors of the host’s innate defense system and are an important part of the body’s innate immune system [22]. After MSU was identified by TLRs, NLRP3 was further activated, which could further trigger a series of inflammatory responses [23, 24, 25]. In this study, we also found that the expression of NLRP3 in synovial tissue of MSU‐induced GA rats and FLSs was up‐regulated. NLRP3, a member of the NOD‐like receptor family and a cytoplasmic protein in inflammatory response, was also reported to exert a regulatory effect on breast cancer cells, human immune cells and cartilage cells as well as GA [13, 14, 15], and the effect of NLRP3 on these cells was regulated by miR‐223‐3p [13, 14, 15]. The targeting relationship between miR‐223‐3p and NLRP3 was further verified in this study. It is worth noting that miR‐223‐3p was reported to be a biomarker for early rheumatoid arthritis, as down‐regulation of miR‐223‐3p was found in early rheumatoid arthritis [16]. In this study, down‐regulated miR‐223‐3p was also discovered in MSU‐induced GA rats and FLSs for the first time, which made us wonder whether miR‐223‐3p had a modulatory effect on GA by targeting NLRP3.
After NLRP3 was activated, its effector domain would recruit ASC (an apoptosis‐associated speck‐like protein) and further reacted with caspase‐1 [26]. Our results also showed that the expression of ASC and cleaved caspase‐1 were up‐regulated in MSU‐induced GA rats and FLSs and the up‐regulated levels were reversed by miR‐223‐3p mimic and enhanced by miR‐223‐3p inhibitor. In addition, the effects of miR‐223‐3p mimic on the expression of ASC and cleaved caspase‐1 in MSU‐induced FLSs were further reversed by NLRP3 over‐expression. Caspase‐1, also called IL‐1β‐converting enzyme, could cleave the inactive IL‐1β precursors in the cell and promote the formation of mature IL‐1β [26, 27]. After binding to the IL‐1 receptor, IL‐1β activates the IL‐1 signal transduction pathway, resulting in the expression of a large number of proinflammatory factors, such as IL‐1β and TNF‐α, and the amplification of inflammation cascade [27, 28, 29]. Therefore, we further detected the expression of IL‐1β and TNF‐α in MSU‐induced GA rats and FLSs, and found that the expression of IL‐1β and TNF‐α were up‐regulated; also, these up‐regulated levels were reversed by miR‐223‐3p mimic and enhanced by miR‐223‐3p inhibitor. In addition, the effects of miR‐223‐3p mimic on the expressions of IL‐1β and TNF‐α in MSU‐induced FLSs were further reversed by NLRP3 over‐expression. Inflammation and the formation of mature IL‐1β and cleaved caspase‐1 together contributed to pyroptosis according to the report [30]. The study illustrated that activated NLRP3 recruited the adaptor protein ASC and aggregated to form an inflammasome complex. The precursor of caspase‐1 was recruited and activated, and pro‐IL‐1β was processed to form mature IL‐1β miR‐223‐3p regulating NLRP3 activation to recruit ASC, forming an inflammasome complex for further progression.
In this study, our results exhibited that the high levels of cleaved N‐terminal GSDMD (a key factor of pyroptosis) and pyroptosis in MSU‐induced GA rats and FLSs were reversed by miR‐223‐3p mimic and enhanced by miR‐223‐3p inhibitor, and the effect of miR‐223‐3p mimic was still reversed by NLRP3 over‐expression. These results further verified that miR‐223‐3p had the ability to regulate the inflammation and pyroptosis in MSU‐induced GA rats and FLSs by regulating NLRP3.
The effects of MiR‐223‐3p on MSU mode in vivo would be more reliable than in‐vitro results, which was a limitation of this research and should be studied in future.
In conclusion, our study revealed that miR‐223‐3p inhibited the inflammation and pyroptosis in MSU‐induced rats and FLSs by targeting NLRP3, which could be used as a biomarker for the treatment of GA.
Disclosures
The authors declare no conflicts of interest.
Author contributions
Substantial contributions to conception and design: J. T. Data acquisition, data analysis and interpretation: D. P. Z., L. B. X., X. W. L., H. R. Z., B. C. W., B. X.
Drafting the article or critically revising it for important intellectual content: J. T. Final approval of the version to be published: all authors. Agreement to be accountable for all aspects of the work in ensuring that questions related to the accuracy or integrity of the work are appropriately investigated and resolved: all authors.
Ethics statement
All trials involving rats were approved by the Committee of Experimental Animals of General Hospital of Northern Theater Command (Z20190726Z) and were also performed in General Hospital of Northern Theater Command.
Acknowledgements
This work was supported by the Liaoning Provincial Natural Science Foundation of China [2019‐MS‐350].
Data Availability Statement
The analyzed data sets generated during the study are available from the corresponding author on reasonable request.
Reference
- 1. Zhang F, Liu S, Jin L et al. Antinociceptive efficacy of retigabine and flupirtine for gout arthritis pain. Pharmacology 2020;1–6. [DOI] [PubMed] [Google Scholar]
- 2. Parthasarathy P, Vivekanandan S. Urate crystal deposition, prevention and various diagnosis techniques of GOUT arthritis disease: a comprehensive review. Health Inform Sci Syst 2018; 6:19. [DOI] [PMC free article] [PubMed] [Google Scholar]
- 3. Chai W, Tai Y, Shao X et al. Electroacupuncture alleviates pain responses and inflammation in a rat model of acute gout arthritis. Evid Based Compl Alternat Med 2018; 2018:2598975. [DOI] [PMC free article] [PubMed] [Google Scholar]
- 4. Yin C, Liu B, Wang P et al. Eucalyptol alleviates inflammation and pain responses in a mouse model of gout arthritis. Br J Pharmacol 2020; 177:2042–57. [DOI] [PMC free article] [PubMed] [Google Scholar]
- 5. Dirken‐Heukensfeldt KJ, Teunissen TA, van de Lisdonk H, Lagro‐Janssen AL. Clinical features of women with gout arthritis. A systematic review. Clin Rheumatol 2010; 29:575–82. [DOI] [PMC free article] [PubMed] [Google Scholar]
- 6. Li X, Xu DQ, Sun DY, Zhang T, He X, Xiao DM. Curcumin ameliorates monosodium urate‐induced gouty arthritis through Nod‐like receptor 3 inflammasome mediation via inhibiting nuclear factor‐kappa B signaling. J Cell Biochem 2019; 120:6718–28. [DOI] [PubMed] [Google Scholar]
- 7. Staurengo‐Ferrari L, Ruiz‐Miyazawa KW, Pinho‐Ribeiro FA et al. Trans‐chalcone attenuates pain and inflammation in experimental acute gout arthritis in mice. Front Pharmacol 2018; 9:1123. [DOI] [PMC free article] [PubMed] [Google Scholar]
- 8. Szekanecz Z, Szamosi S, Kovacs GE, Kocsis E, Benko S. The NLRP3 inflammasome ‐ interleukin 1 pathway as a therapeutic target in gout. Arch Biochem Biophys 2019; 670:82–93. [DOI] [PubMed] [Google Scholar]
- 9. Mian W, Zhang M, Ma Y et al. Chaetocin attenuates gout in mice through inhibiting HIF‐1α and NLRP3 inflammasome‐dependent IL‐1β secretion in macrophages. Arch Biochem Biophys 2019; 670:94–103. [DOI] [PubMed] [Google Scholar]
- 10. Goldberg EL, Asher JL, Molony RD et al. β‐Hydroxybutyrate deactivates neutrophil NLRP3 Inflammasome to relieve gout flares. Cell Rep 2017; 18:2077–87. [DOI] [PMC free article] [PubMed] [Google Scholar]
- 11. Lee HE, Yang G, Park YB et al. Epigallocatechin‐3‐gallate prevents acute gout by suppressing NLRP3 inflammasome activation and mitochondrial DNA synthesis. Molecules 2019; 24:2138. [DOI] [PMC free article] [PubMed] [Google Scholar]
- 12. Wang Y, Lin Z, Zhang B, Jiang Z, Guo F, Yang T. Cichorium intybus L. extract suppresses experimental gout by inhibiting the NF‐κB and NLRP3 signaling pathways. Int J Mol Sci 2019; 20:4921. [DOI] [PMC free article] [PubMed] [Google Scholar]
- 13. Dong HC, Li PN, Chen CJ et al. Sinomenine attenuates cartilage degeneration by regulating miR‐223‐3p/NLRP3 inflammasome signaling. Inflammation 2019; 42:1265–75. [DOI] [PubMed] [Google Scholar]
- 14. Zhang L, Li H, Zang Y, Wang F. NLRP3 inflammasome inactivation driven by miR2233p reduces tumor growth and increases anticancer immunity in breast cancer. Mol Med Rep 2019; 19:2180–8. [DOI] [PMC free article] [PubMed] [Google Scholar]
- 15. Pachathundikandi SK, Backert S. Helicobacter pylori controls NLRP3 expression by regulating hsa‐miR‐223‐3p and IL‐10 in cultured and primary human immune cells. Innate Immun 2018; 24:11–23. [DOI] [PMC free article] [PubMed] [Google Scholar]
- 16. Dunaeva M, Blom J, Thurlings R, Pruijn GJM. Circulating serum miR‐223‐3p and miR‐16‐5p as possible biomarkers of early rheumatoid arthritis. Clin Exp Immunol 2018; 193:376–85. [DOI] [PMC free article] [PubMed] [Google Scholar]
- 17. Chen G, Jia P, Yin ZY, Kong SZ, Xiang ZB, Zheng XX. Paeonol ameliorates monosodium urate‐induced arthritis in rats through inhibiting nuclear factor‐κB‐mediated proinflammatory cytokine production. Phytother Res 2019; 33:2971–8. [DOI] [PubMed] [Google Scholar]
- 18. Coderre TJ, Wall PD. Ankle joint urate arthritis (AJUA) in rats: an alternative animal model of arthritis to that produced by Freund's adjuvant. Pain 1987; 28:379–93. [DOI] [PubMed] [Google Scholar]
- 19. Zhu W, Deng Y, Zhou X. Multiple membrane transporters and some immune regulatory genes are major genetic factors to gout. Open Rheumatol J 2018; 12:94–113. [DOI] [PMC free article] [PubMed] [Google Scholar]
- 20. Yao X, Ding Z, Xia Y et al. Inhibition of monosodium urate crystal‐induced inflammation by scopoletin and underlying mechanisms. Int Immunopharmacol 2012; 14:454–62. [DOI] [PubMed] [Google Scholar]
- 21. Liu‐Bryan R, Scott P, Sydlaske A, Rose DM, Terkeltaub R. Innate immunity conferred by Toll‐like receptors 2 and 4 and myeloid differentiation factor 88 expression is pivotal to monosodium urate monohydrate crystal‐induced inflammation. Arthritis Rheum 2005; 52:2936–46. [DOI] [PubMed] [Google Scholar]
- 22. Zhou F, Mei J, Han X et al. Kinsenoside attenuates osteoarthritis by repolarizing macrophages through inactivating NF‐κB/MAPK signaling and protecting chondrocytes. Acta Pharm Sin B 2019; 9:973–85. [DOI] [PMC free article] [PubMed] [Google Scholar]
- 23. He Y, Hara H, Nunez G. Mechanism and Regulation of NLRP3 Inflammasome Activation. Trends Biochem Sci 2016; 41:1012–21. [DOI] [PMC free article] [PubMed] [Google Scholar]
- 24. Arterbery AS, Yao J, Ling A et al. Inflammasome priming mediated via toll‐like receptors 2 and 4, induces Th1‐like regulatory T cells in de novo autoimmune hepatitis. Front Immunol 2018; 9:1612. [DOI] [PMC free article] [PubMed] [Google Scholar]
- 25. Zhong Z, Liang S, Sanchez‐Lopez E et al. New mitochondrial DNA synthesis enables NLRP3 inflammasome activation. Nature 2018; 560:198–203. [DOI] [PMC free article] [PubMed] [Google Scholar]
- 26. Wang Z, Meng S, Cao L, Chen Y, Zuo Z, Peng S. Critical role of NLRP3‐caspase‐1 pathway in age‐dependent isoflurane‐induced microglial inflammatory response and cognitive impairment. J Neuroinflammation 2018; 15:109. [DOI] [PMC free article] [PubMed] [Google Scholar]
- 27. Alarcon MML, Ruocco JF, Ferreira F et al. TLR4 and NLRP3 caspase 1‐ IL‐1β‐ axis are not involved in colon ascendens stent peritonitis (Casp)‐associated heart disease. Shock 2018; 50:483–92. [DOI] [PubMed] [Google Scholar]
- 28. Zhang T, Du H, Feng S et al. NLRP3/ASC/caspase‐1 axis and serine protease activity are involved in neutrophil IL‐1β processing during Streptococcus pneumoniae infection. Biochem Biophys Res Commun 2019; 513:675–80. [DOI] [PubMed] [Google Scholar]
- 29. Zhang B, Jiang W. IL‐1β, IL‐17A, CRP and biologics history might serve as potential markers for clinical response to etanercept in rheumatoid arthritis patients. Inflammopharmacology 2019; 27:1123–30. [DOI] [PubMed] [Google Scholar]
- 30. Mendonca LSO, Santos JM, Kaneto CM et al. Characterization of serum cytokines and circulating microRNAs that are predicted to regulate inflammasome genes in cutaneous leishmaniasis patients. Exp Parasitol 2020; 210:107846. [DOI] [PubMed] [Google Scholar]
Associated Data
This section collects any data citations, data availability statements, or supplementary materials included in this article.
Data Availability Statement
The analyzed data sets generated during the study are available from the corresponding author on reasonable request.


